- To move slides, use the arrow keys or swipe on your mobile device
- To see the speaker notes, press "s"
- To go to full screen, press "f"
- To print as PDF, go to this URL: ?print-pdf, then print.
- To get a PDF with speaker notes, add ?print-pdf&showNotes=true to the URL.
Star Formation in Crowds
YSOs in protoclusters
Adam Ginsburg
Assistant Professor
Department of Astronomy
University of Florida, Gainesville
- Postdoc: Allison Towner
- PhD: Desmond Jeff, Theo Richardson, Alyssa Bulatek, Nazar Budaiev
- REU: Justin Otter, Danielle Bovie, Josh Machado
- Undergrad: Madeline Hall, Michael Fero, Derod Deal, Parker Ormonde
Slides available at https://keflavich.github.io/talks/colloquium_Nov2020_MPIfR.html
Star formation drives the evolution of the universe
Star Formation oversimplified
Ṁ
The star formation rate, i.e., how much gas turns to stars
L / M
The light per unit mass, i.e., how stars and stellar populations turn matter into light
High-mass stars produce photons & heavy elements
low-mass stars live practically forever
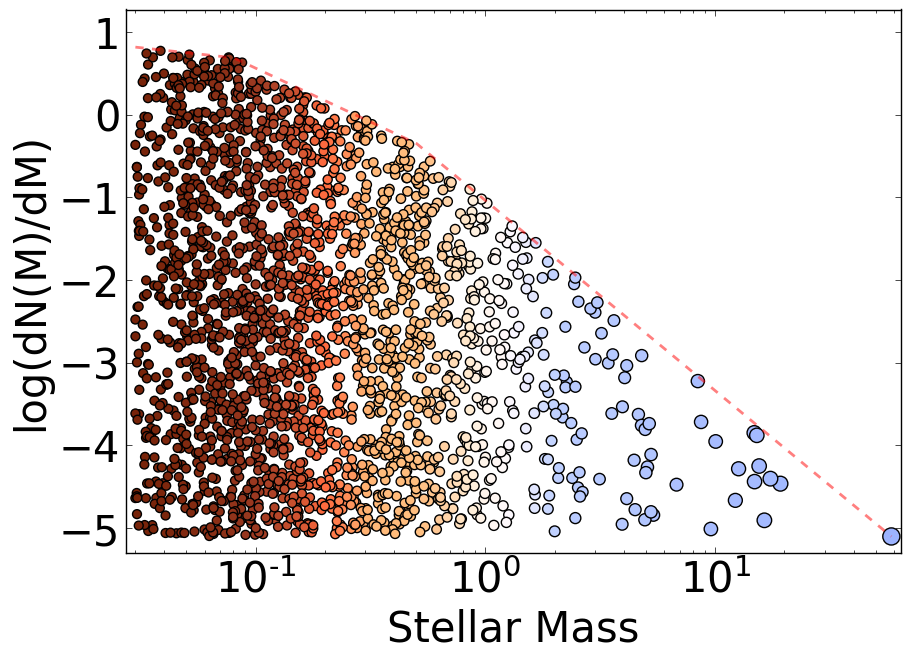
Point color shows effective temperature, point size shows luminosity (left) and mass (right)
The stellar initial mass function (IMF)
Stars are randomly sampled from this distribution
Almost all of the light in star-forming galaxies is produced by high-mass stars
The stars form in and from gas
Most of what we know of star formation in detail comes from small local clouds
Most of what we know of star formation in detail comes from small local clouds
Cartoon of low-mass star formation
A molecular cloud fragments
The core forms a central protostar
The protostar heats its parent core and forms a disk
It drives an outflow and consumes or blows out its core
Eventually, you end with just a star-disk system
Cartoon of low-mass star formation
Most of what we know of star formation in detail comes from small local clouds
They contain only low-mass stars and do not represent star formation in general
Most stars form in denser regions
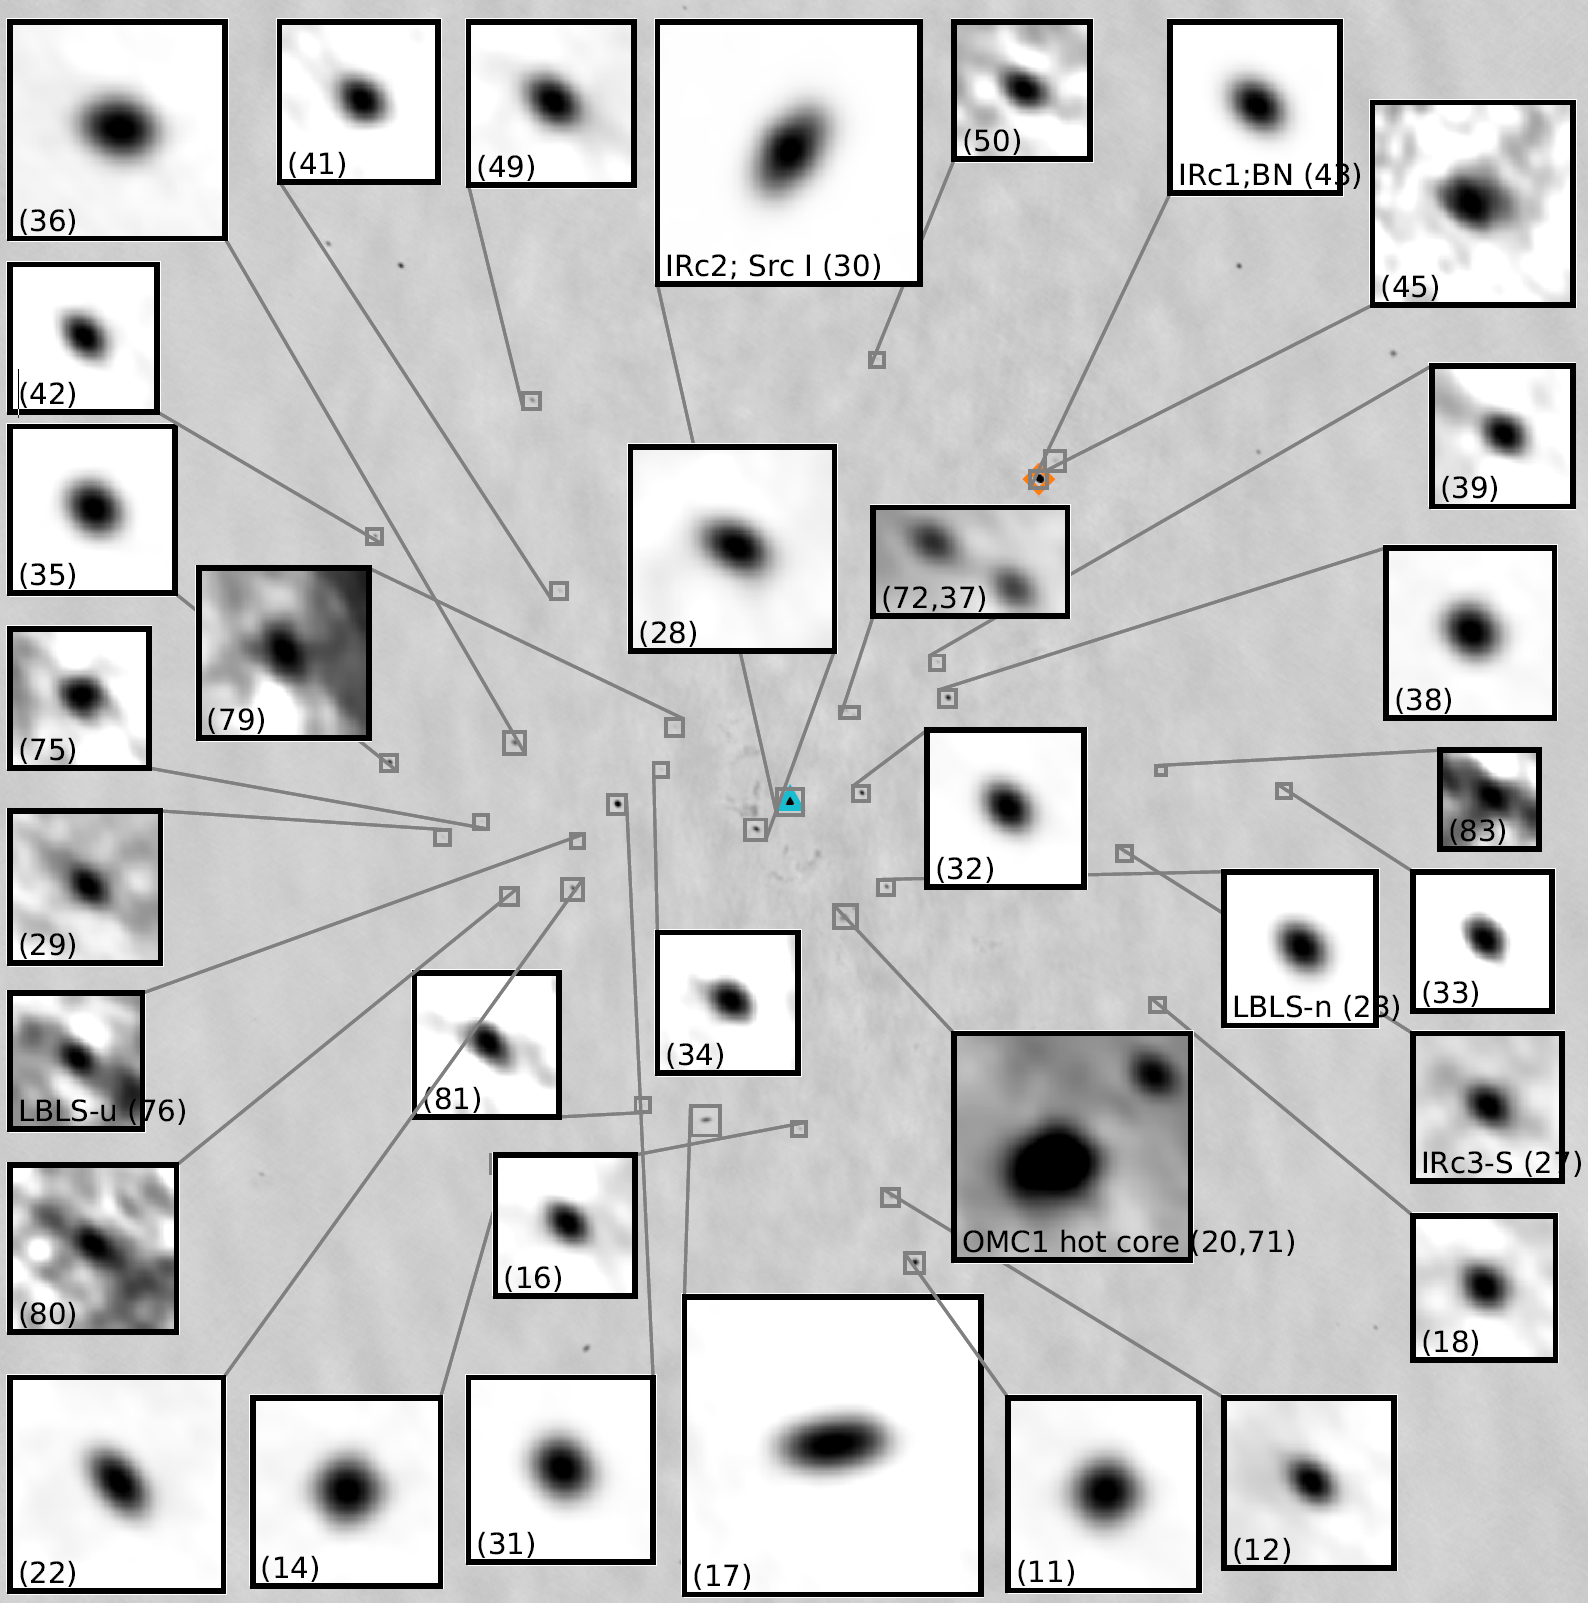
 Otter+, submitted soon
FOV: 0.07 pc (16000 AU)
72 YSOs
One "hot core"
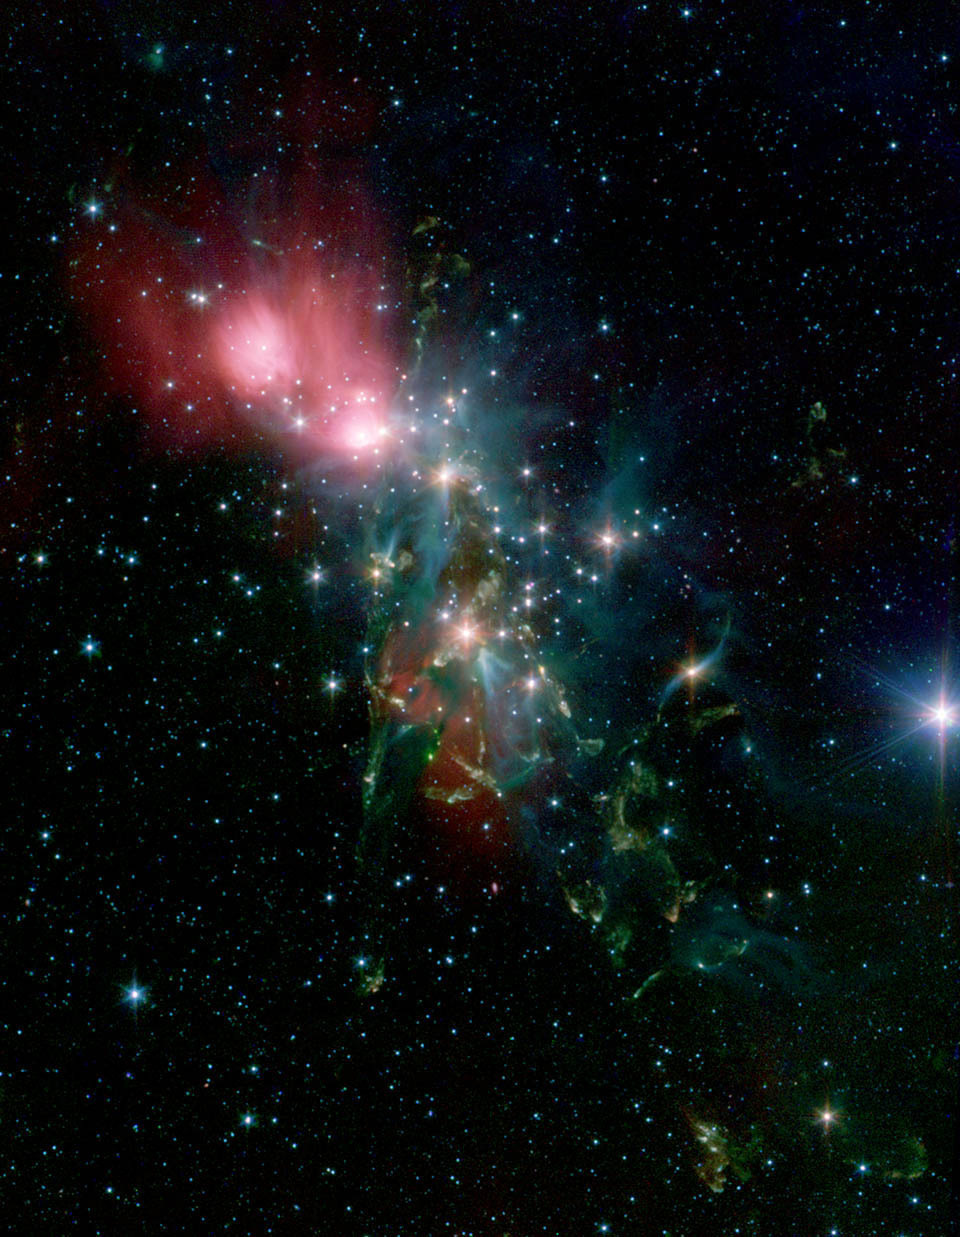
Most stars form in denser regions
NGC 1333, an embedded low-mass cluster
Lada & Lada 2003: >70% in embedded clusters
Most stars form in denser regions
NGC 3603 is a high-mass (104 M⊙) cluster
Lada & Lada 2003:
5-10% in bound clusters
in our Galaxy
5-10% in bound clusters
in our Galaxy
Star formation drives the evolution of the universe
Most stars in most galaxies formed long ago
Galaxies were smaller & denser back then
The "Bound Cluster Fraction" was higher in the past
In denser (parts of) galaxies, more stars form in clusters
Γ is the fraction of stars forming in bound clusters
Galaxy averages
The "Bound Cluster Fraction" is predicted higher in the CMZ
Γ is the fraction of stars forming in bound clusters
Galaxy averages
CMZ prediction
The "Bound Cluster Fraction" is higher in the CMZ
Γ is the fraction of stars forming in bound clusters
Galaxy averages
CMZ prediction
Sgr B2 data
Sgr B2 data
How do we learn about clustering? The IMF?

- Count objects.
- Cores are sometimes countable.
- Protostars are countable.
YSO counting has taught us a lot in local clouds
The California molecular cloud with protostars
ALMA enables protostar counting in
distant, massive clouds
Sgr B2: the most massive & star-forming cloud in the Galaxy
Our own Galaxy's center, the CMZ, has denser gas than the Galactic average
Cold Dust
Hot, ionized gas
Hot dust/PAHs
Hot, ionized gas
Hot dust/PAHs
Our own Galaxy's center, the CMZ, has denser gas than the Galactic average
Our own Galaxy's center, the CMZ, has denser gas than the Galactic average
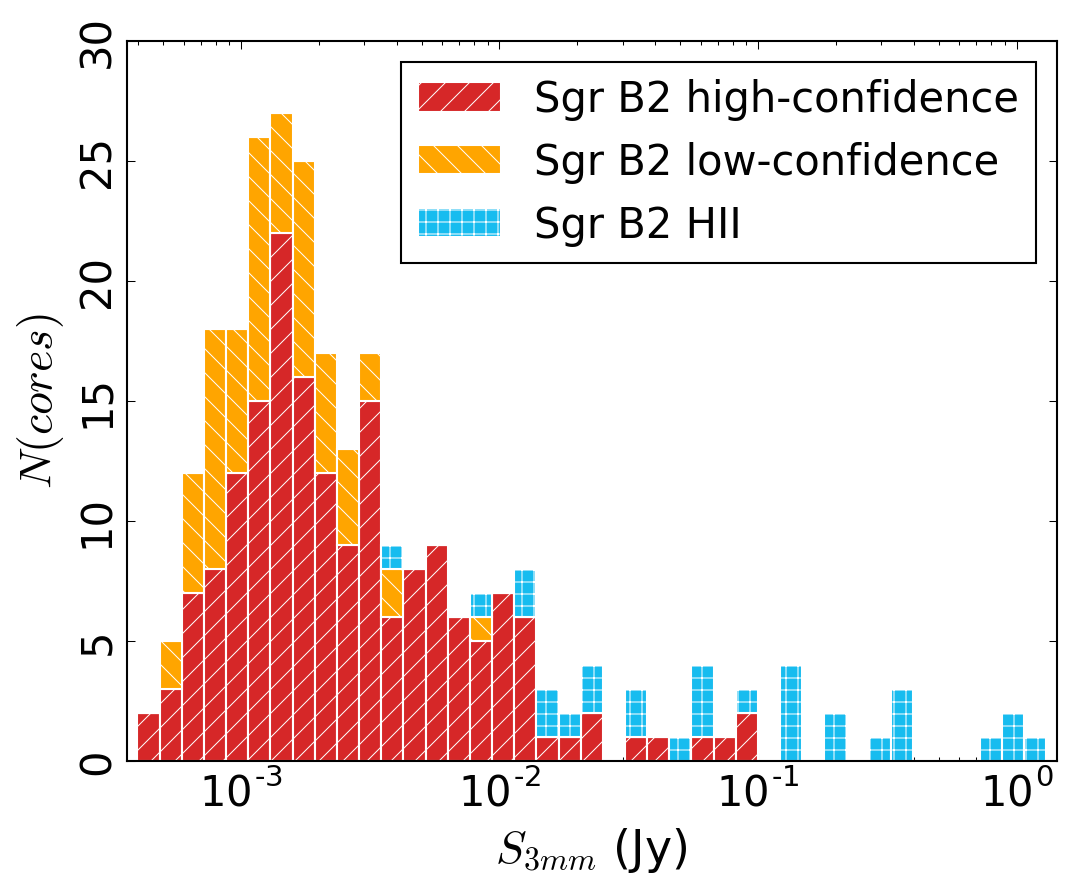
3mm Luminosity Function
What are the sources?
At this sensitivity, all are M>8⊙ YSOs
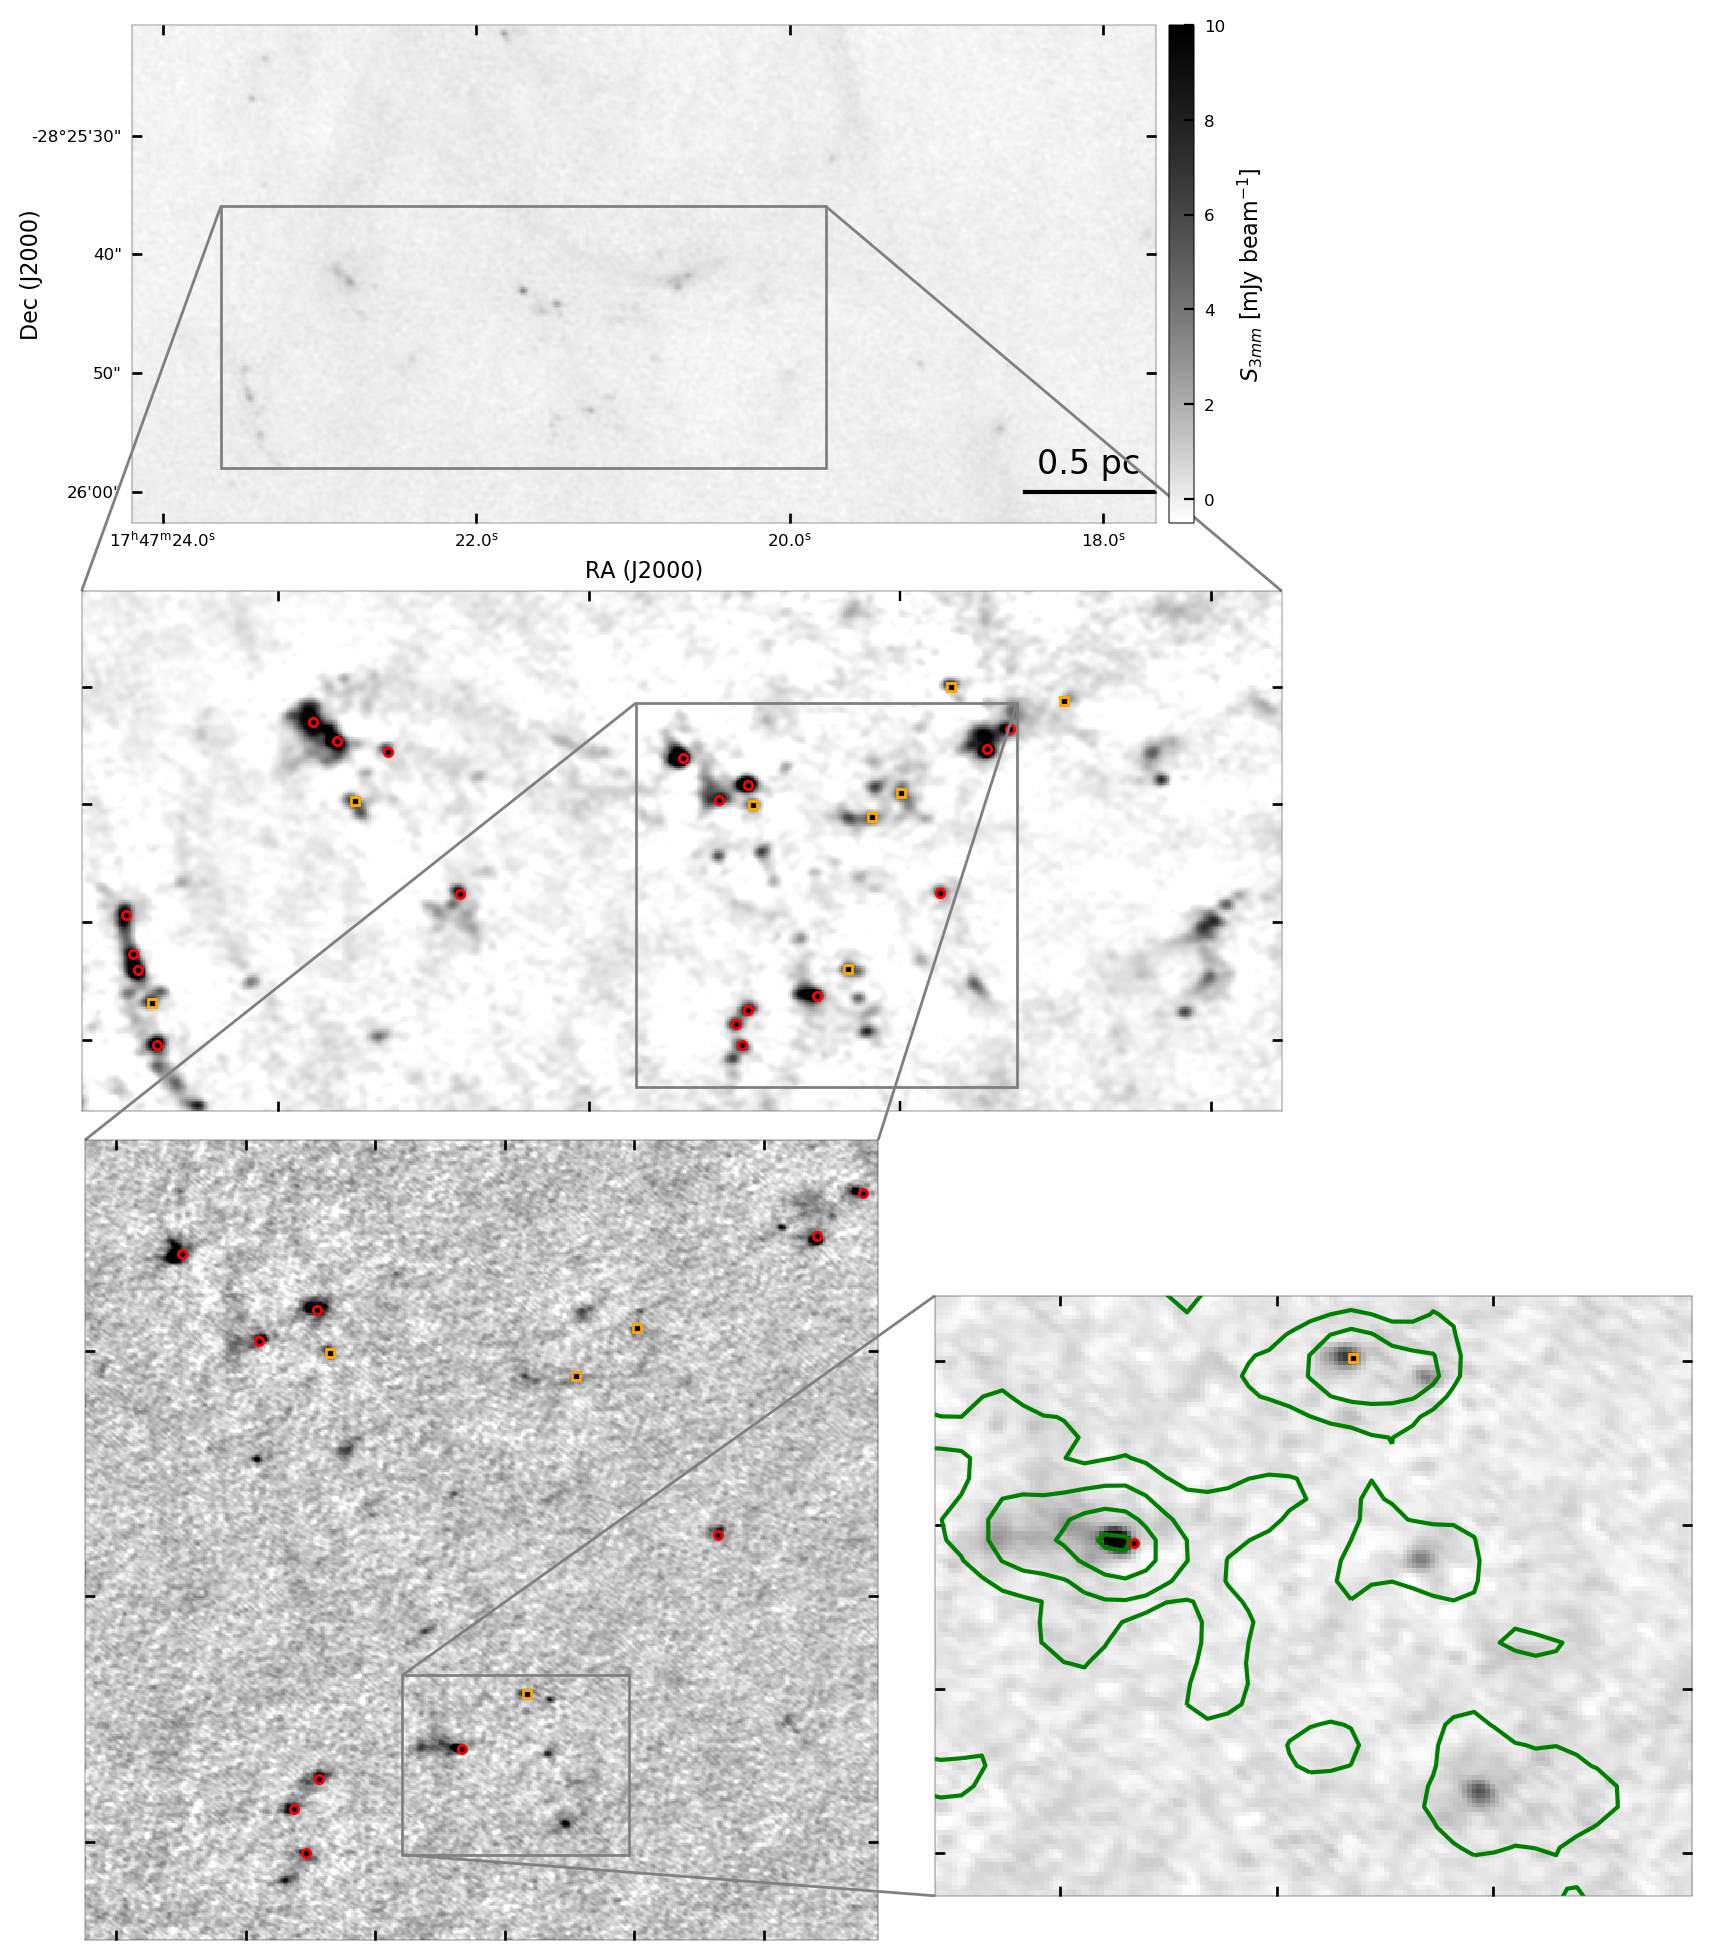
 Desmond Jeff: Hot Cores and YSOs in Sgr B2 DS
- Are there appropriate numbers of low-mass YSOs?
- Is the IMF 'normal'?
MYSO counts let us investigate thresholds
Local cloud studies support the idea of a gas density threshold for star formation
Thresholds are used in simulations to say
"if gas reaches this density, turn it into stars"
"if gas reaches this density, turn it into stars"
Compare YSO counts in Sgr B2 and the CMC
Is there a threshold?
Is there a threshold?
A threshold separates Sgr B2 from The Brick
From YSO counts to the IMF?
How do we measure the CMF if the cores all have YSOs in them?
Some CMF measurements in clusters have given us tantalizing hints of CMF variation...
YSO modeling → luminosity functions
NSF 2008101: "How are stellar masses set?"
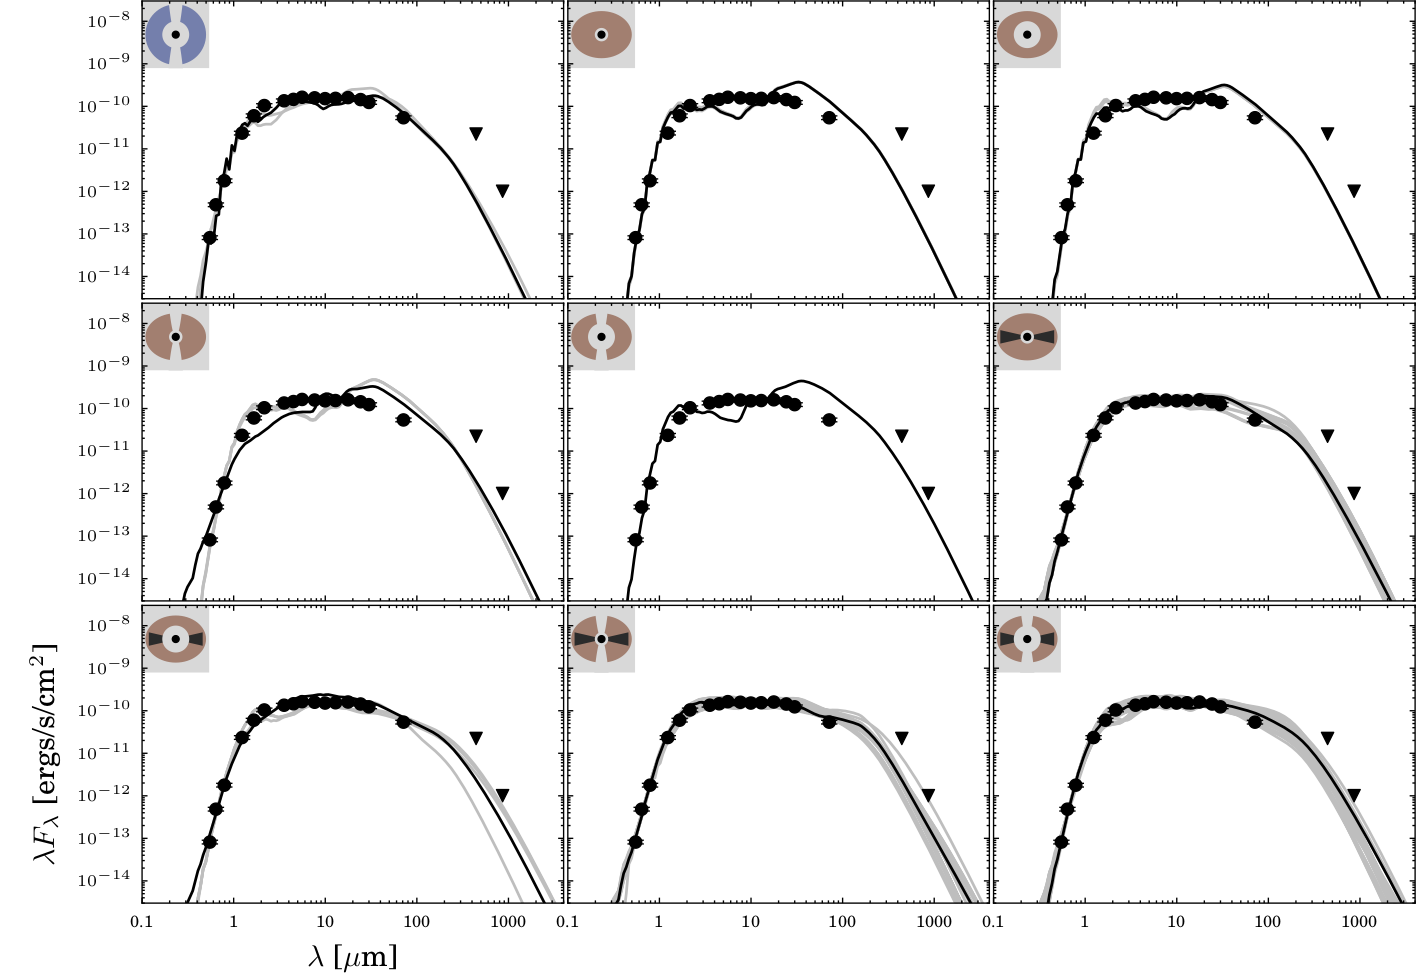
 Theo Richardson
Top-heavier IMFs are seen in high-mass clusters,
CMFs in protoclusters
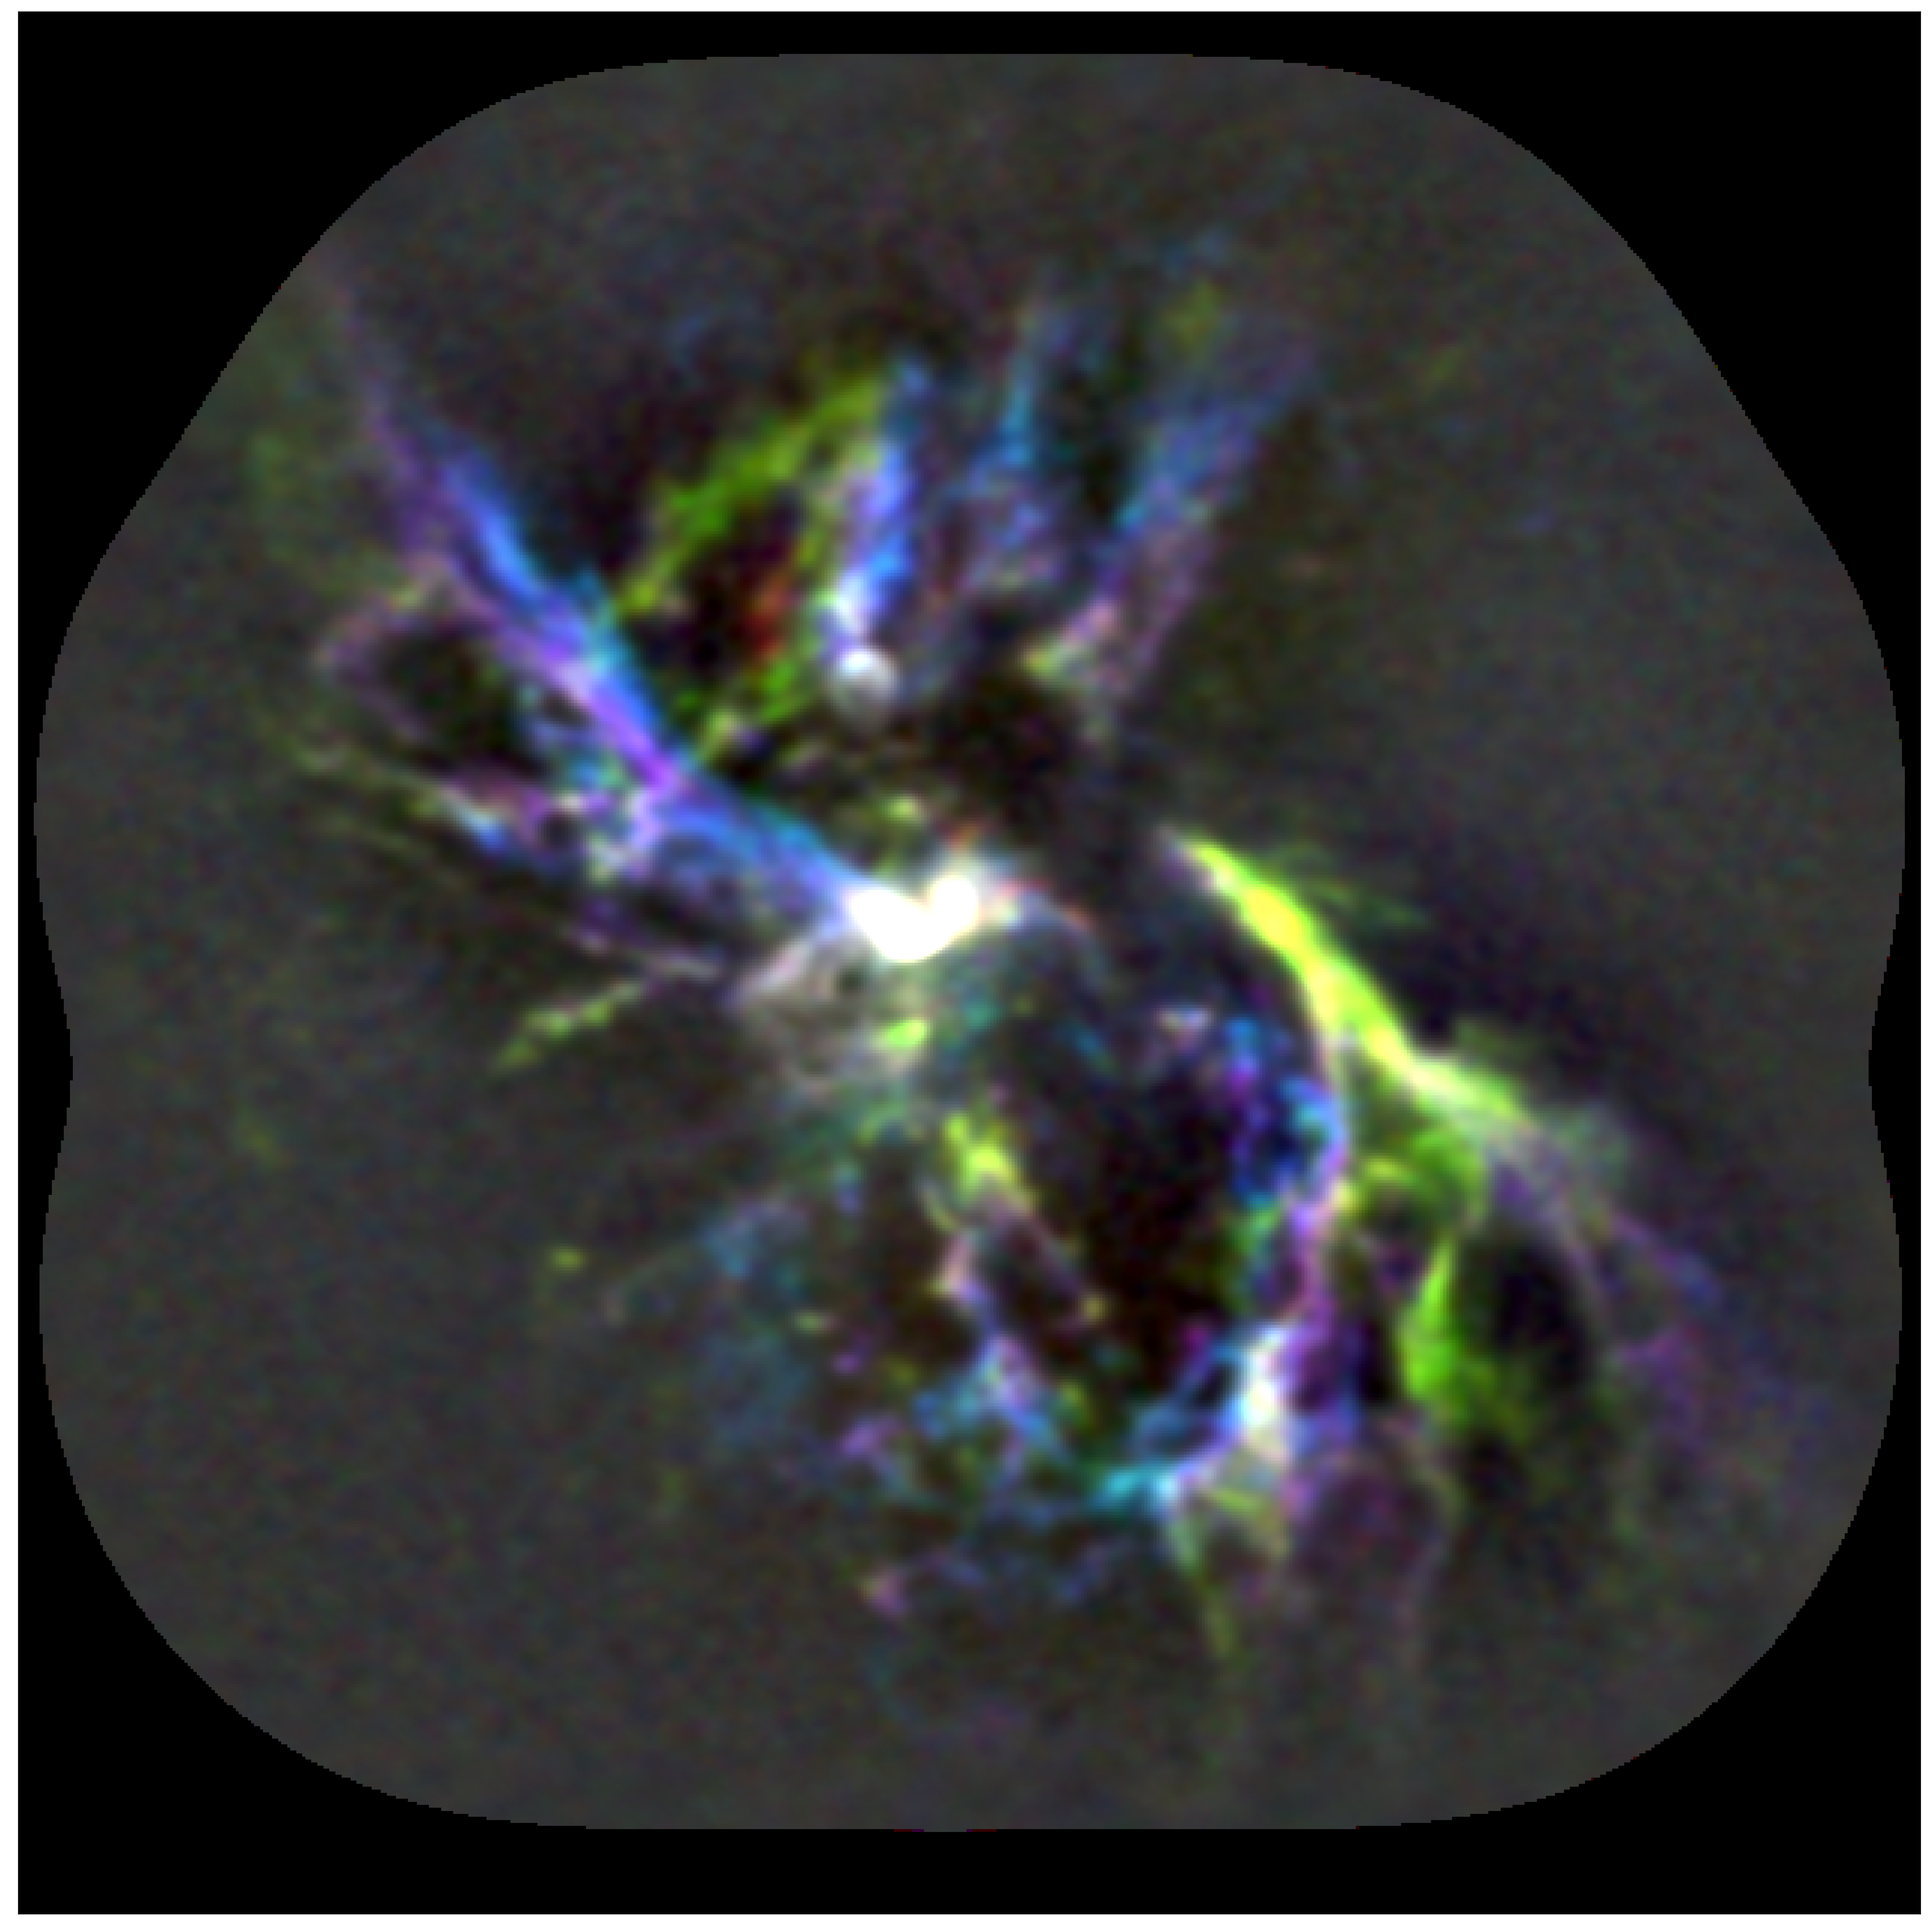
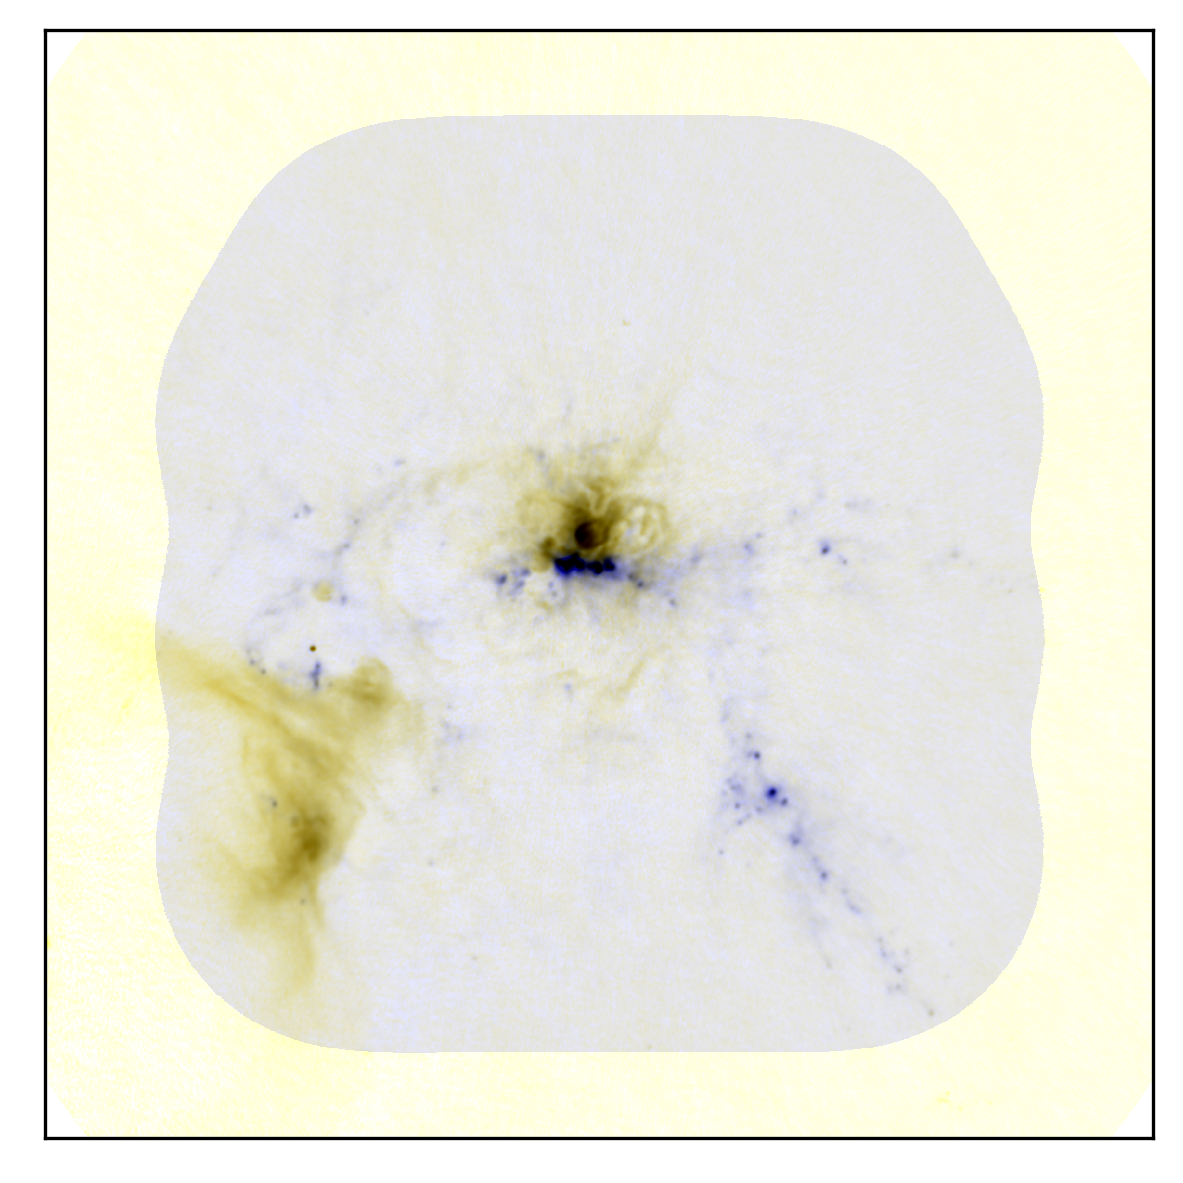
ALMA-IMF is the next step in CMF measurement & YSO counting
- Continuum data paper in prep (Ginsburg+, with big data reduction
team: Roberto Galvan-Madrid, Nichol Cunningham, Timea Csengeri,
Patricio Sanhueza, Fernando Olguin, Thomas Nony, Jordan Molet, Ana
Lopez, Yohan Pouteau, Andrez Guzman, Manuel Fernandez, Melisse
Bonfand)
- Self-calibration (10-500% dynamic range improvement)
- Mosaicing
- Continuum selection
- Method comparison
- Survey overview paper in prep (Motte+)
- Catalogue paper in prep (Louvet+)
ALMA-IMF data highlights
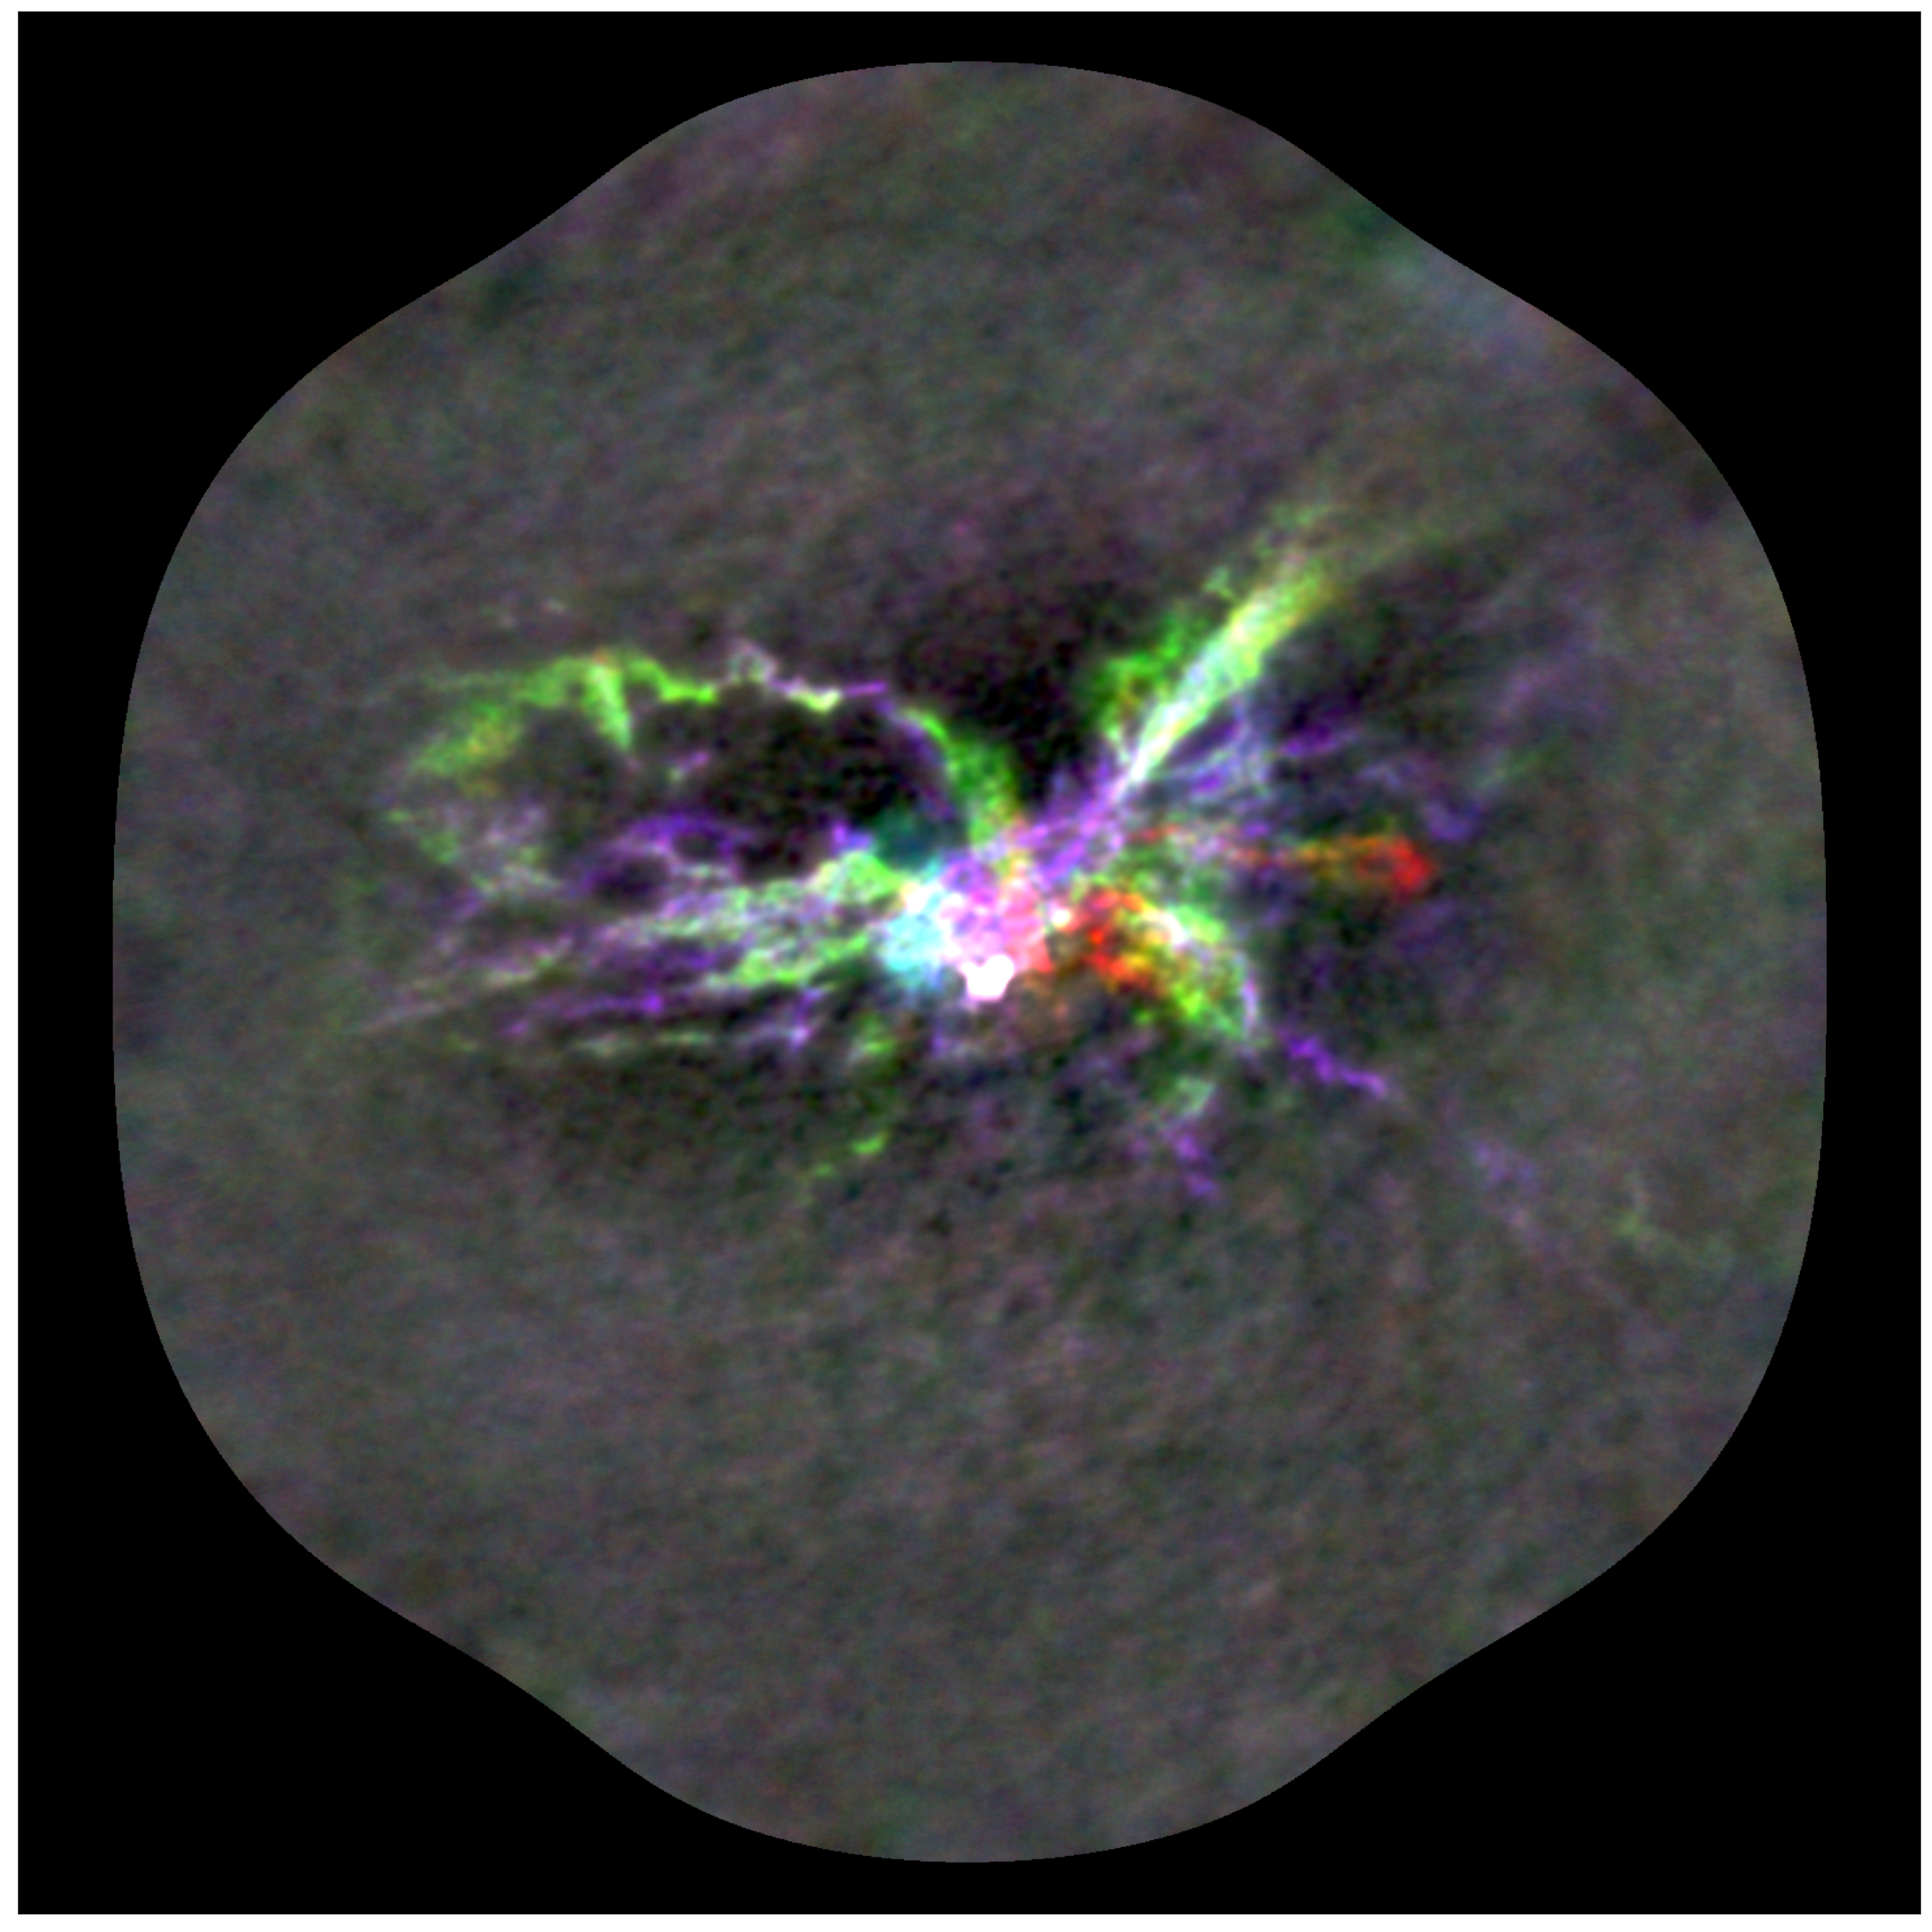
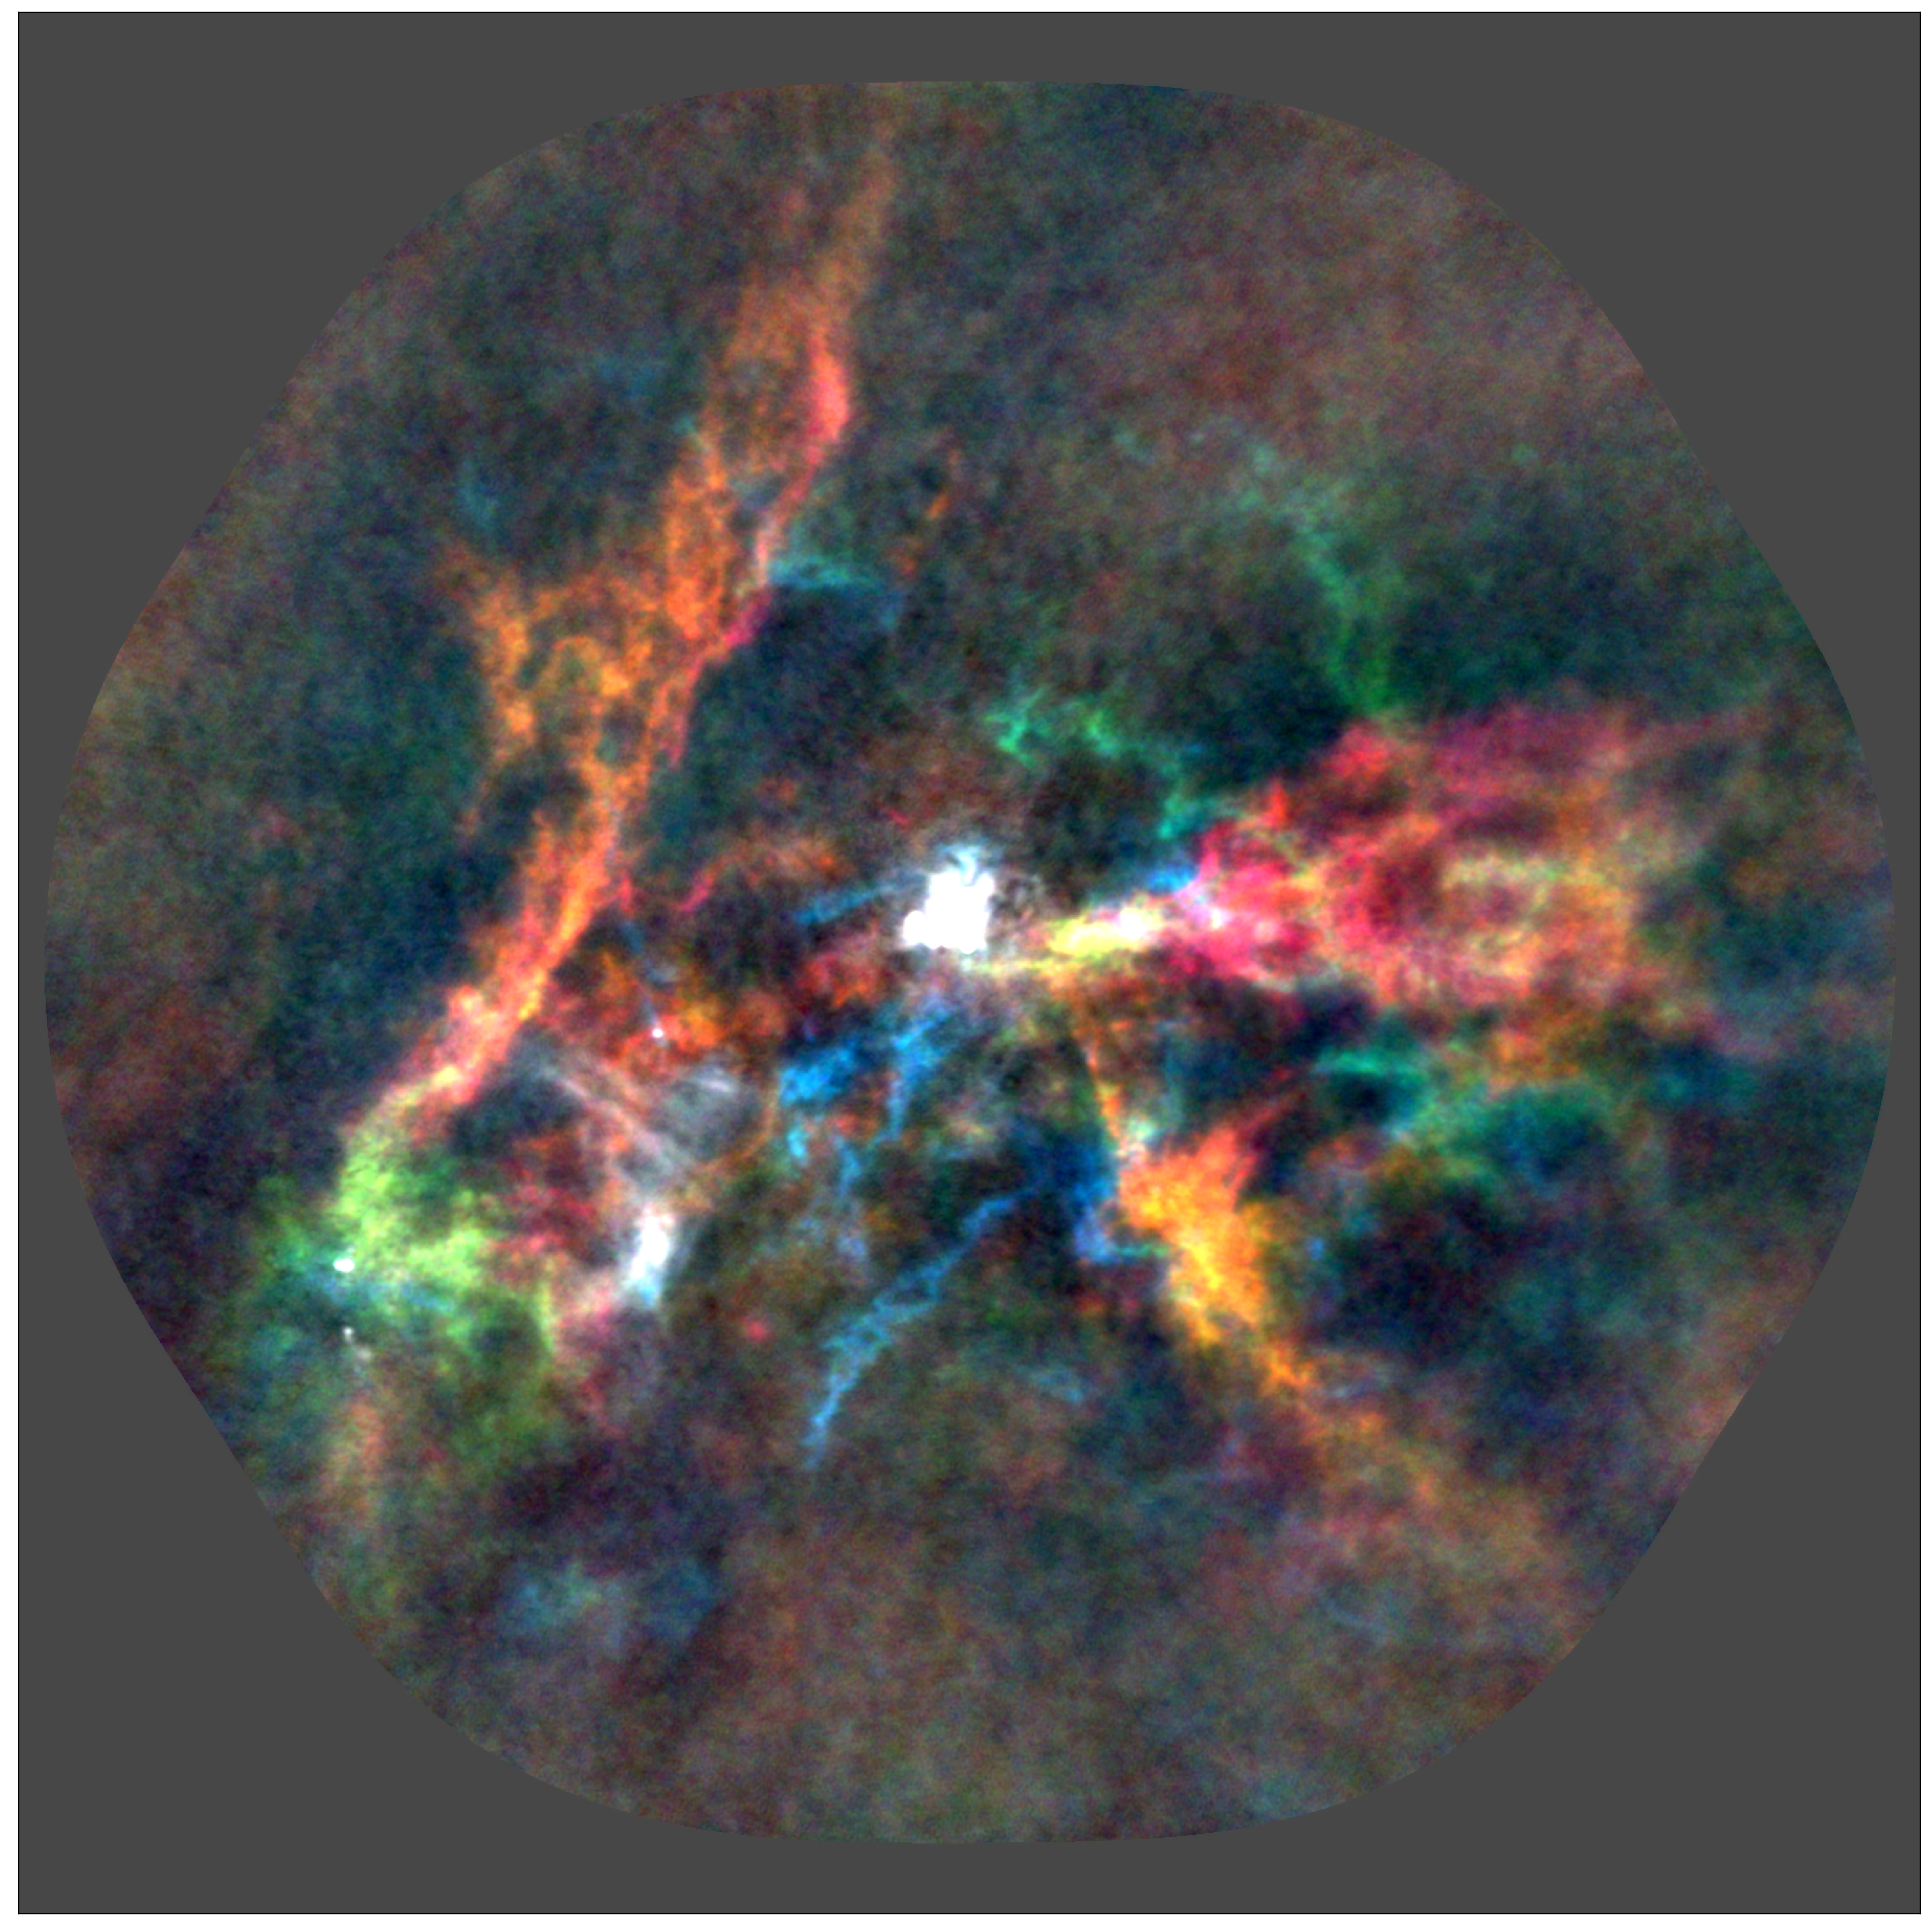


How do we measure masses?
On the top end, mass measurement is difficult:
Dynamical mass measurements are the gold standard.
- cores are optically thick
- cores are confused & blended
- the measured luminosity can be the sum of whole (proto)clusters
Dynamical mass measurements are the gold standard.
Sometimes, we can't measure dynamical masses
Salts in Orion
Orion Source I
a disk around a 15 M⊙ YSO
Salt: NaCl
Temperature?
Temperature?
A contrived model
Observing the Keplerian rotation profile of a disk is the most direct way to measure a protostar's mass
(we can only see the disk, not the star itself)
We can use salts to measure HMYSO masses
- NaCl, KCl are only in the disk, not the outflow (water traces both)
- NaCl is detected in at least two other HMYSOs
(Tanaka+ 2020, Maud+ in prep)
- Salts are observable with ALMA, the JVLA, and the future ngVLA
- Future projects will involve observing and modeling salt disks to measure HMYSO masses
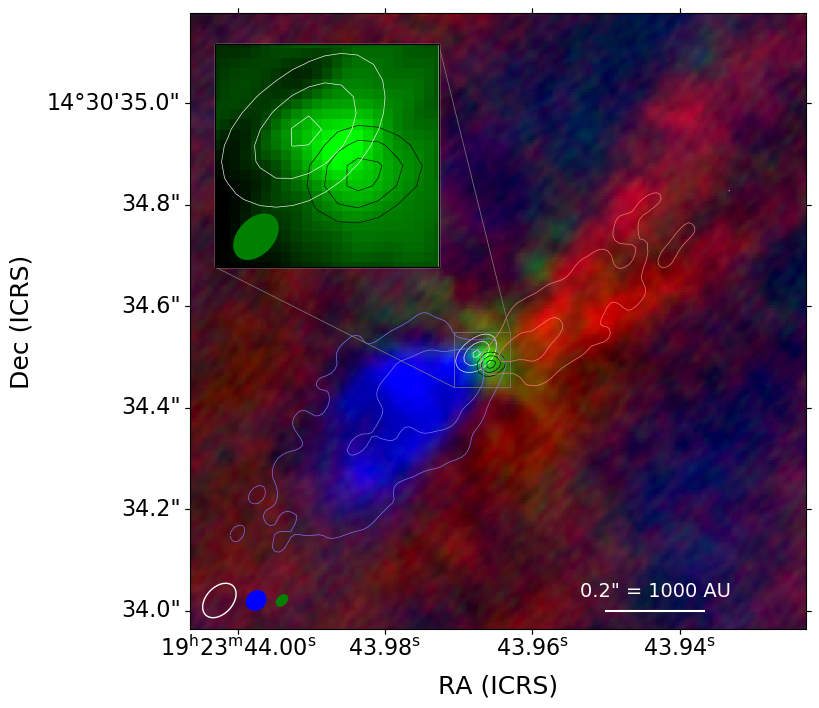
W51 e2e: Too optically thick at 1mm to measure disk
CS v=0 J=1-0 and v=0 J=2-1 masers may trace the disk?
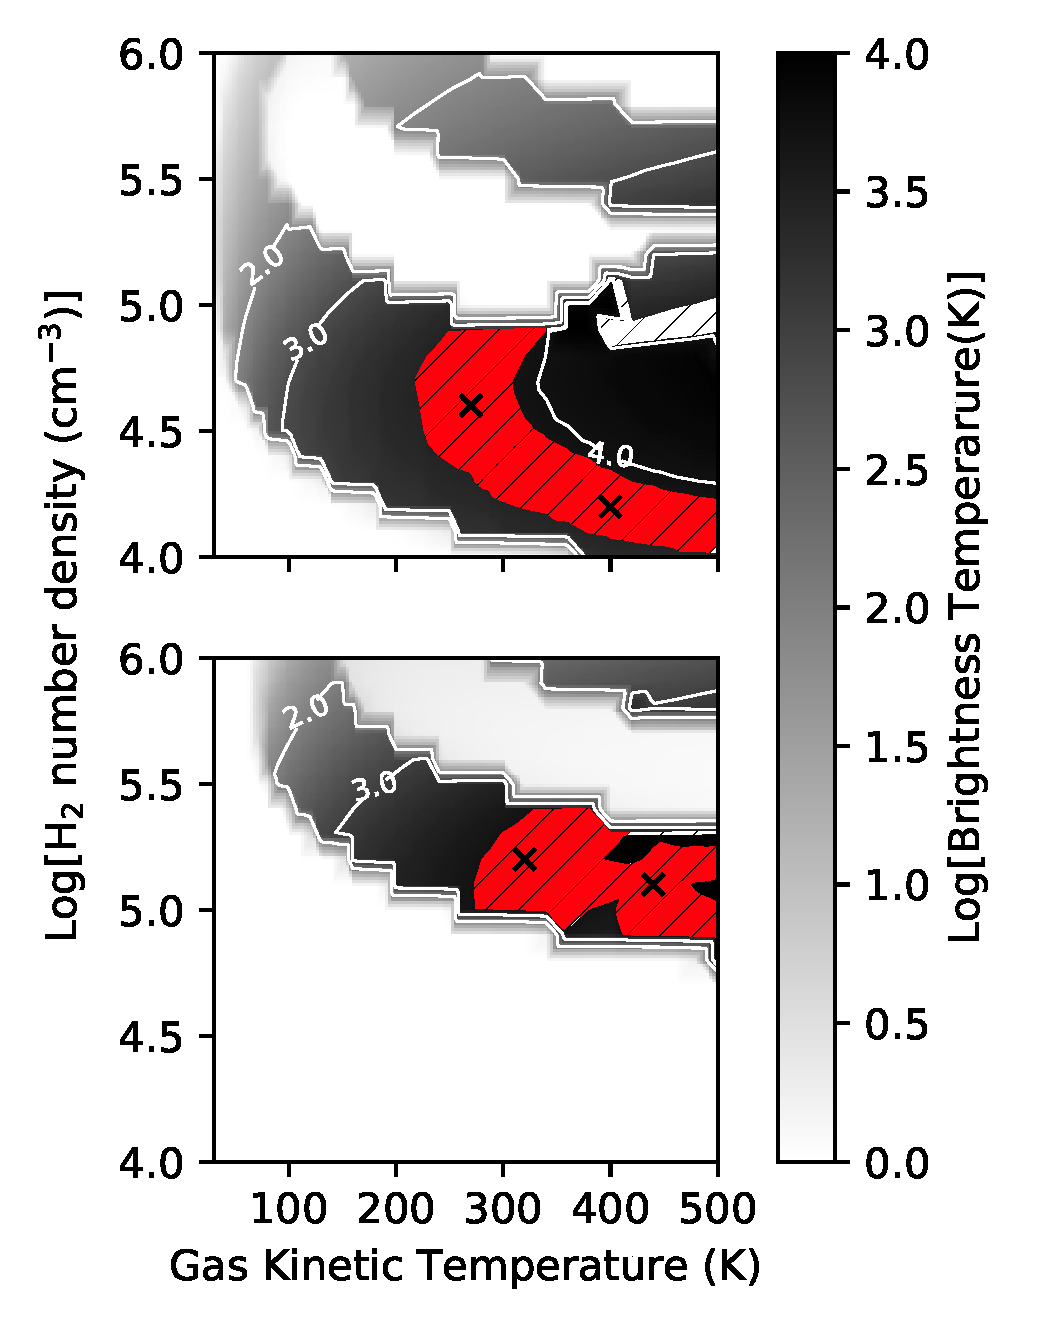
CS maser conditions
van der Walt+ 2020- Top: CS J=1-0, Bottom: CS J=2-1
- Red: Consistent w/W51e2e observations
- Masers do not coexist; require different specific CS column
(N2-1=1015.6, N1-01016.1 cm-2) - Require high abundance (XCS > 10-5)
- Hot (300-500 K), moderate-density (n~105 cm-3): Disk surface? Or outflow cavity wall?
Looking forward:
- PASHION: Paschen Alpha Survey of Hydrogen Ions
- JWST: Deep Paα, Brα, and broadband imaging


PASHION: Paschen Alpha survey of the Galaxy
Team:
- John Bally (CU)
- Elizabeth Lada, Steve Eikenberry (UF)
- Students: Alyssa Bulatek, Michael Fero, Nazar Budaiev
- Lockheed Martin (Alison Nordt, Gopal Vasudevan)
- Tony Hull (UNM)
- York Space Systems
PASHION: H2RG with Lockheed electronics, three narrow-band filters, 2.5" resolution, 25' FOV
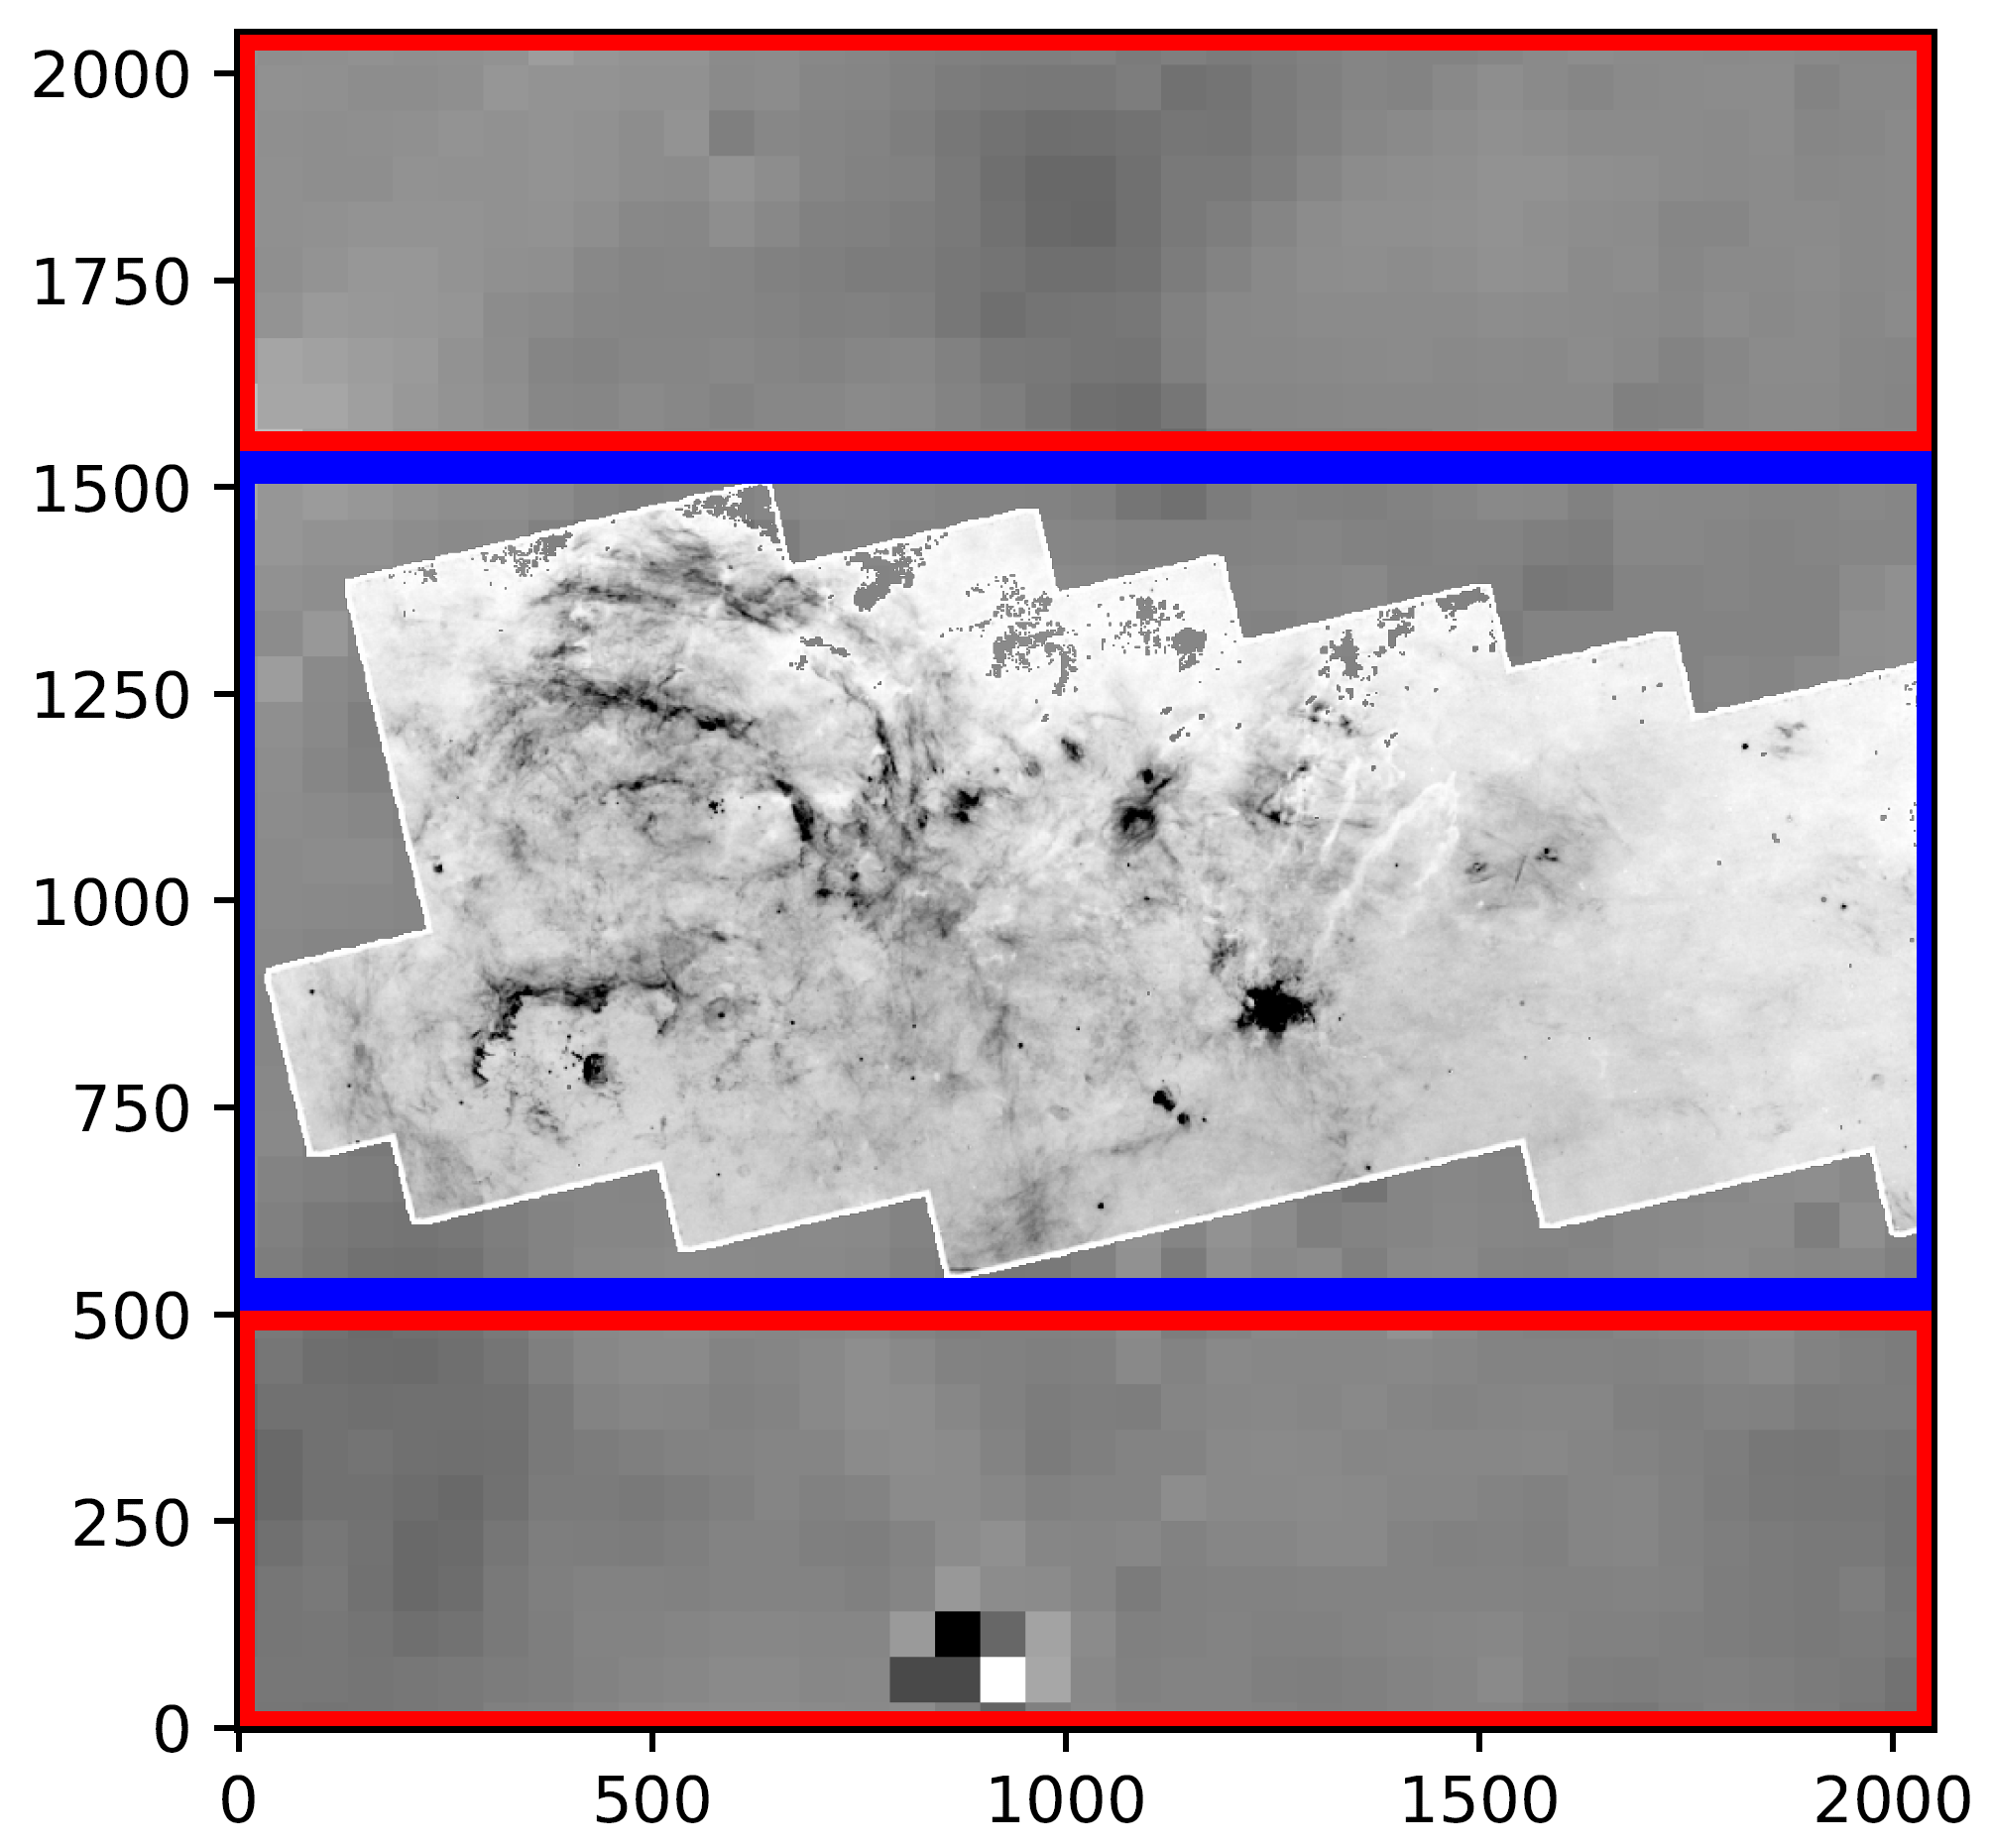
A 24 cm dedicated survey telescope will be the most sensitive Galactic plane survey of ionized gas
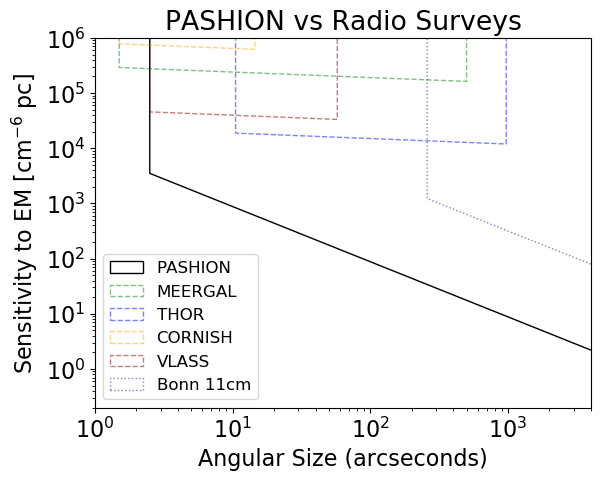
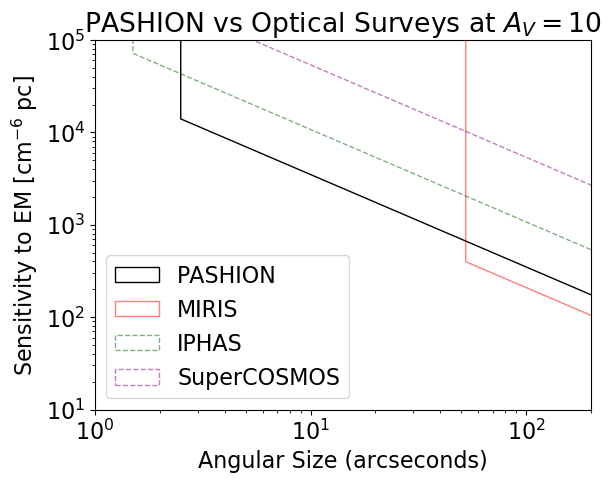
These are fiducial numbers for a 1-year mission performing a 100 square degree blind survey. An extended mission may be possible.
PASHION, and JWST, recombination line science
Accretion onto YSOs
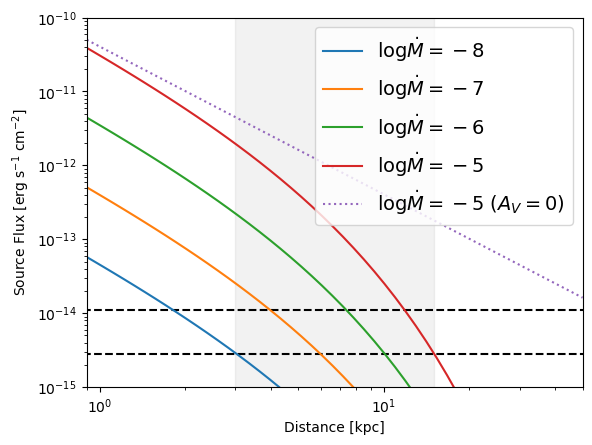

HII regions
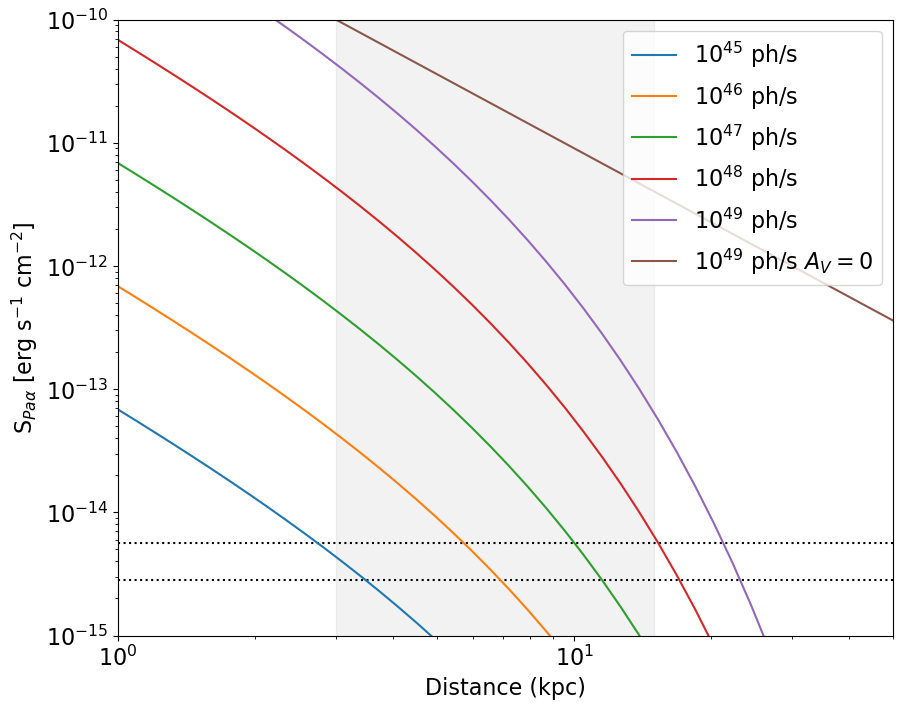

Assuming typical AV~2 per kpc
Summary
Most stars form in regions unlike the solar neighborhood
- Greater clustering, higher SF thresholds in denser clouds
- ALMA-IMF will expand the sample to match or exceed local clouds
We have, and are building more, tools to measure MYSO masses
- Salt is a new tool to probe disks around high-mass stars
- CS masers may track YSO disks; they require rare conditions
- MUSTANG Galactic Plane Survey
- HCHII regions are ~1/3 as abundant as UCHII
- Spectral line survey (B34567) of The Brick [WIP]
- Feedback, YSOs in W51
- Massive (200-300 M⊙), hot (200-600K) cores suppress fragmentation
- Multidirectional accretion flows
- Accretion flows, outflows in Sgr B2
- Turbulence in Sgr B2 [WIP: student Madeline Hall]
- Gas temperatures in W51 [WIP: student Josh Machado]
Possible future uses for these lines?
- Metallicity measurement in deeply embedded star-forming environments? (at least of Na, K, Cl)
- Disk kinematics of high-mass stars, which are otherwise unobservable (τ>1 at mm wavelengths)
- Disk kinematic measurements at early stages?
- Probe dust destruction (and/or formation?) in outflows, disks?
- Probe radiation environment around HMYSOs?
Why do we see salt?
- Previously, NaCl & KCl only in AGB* atmospheres,
associated with dust formation - Most likely dust destruction here
Dust destruction happens immediately as the outflow is launched? - What about excitation? We see vibrationally excited lines, which are not seen in AGB*s
We do not have a viable model to explain these temperatures
A strong non-blackbody radiation field from 25-40 µm may explain them.
Forsterite (MgSiO4) has some emission bands in that range. Maybe?
How is star formation in high-mass clusters different?
- Feedback from one star affects many in clustered regions
- IMF depends on density, feedback, global conditions (e.g., Jones & Bate 2018, Narayanan & Dave 2012)
- Total star formation efficiency is higher.
- Collisions assemble the most massive stars?
(e.g., Fujii+ & PZ 2013, but see Moeckel & Clarke 2011)
Cartoon of high- and low-mass star formation
Main difference: massive stars affect their surroundings
Classic HII region feedback:
O-stars clear out their environment
Accreting massive young stars affect their environment
Accreting massive young stars affect their environment
Accreting massive young stars affect their environment
The characteristic fragmentation scale
The Jeans Mass MJ is the mass where gravity and thermal pressure are balanced.
MJ ∝ T3/2 ρ−1/2
The characteristic fragmentation scale is larger
Jeans Mass
MJ ∝ T3/2 ρ−1/2

Feedback affects dense gas
ALMA + VLA + GBT together give multiple temperature probes on multiple scales.
High-mass protoclusters are filled with gas warmed by feedback.
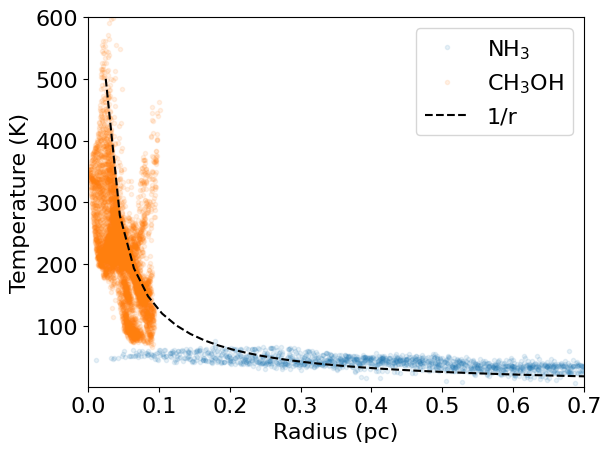
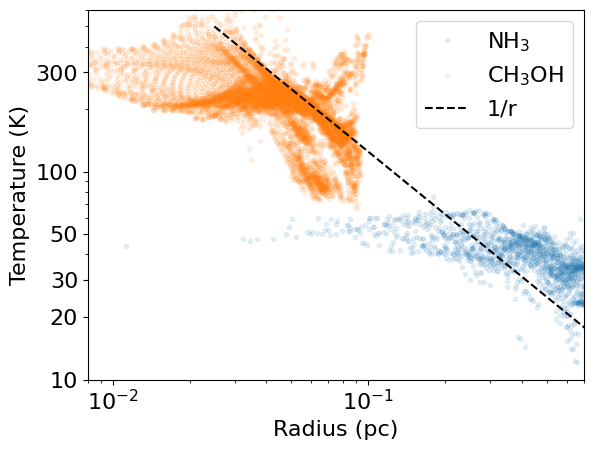
Ginsburg+ 2017, Machado+ in prep

YSO disk counts in W51
The cartoon in the context of HMSF
These high mass cores suppress low-mass star formation (LMSF) in their vicinity.
They reduce or prevent LMSF in the cores of stellar clusters.
More extreme: 'cooperative accretion'
With enough high-mass stars forming concurrently, massive stars may prevent fragmentation entirely.
If they still have enough gravity to bind the gas, the remaining gas is forced onto the most massive gravitational sinks.
If they still have enough gravity to bind the gas, the remaining gas is forced onto the most massive gravitational sinks.

Ammonia Masers
Large scales again:
What governs the star formation rate?
Turbulent ISM models
Turbulent ISM models
Turbulent ISM models
