- To move slides, use the arrow keys or swipe on your mobile device
- To see the speaker notes, press "s"
- To go to full screen, press "f"
- To print as PDF, go to this URL: ?print-pdf, then print.
- To get a PDF with speaker notes, add ?print-pdf&showNotes=true to the URL.
ALMA-IMF vs Galactic Center 2026
- Postdocs: Nazar Budaiev [PhD 2026], Theo Richardson [PhD 2025], Miriam Garcia Santa Maria (2024-2025), Allison Towner (2020-2023)


- PhD: Desmond Jeff [PhD 2025], Alyssa Bulatek [PhD 2026], Savannah Gramze, Taehwa Yoo
- Postbac: Aden Dawson
- Undergrad: Antonio Daley, Ethan Bhula, Ani Vijarayaman, Avery Lacon, Laya Damaraju, Prashant Sikhdar, Giovanna Guida
- Supported by NSF 2008101, 2206511, CAREER 2142300, STSCI 1905, 2221, 3523, 5365, 6151, Astropy
Slides available at
https://keflavich.github.io/talks/almaimf_garching2026.html
or from my webpage →talks
or from my webpage →talks
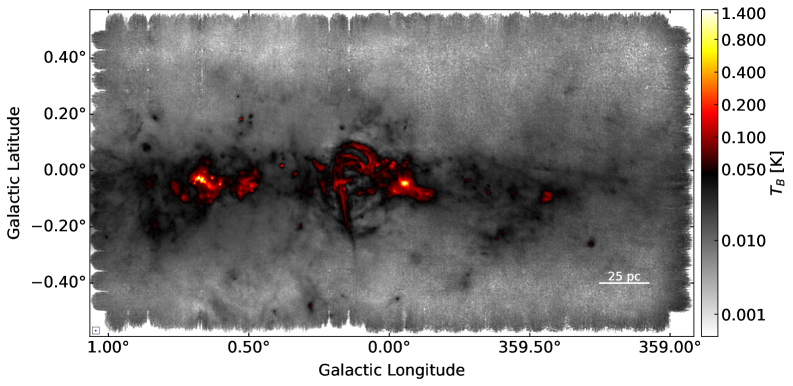
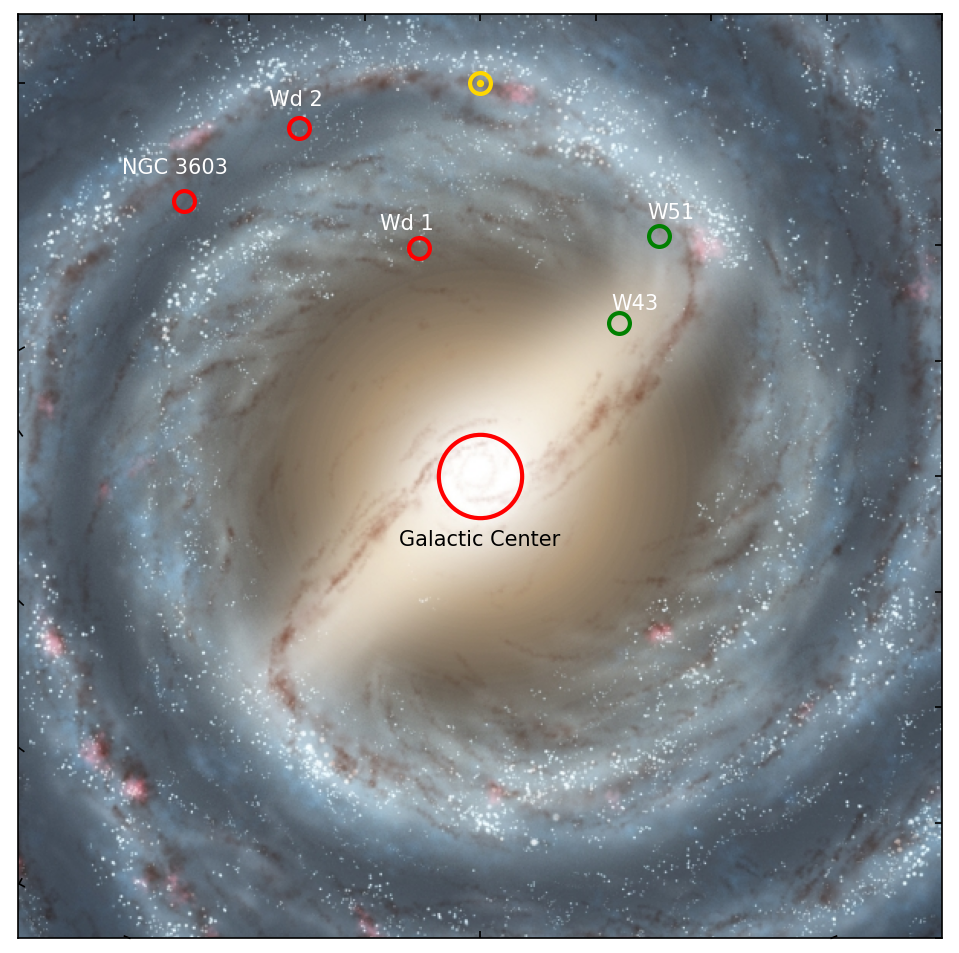
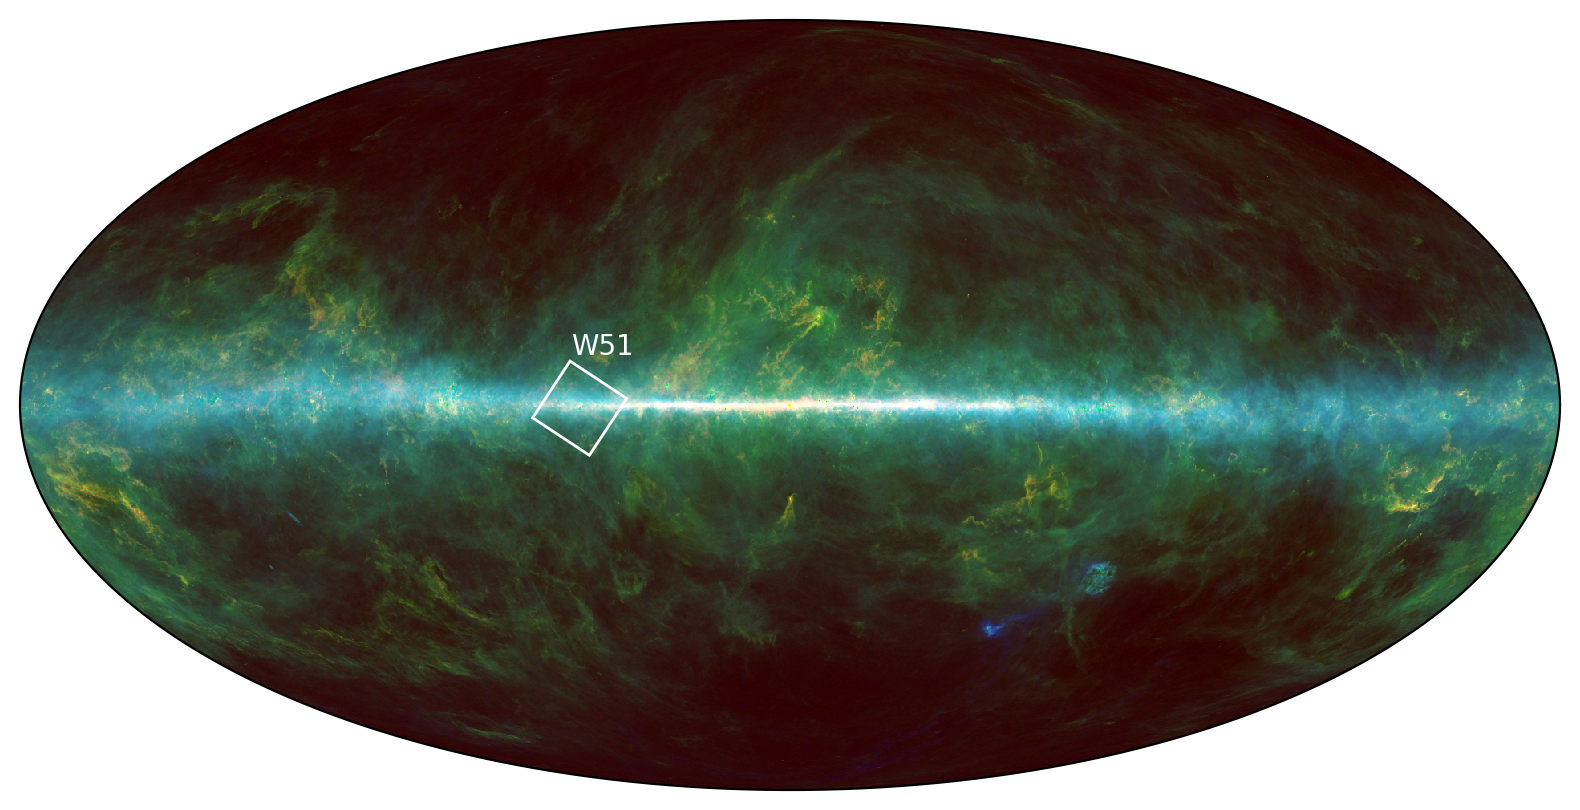
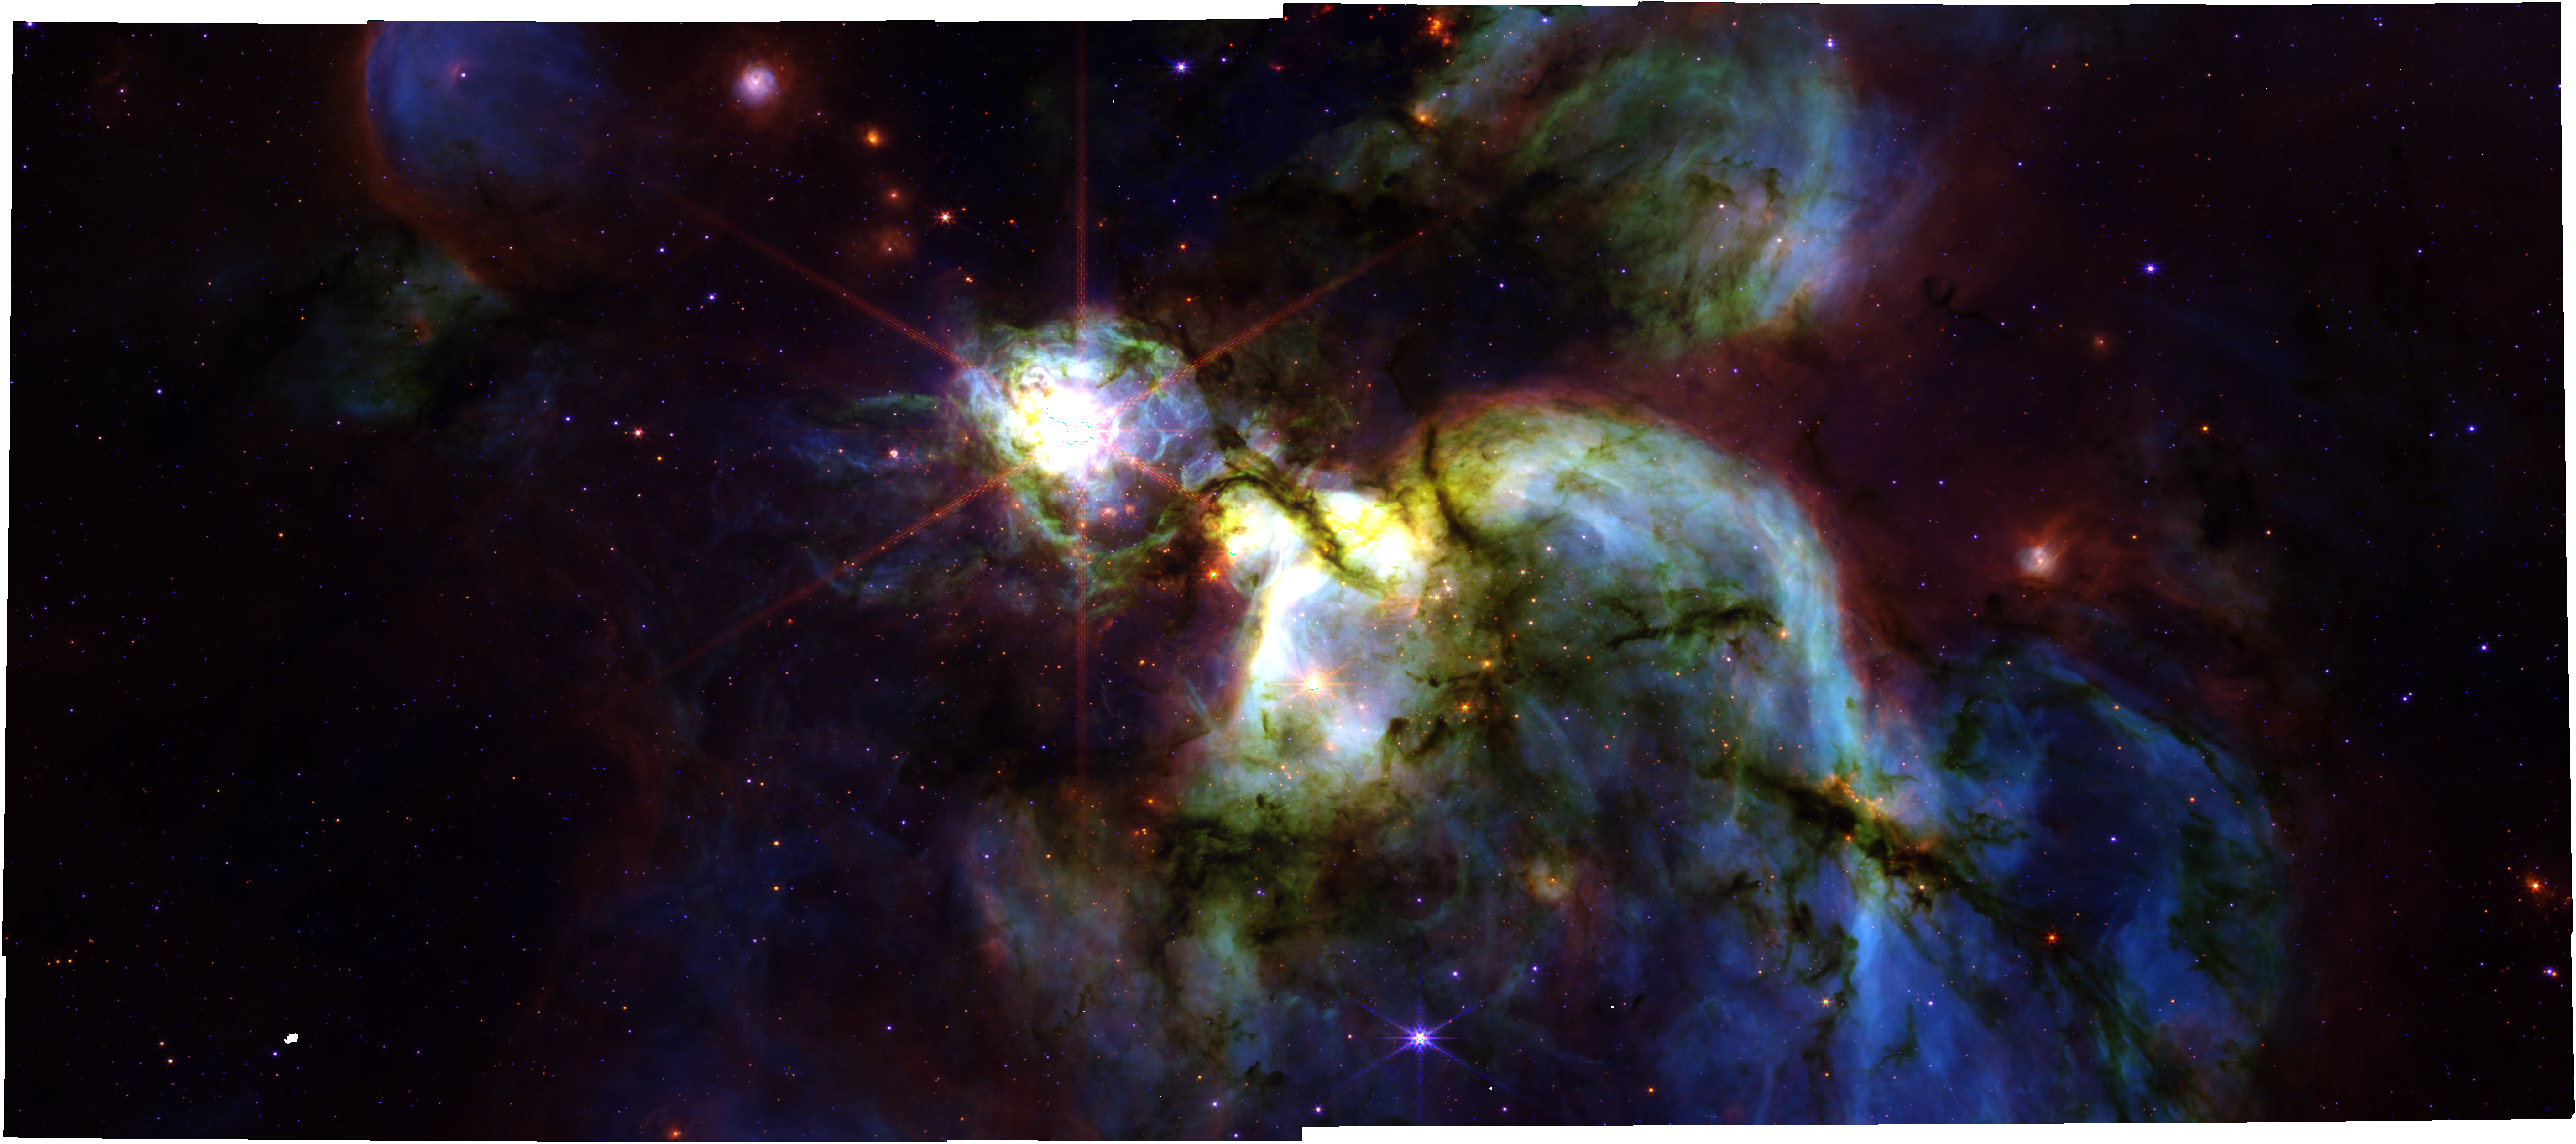
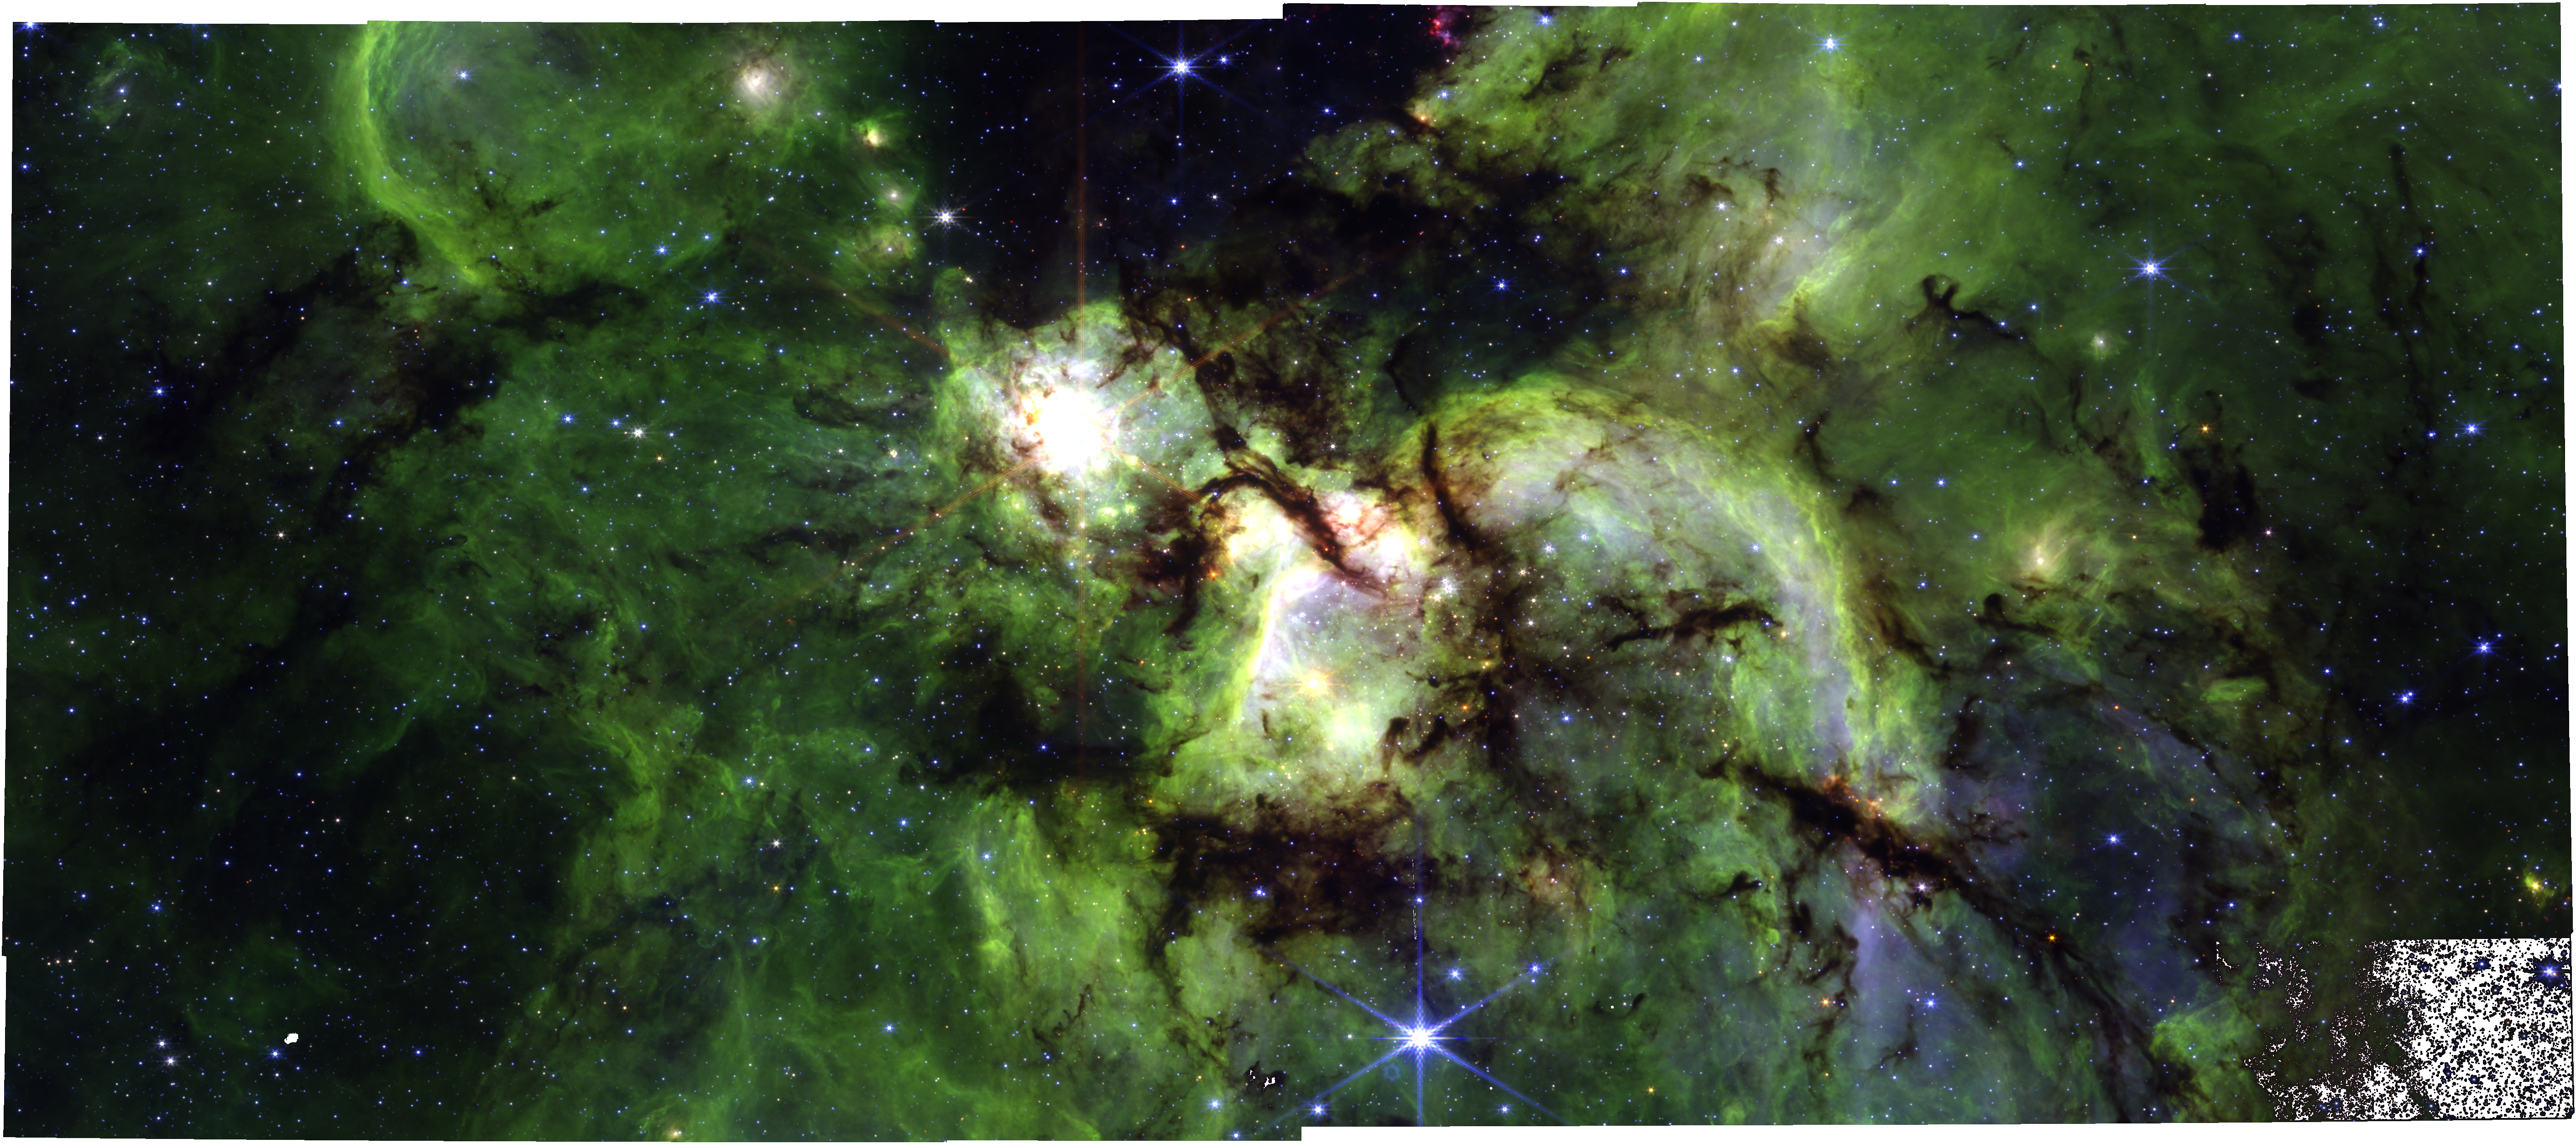
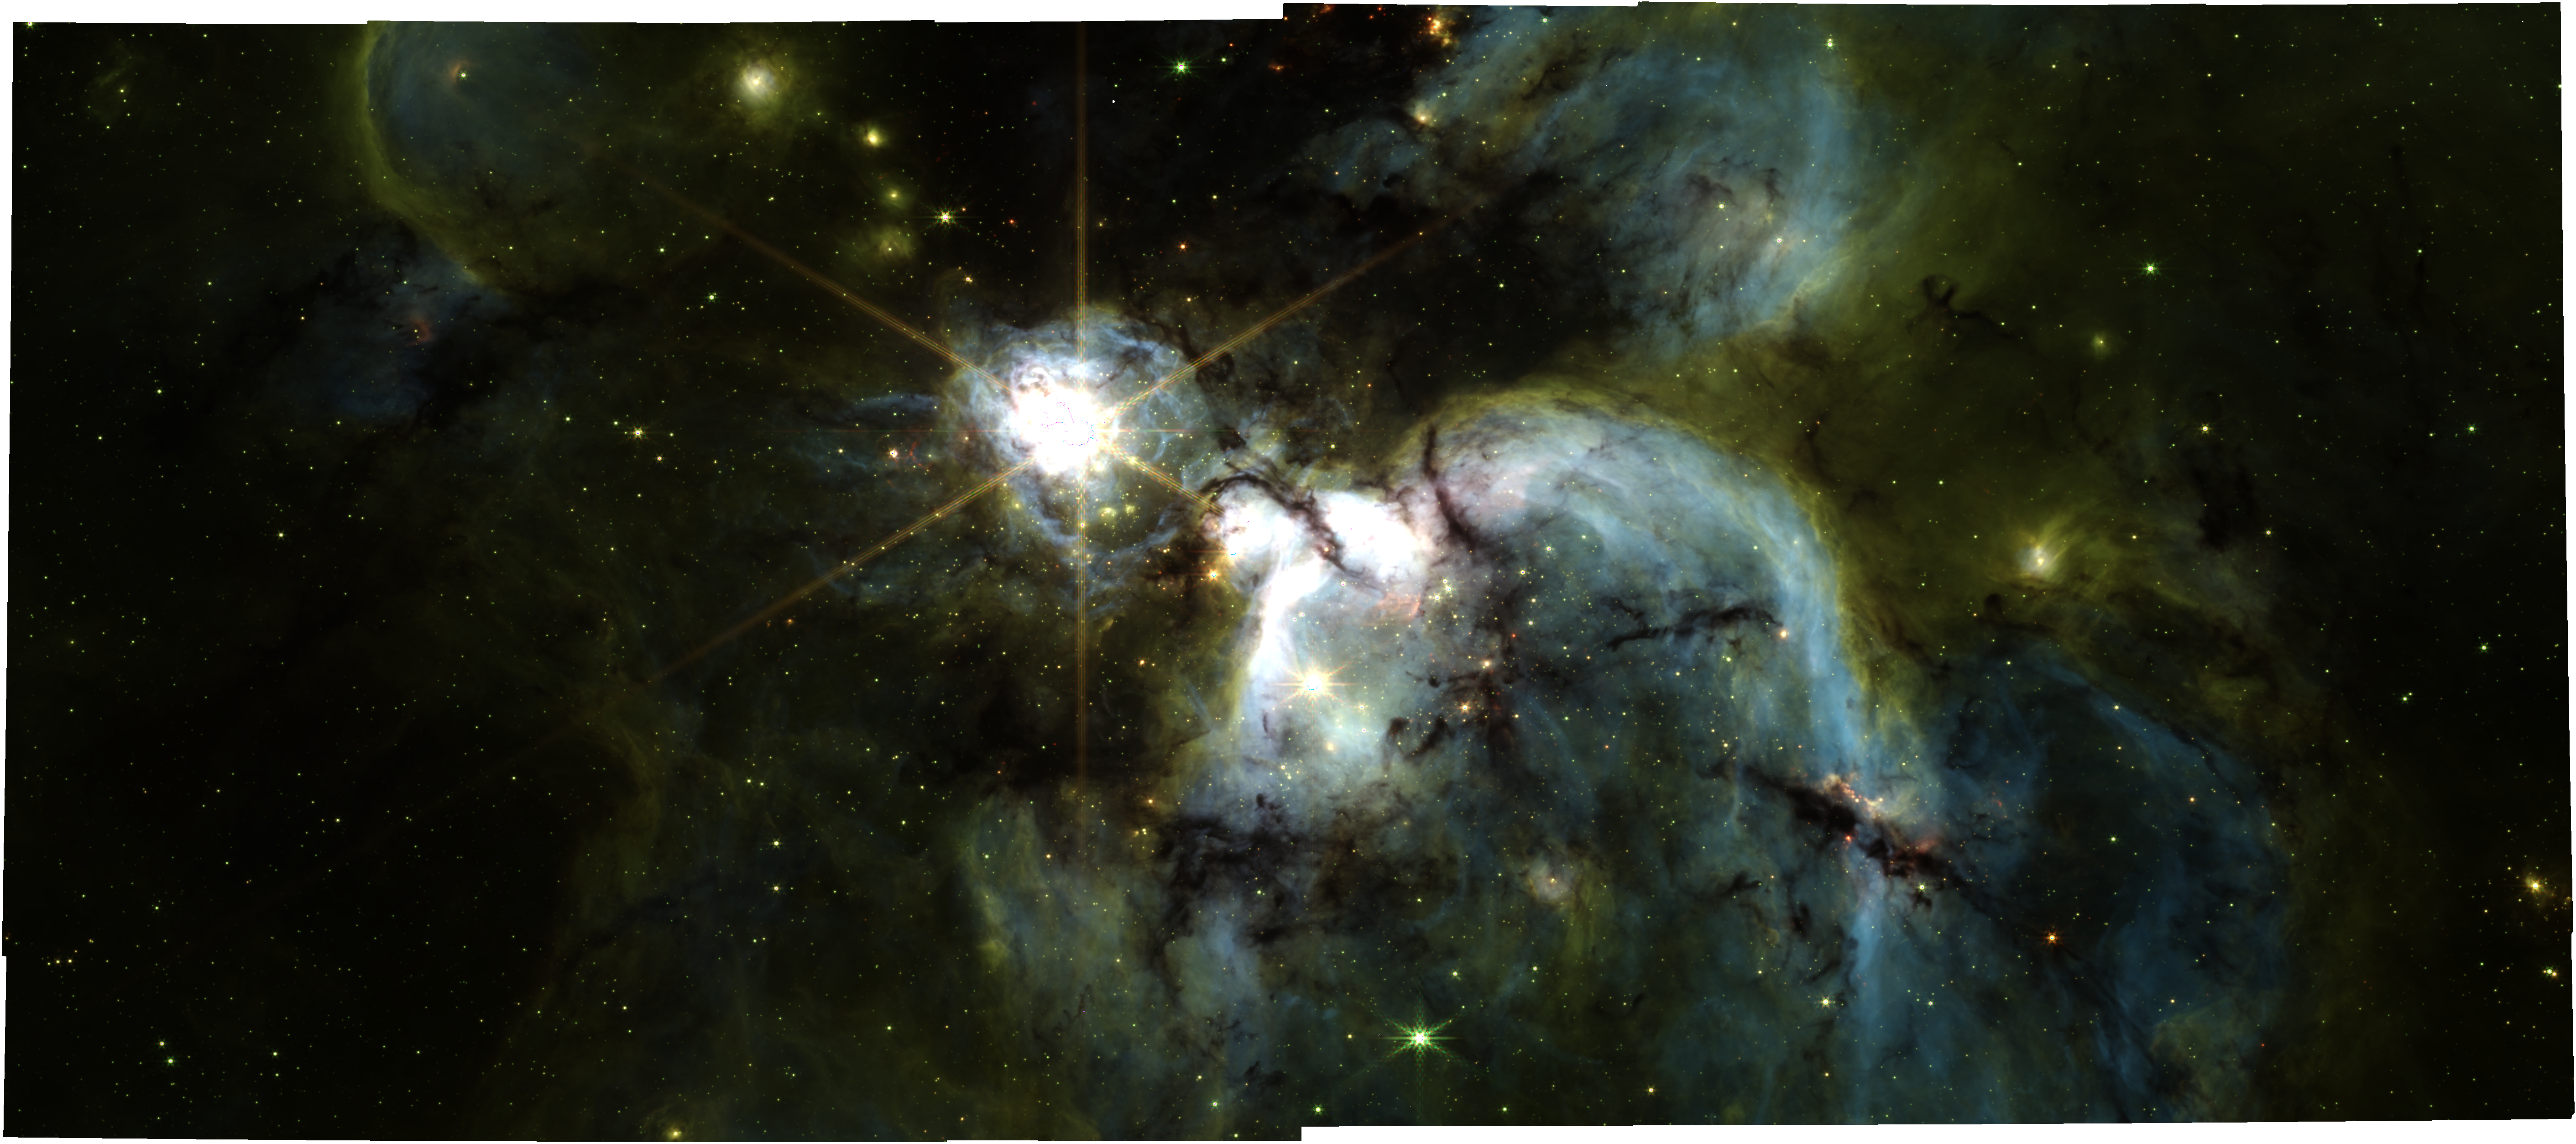
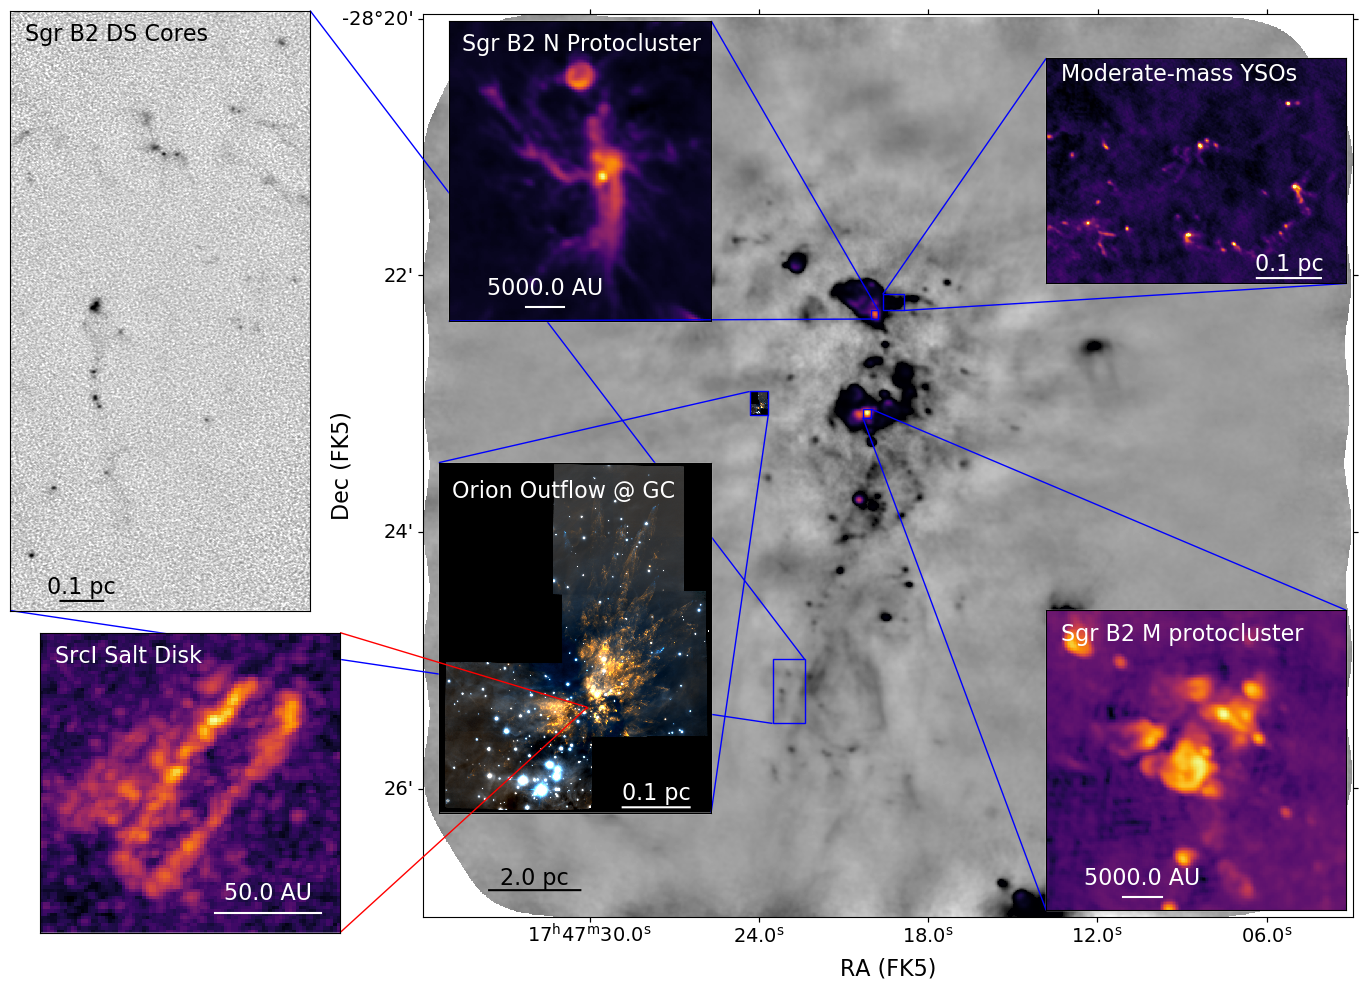
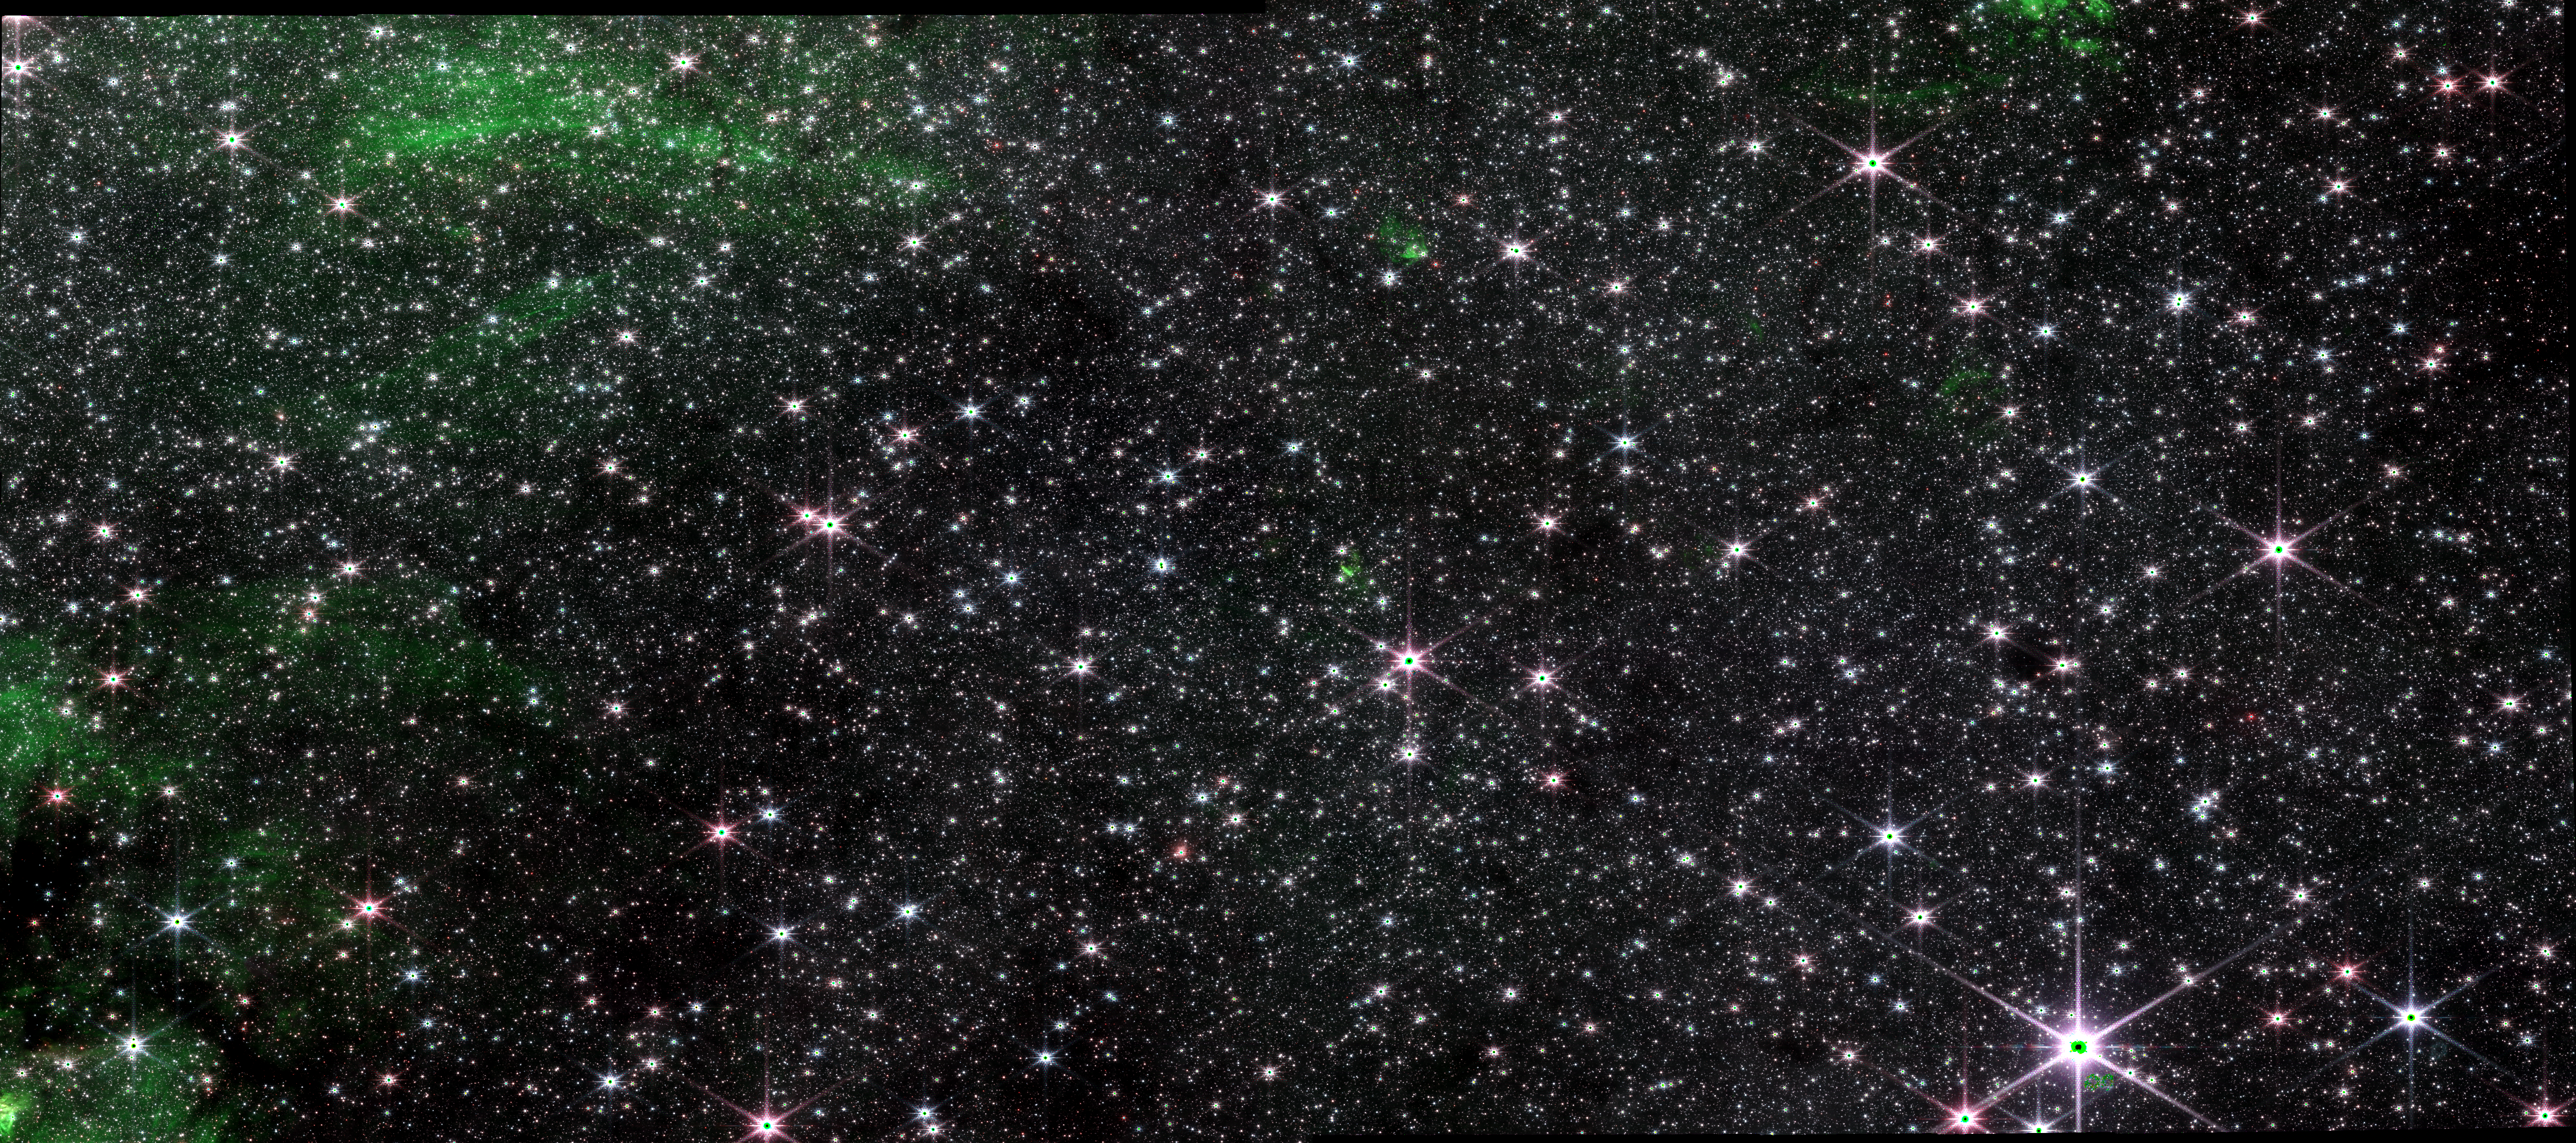
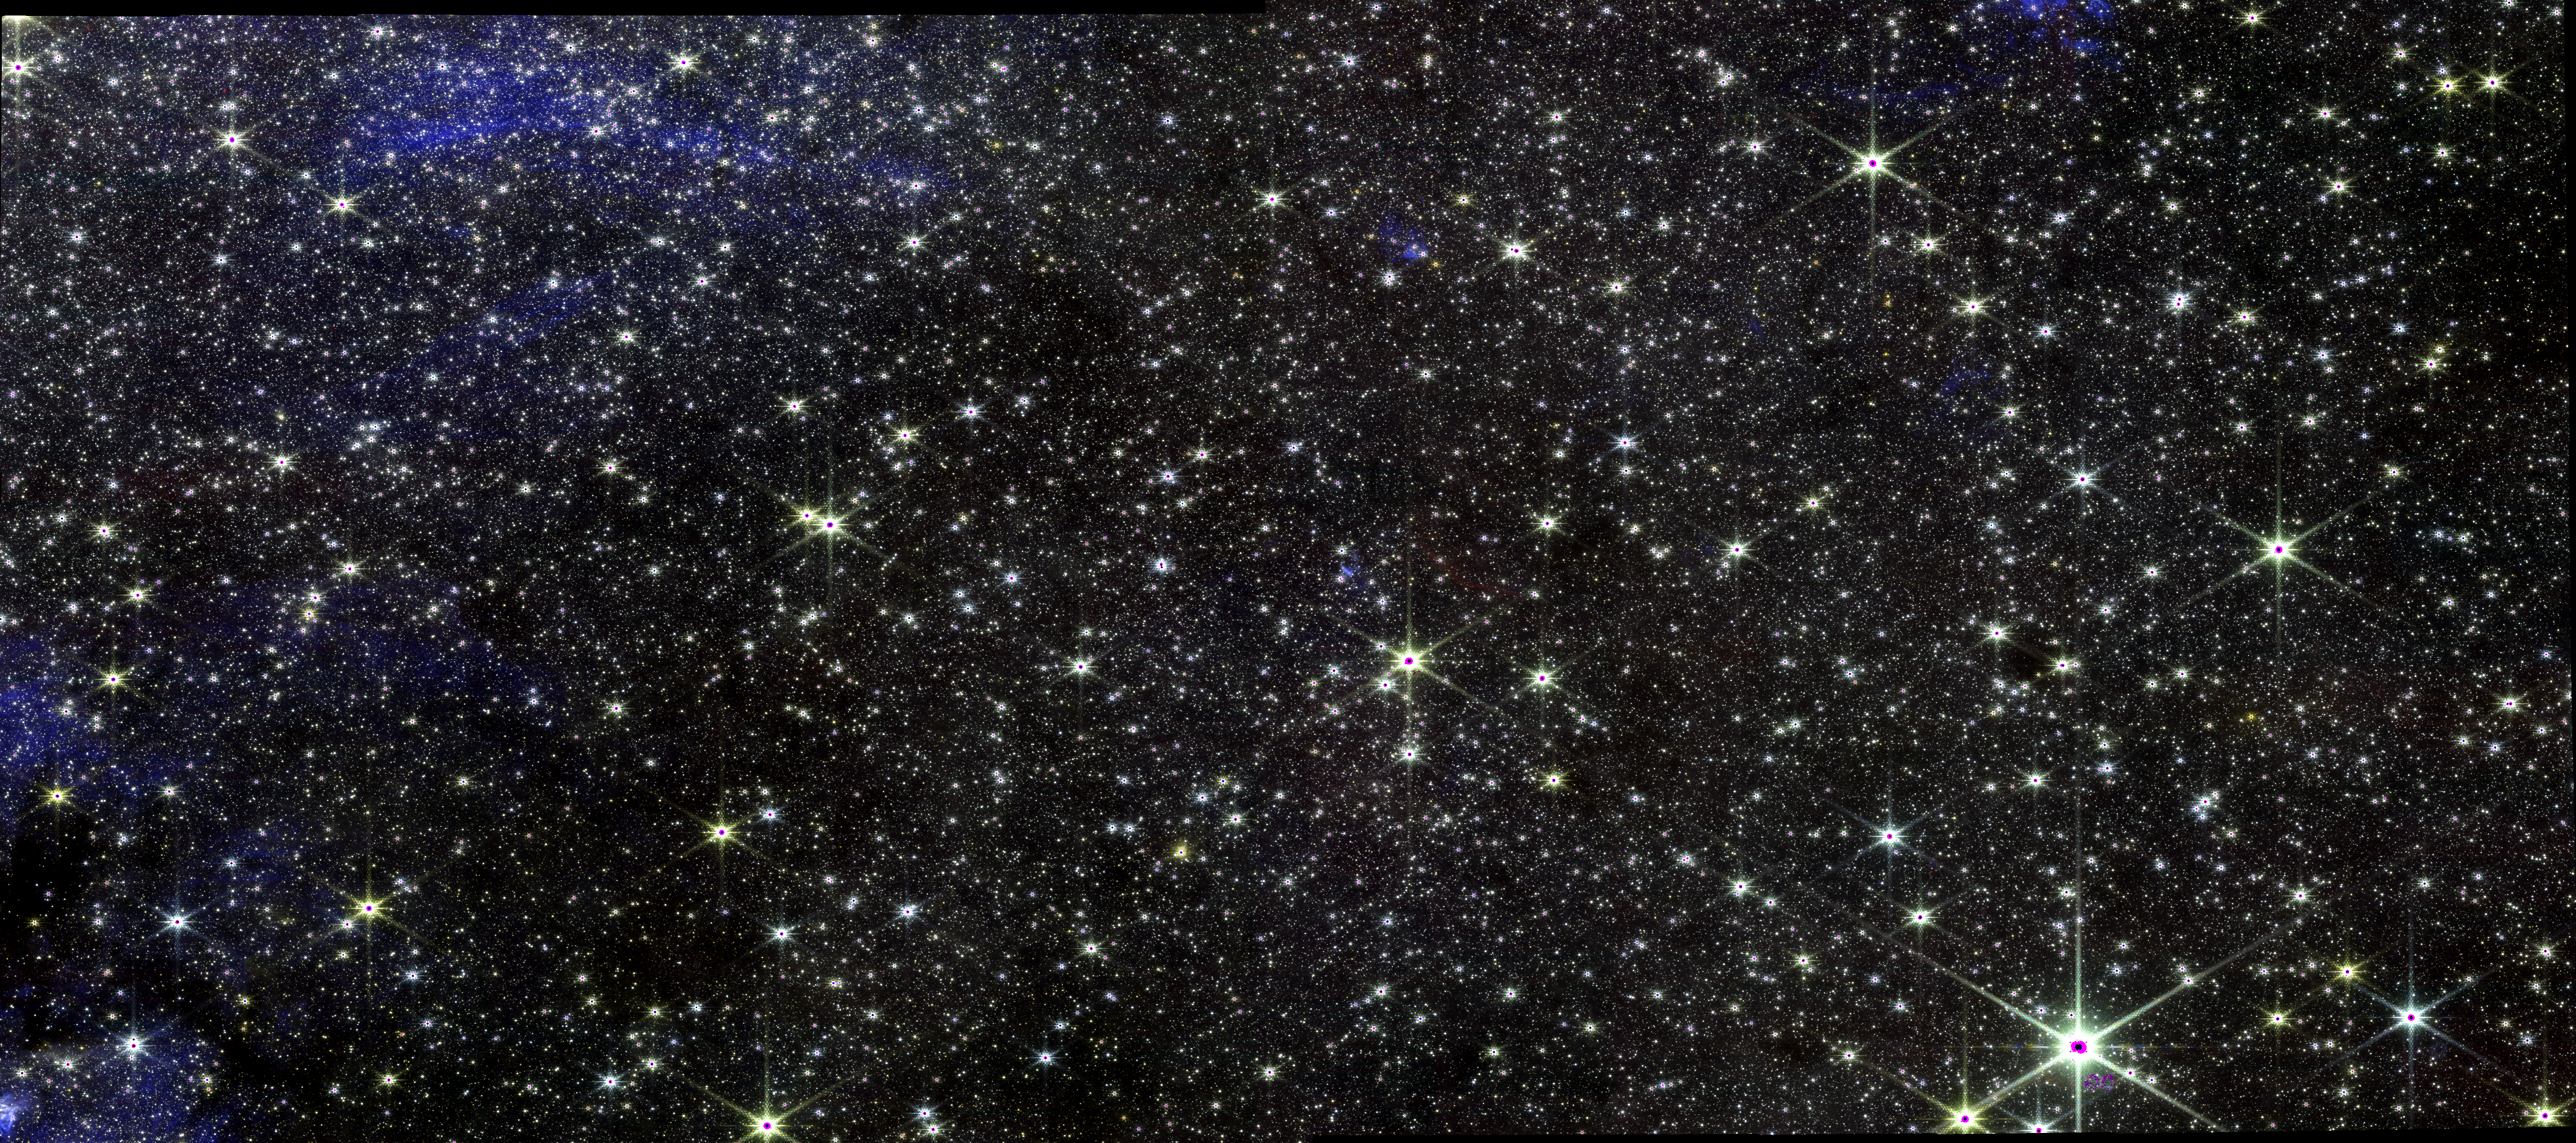
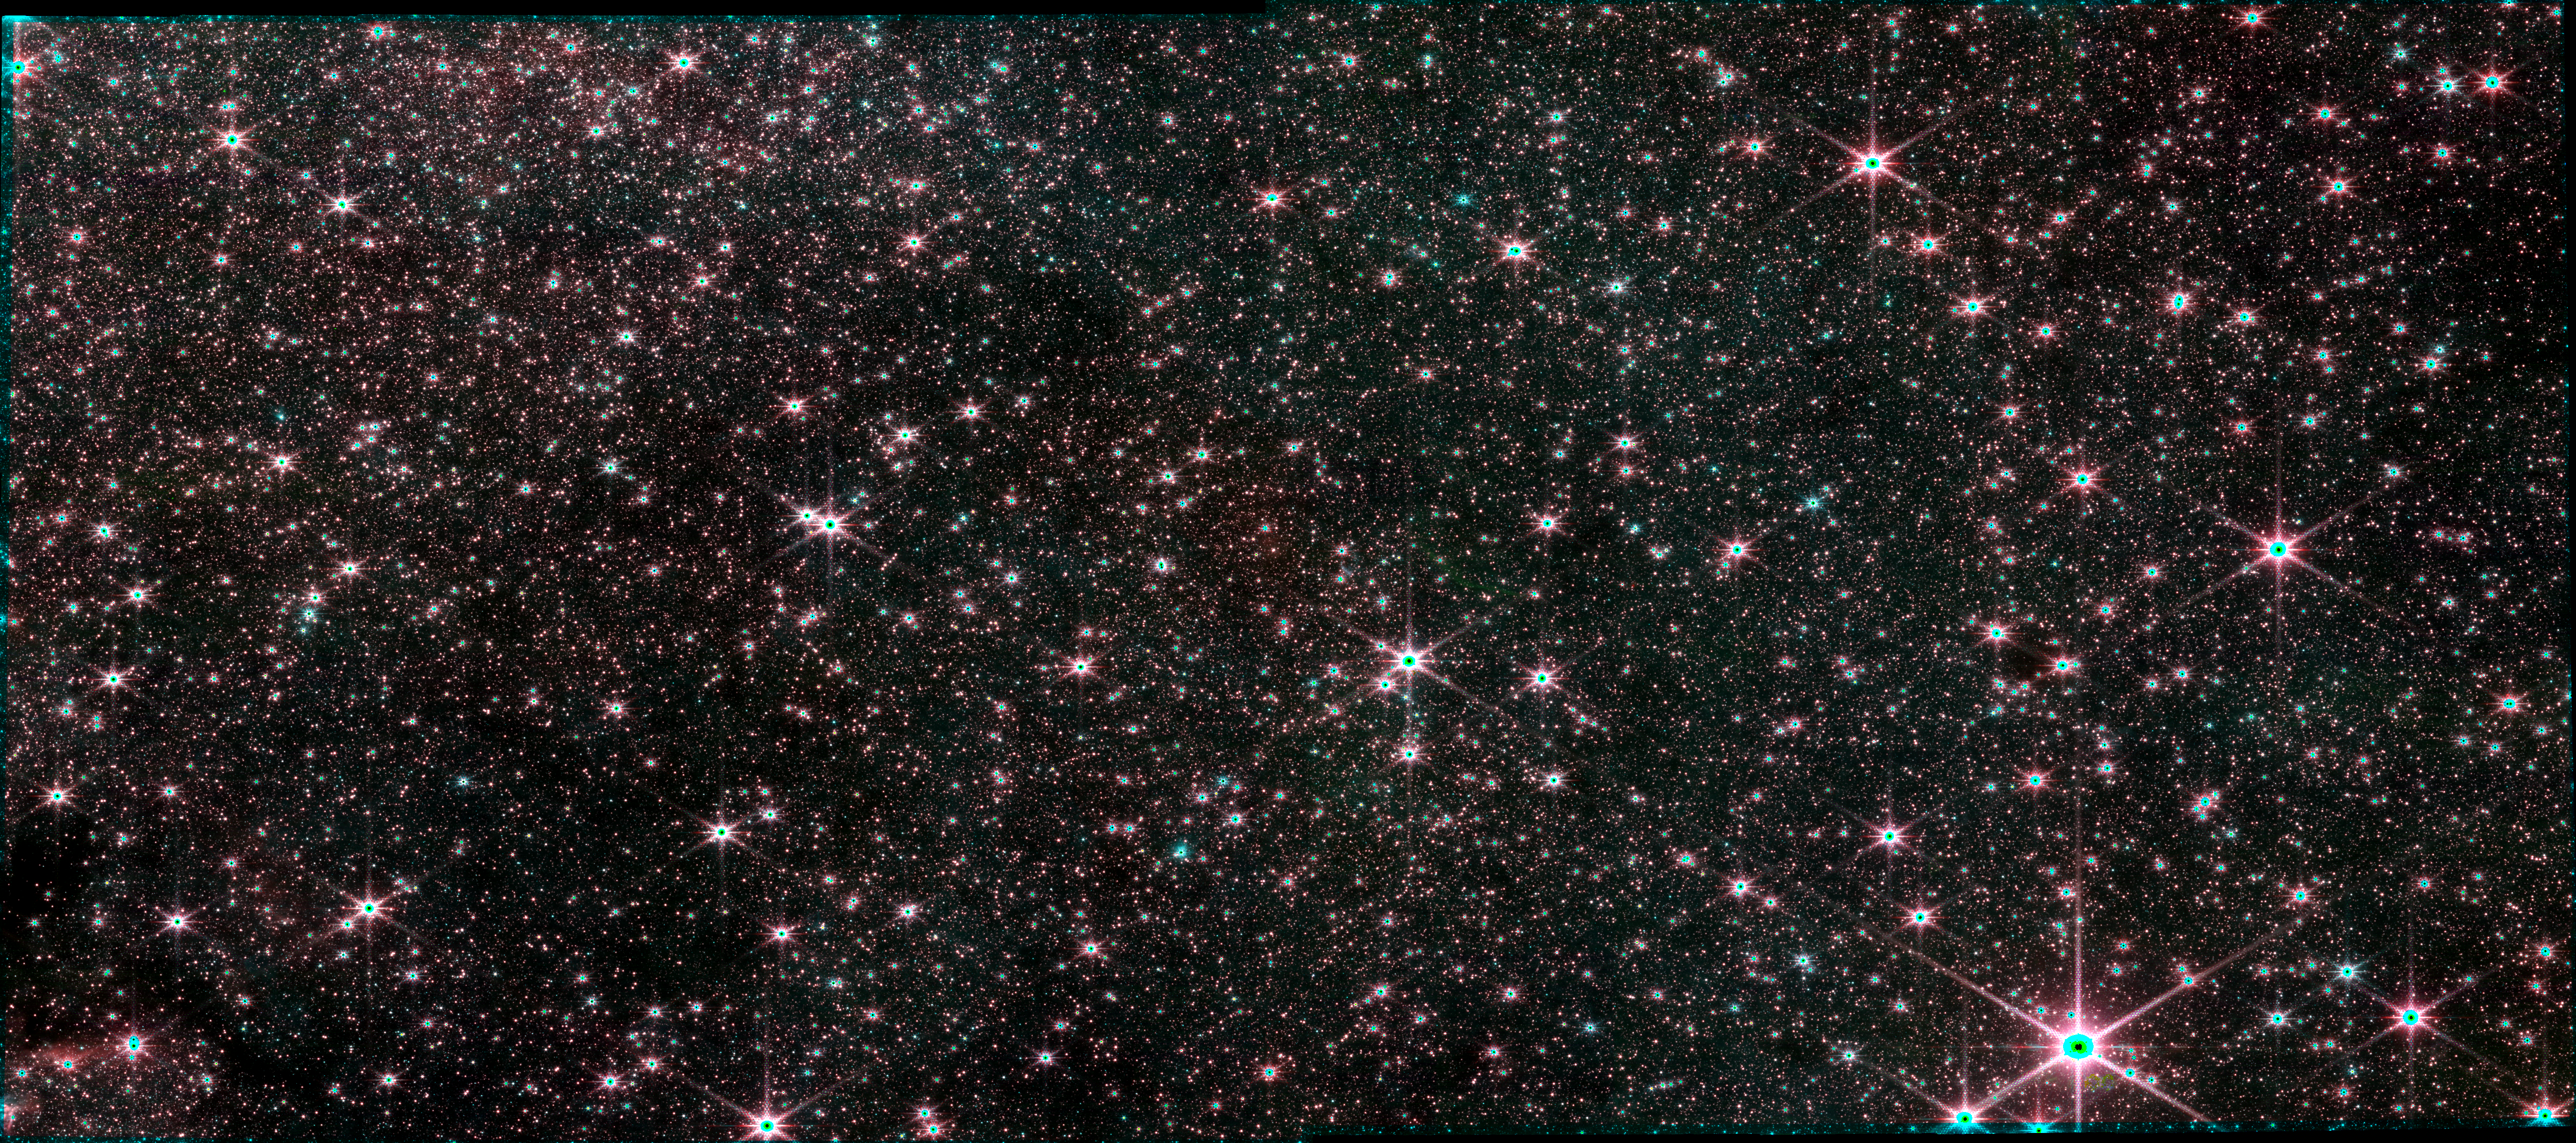
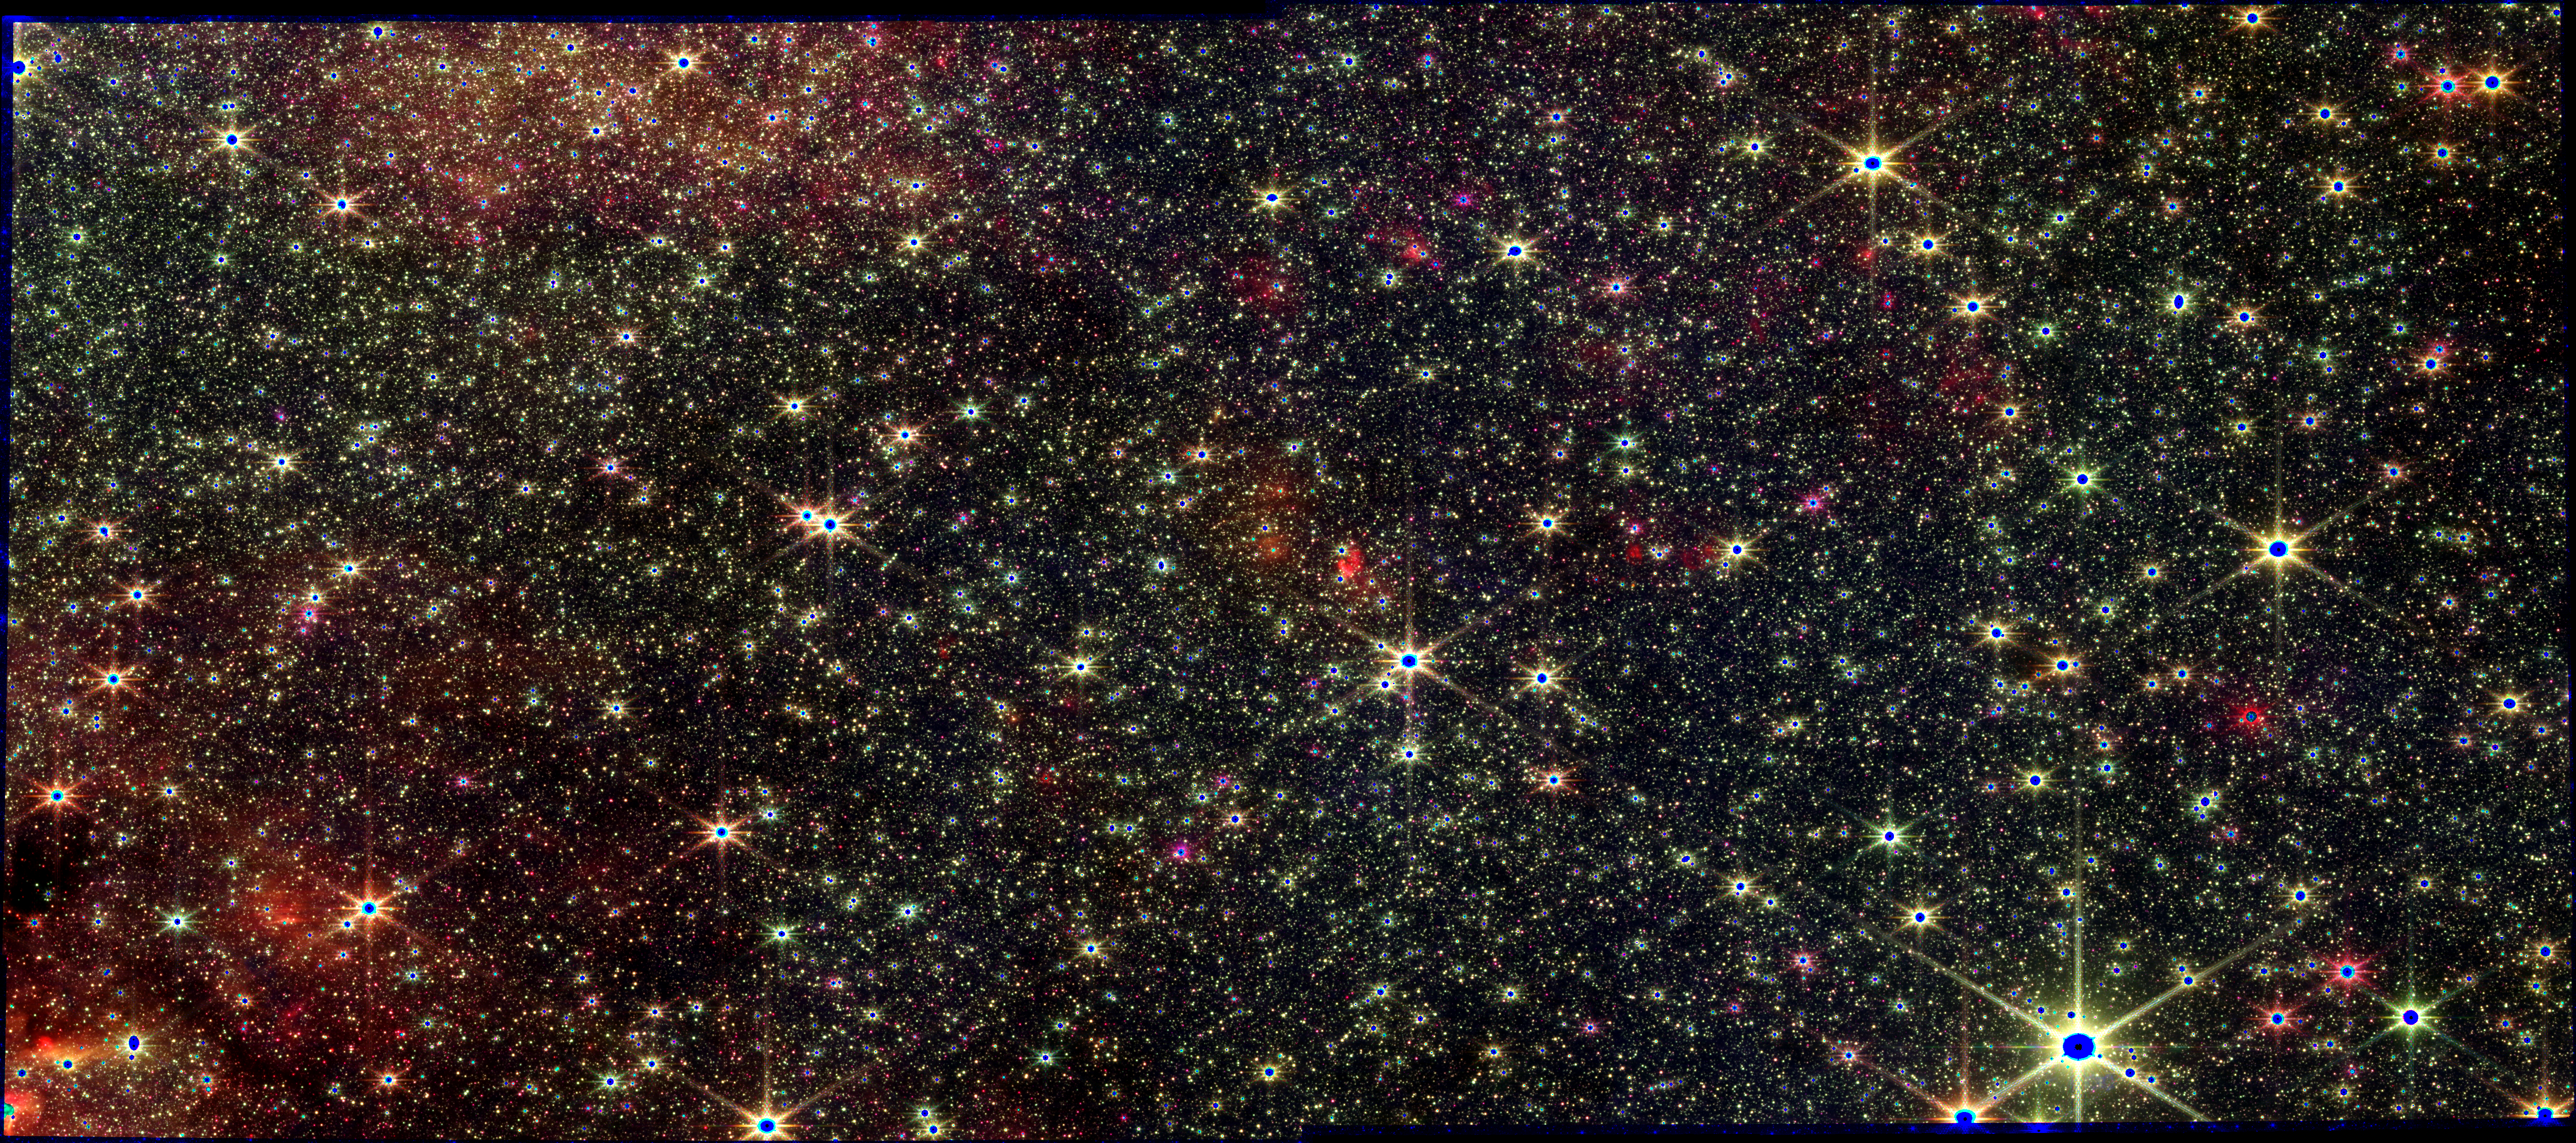
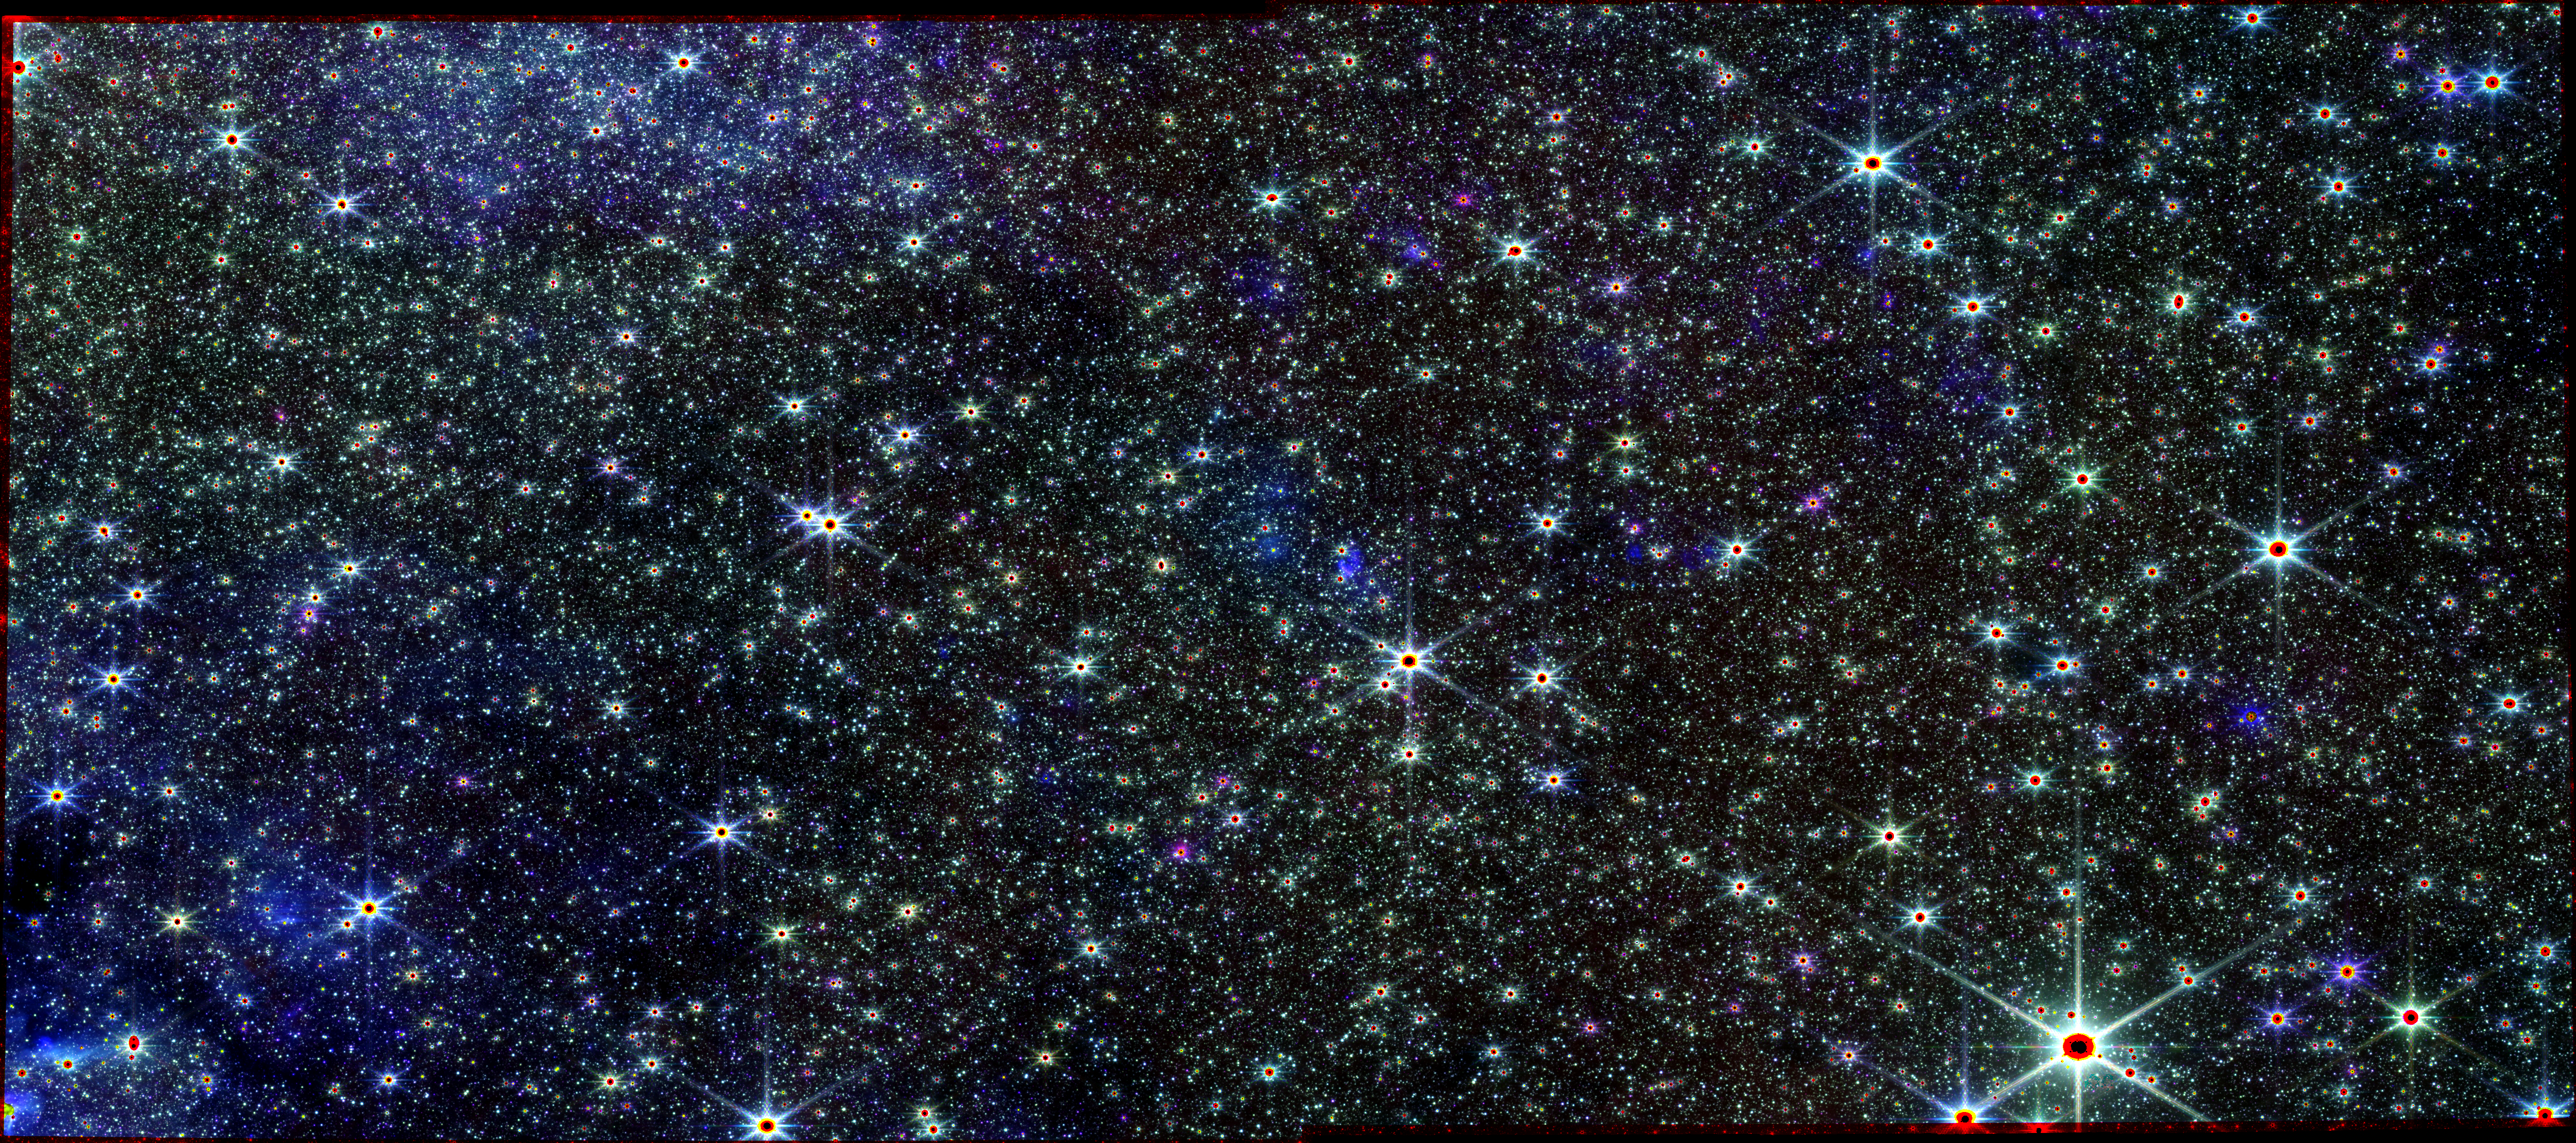
The Central Molecular Zone (CMZ) is one extreme of star-forming conditions in the Galaxy
The CMZ
$\sim10^8$ M$_\odot$ of gas in $\sim200$ pc, 10% of Galactic star formation
$>\frac{1}{3}$ of CMZ SF is in bound clusters (3-8$\times$ local)
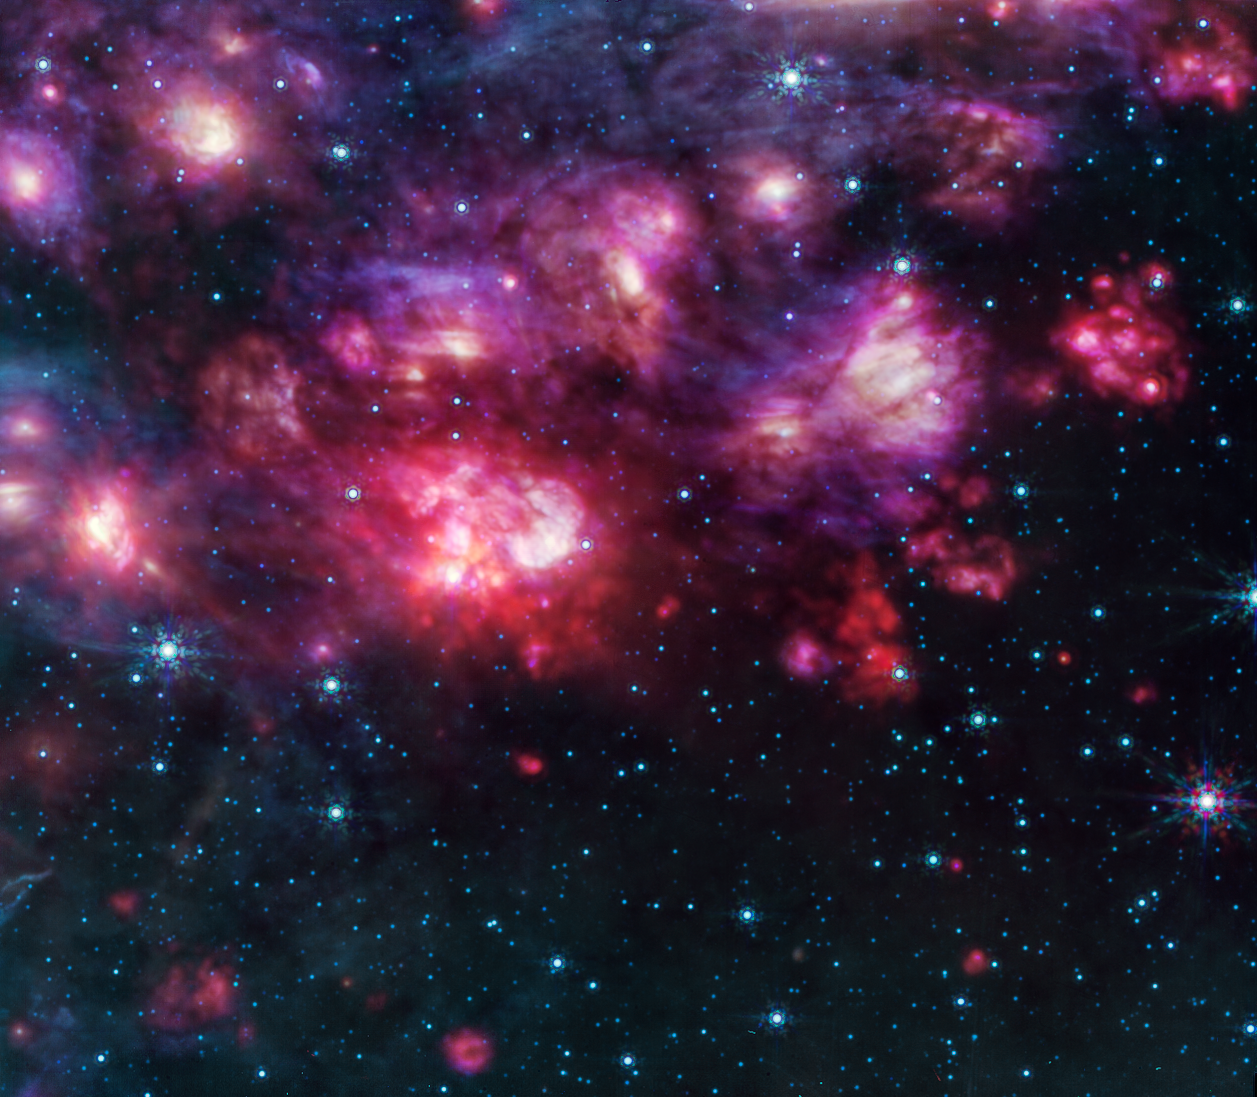
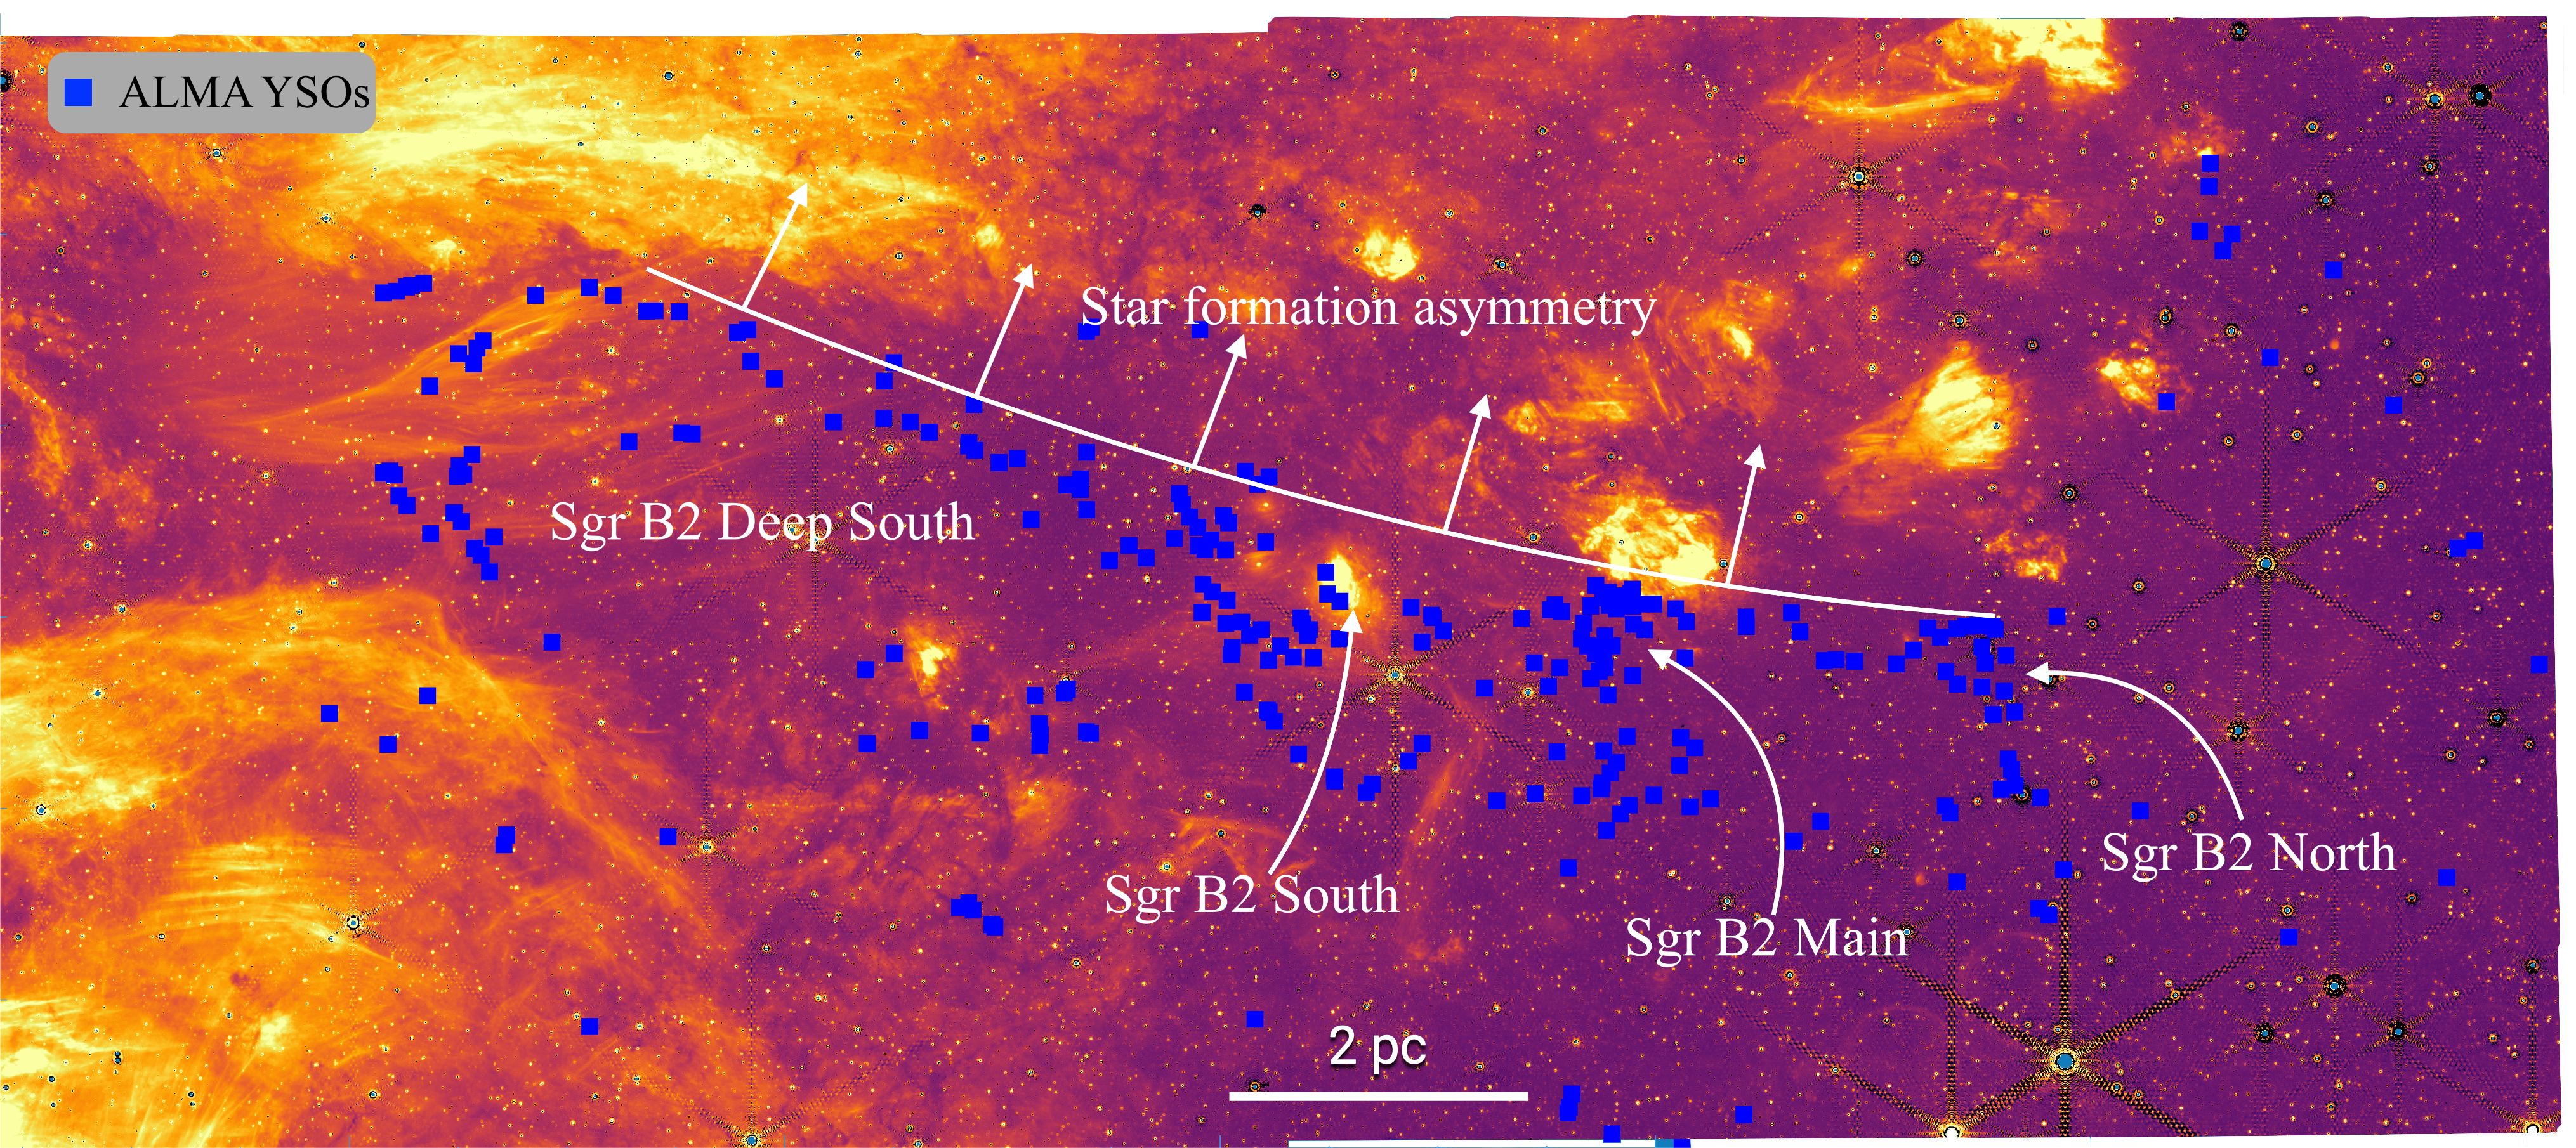
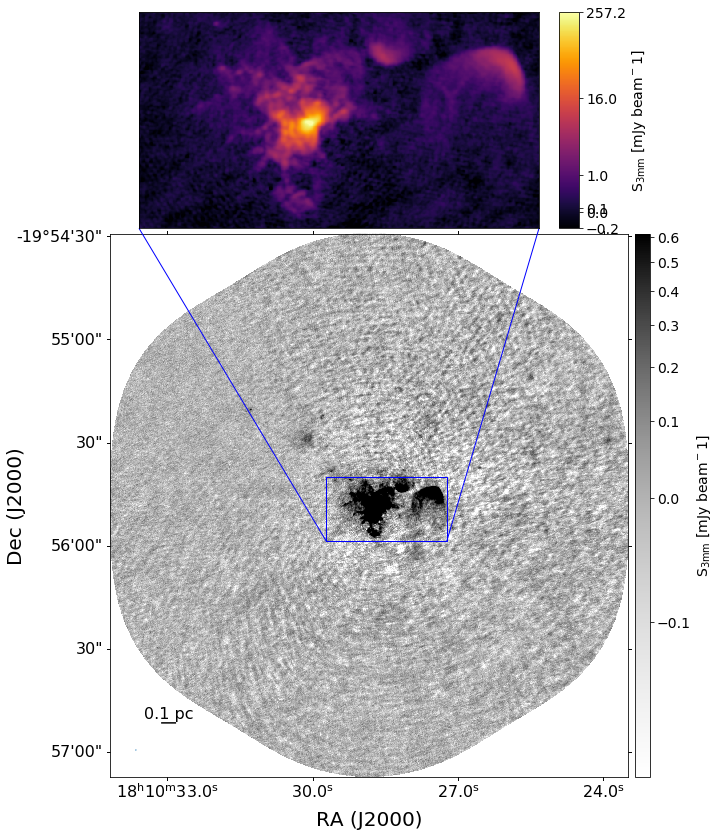
$\sim$50% of CMZ SF occurs in the Sgr B2 cloud.
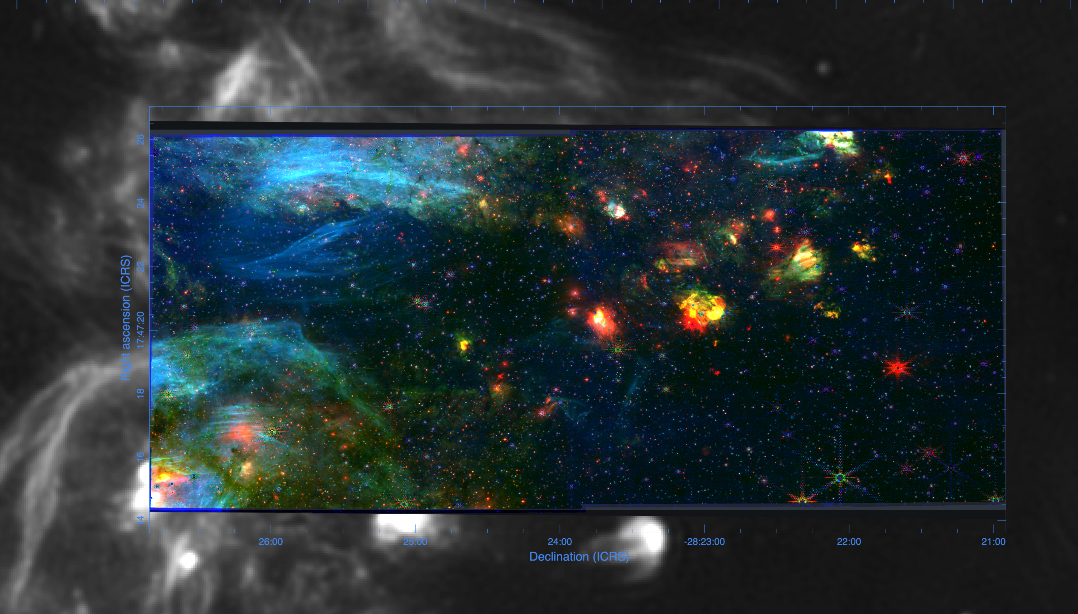
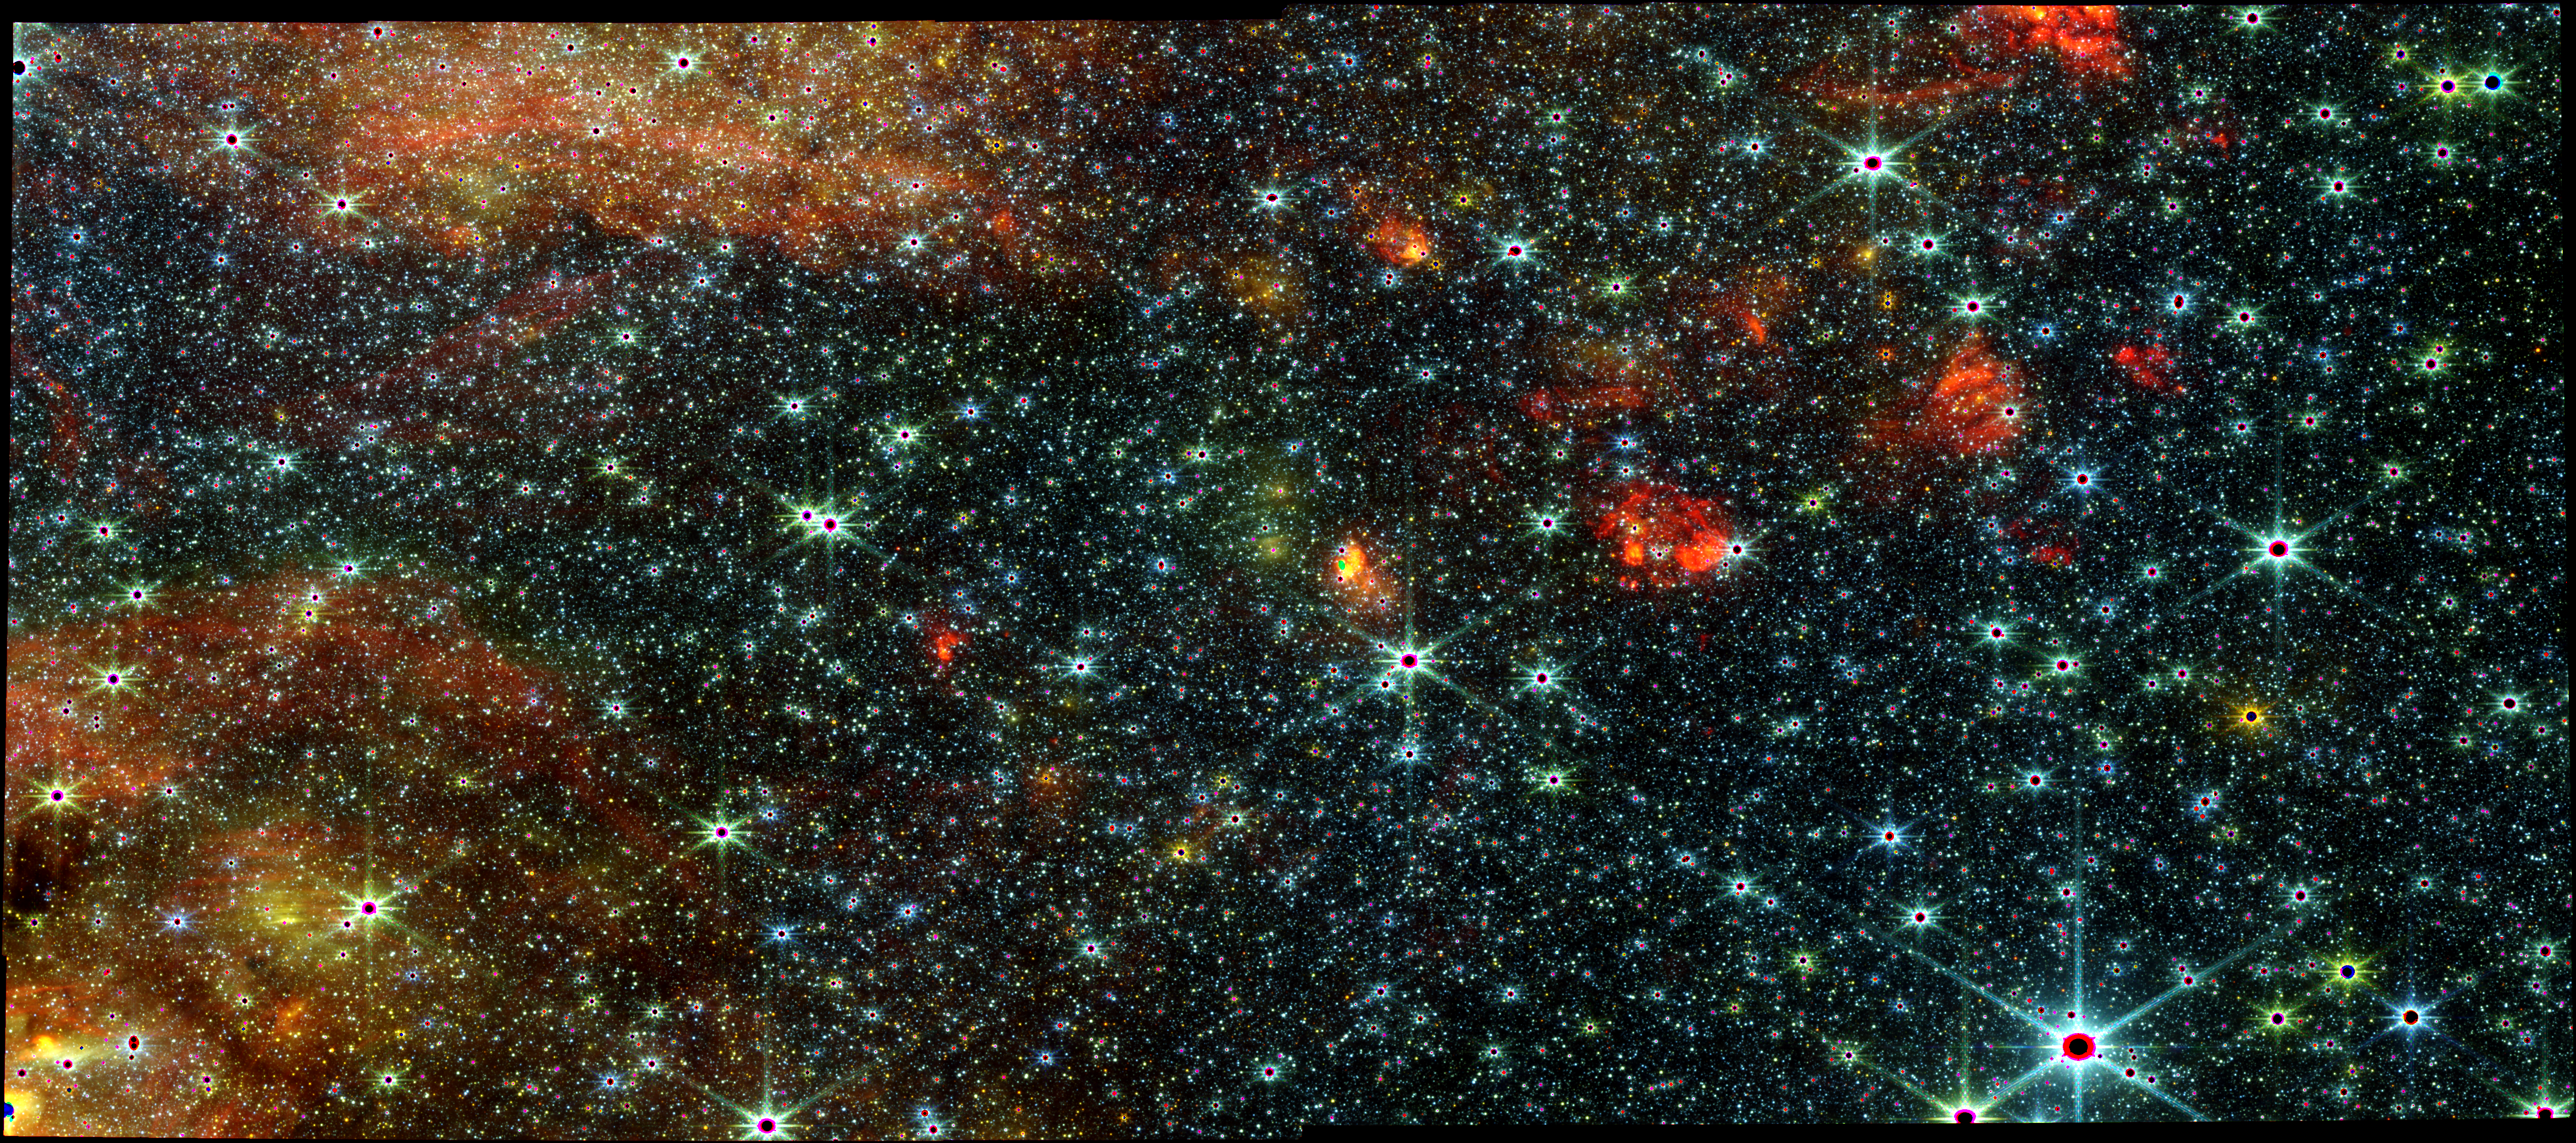
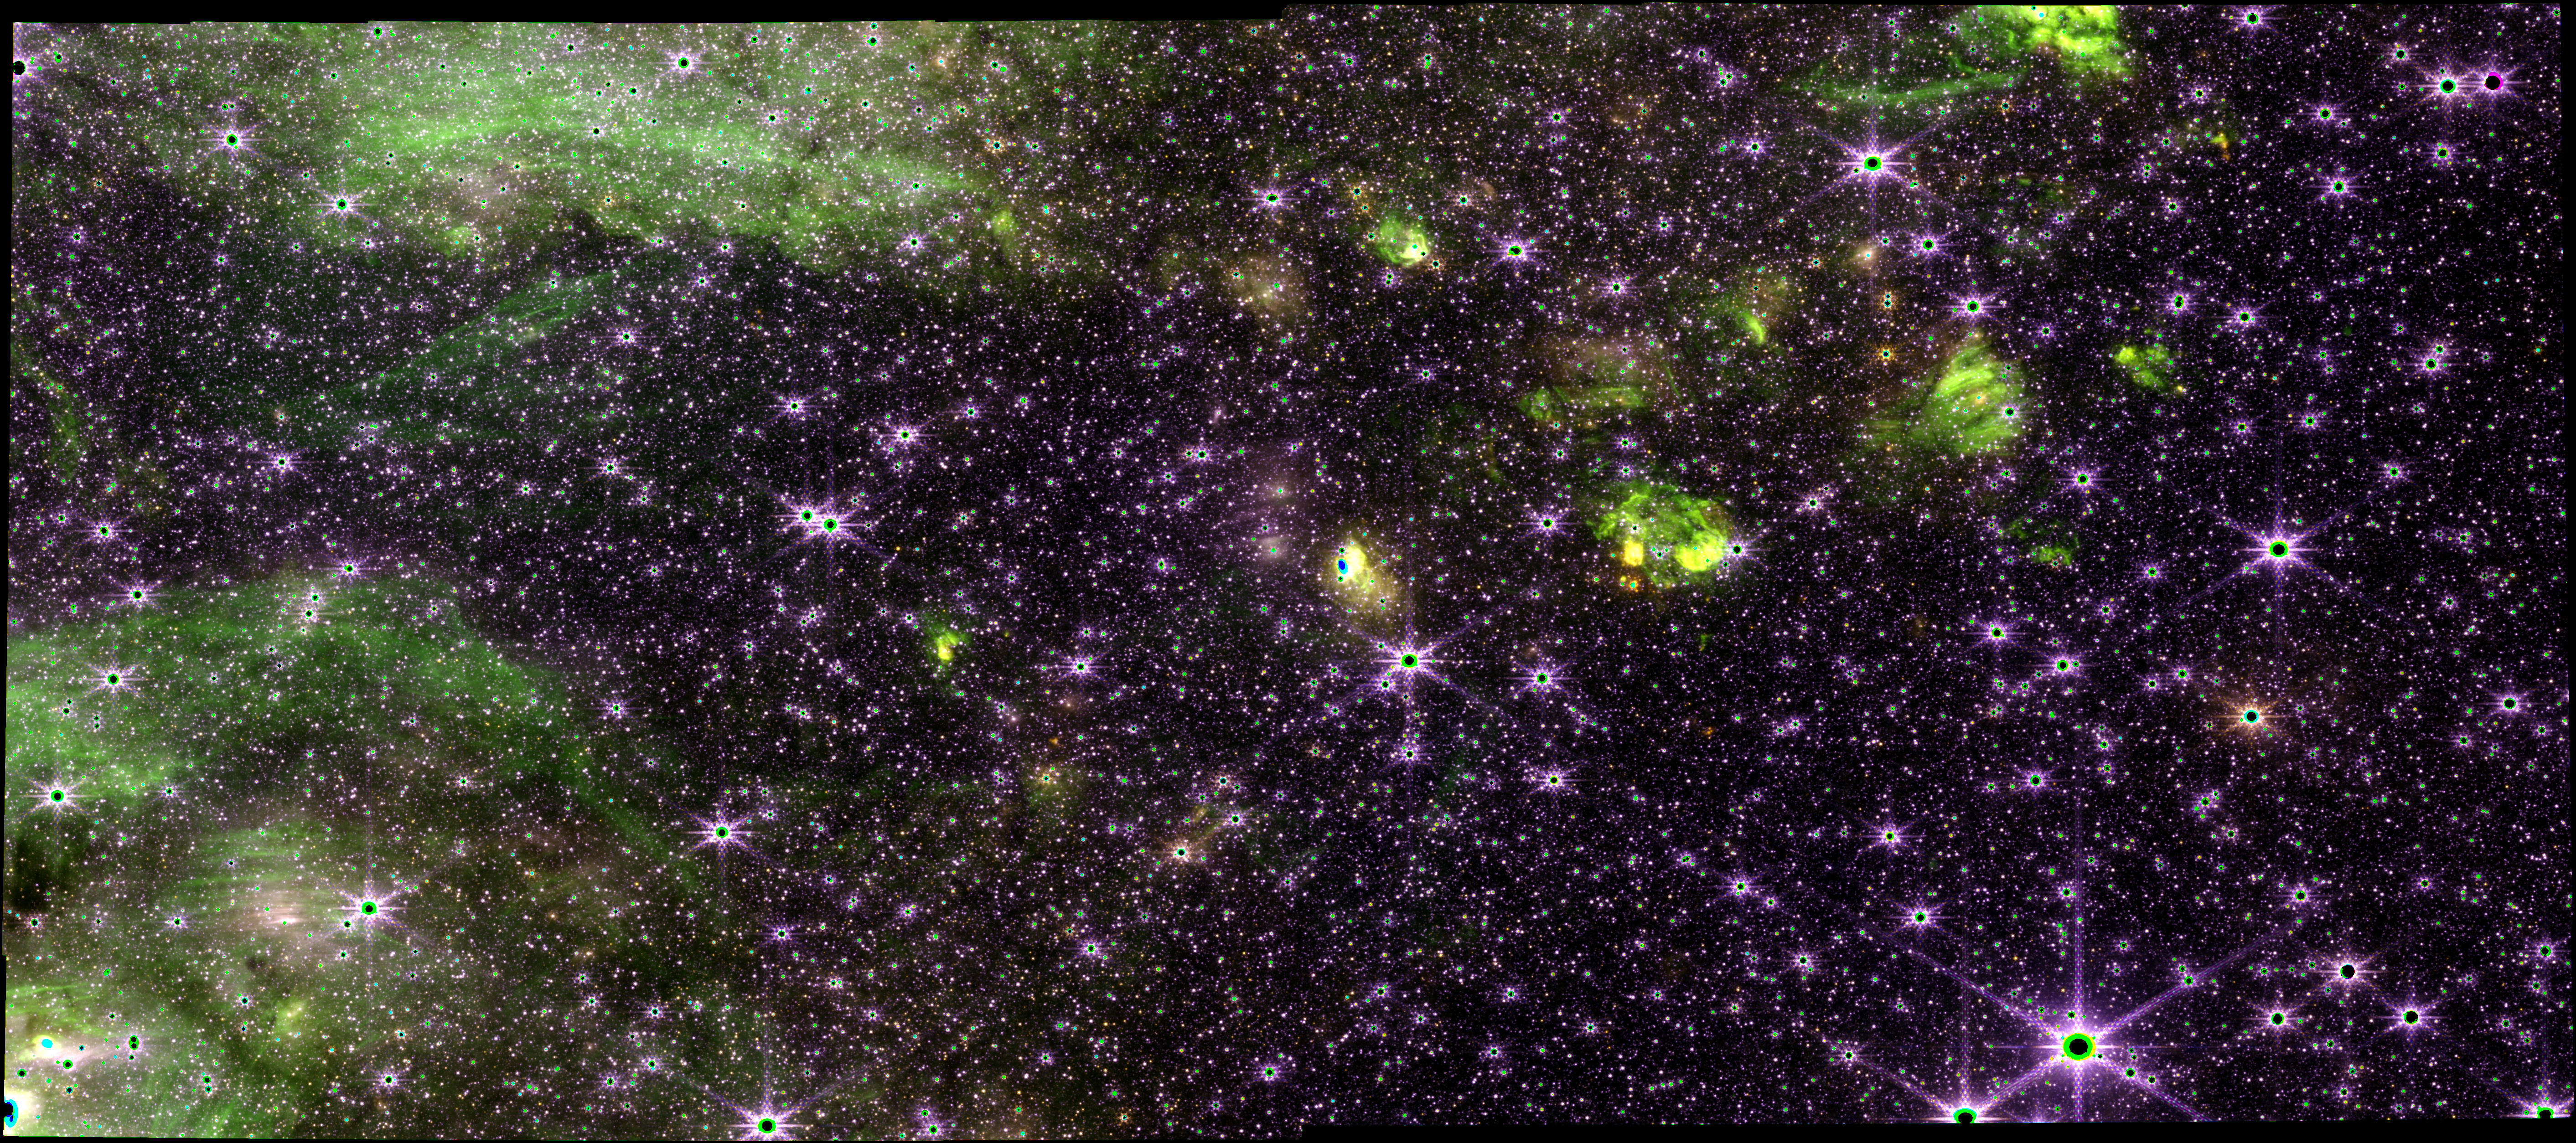
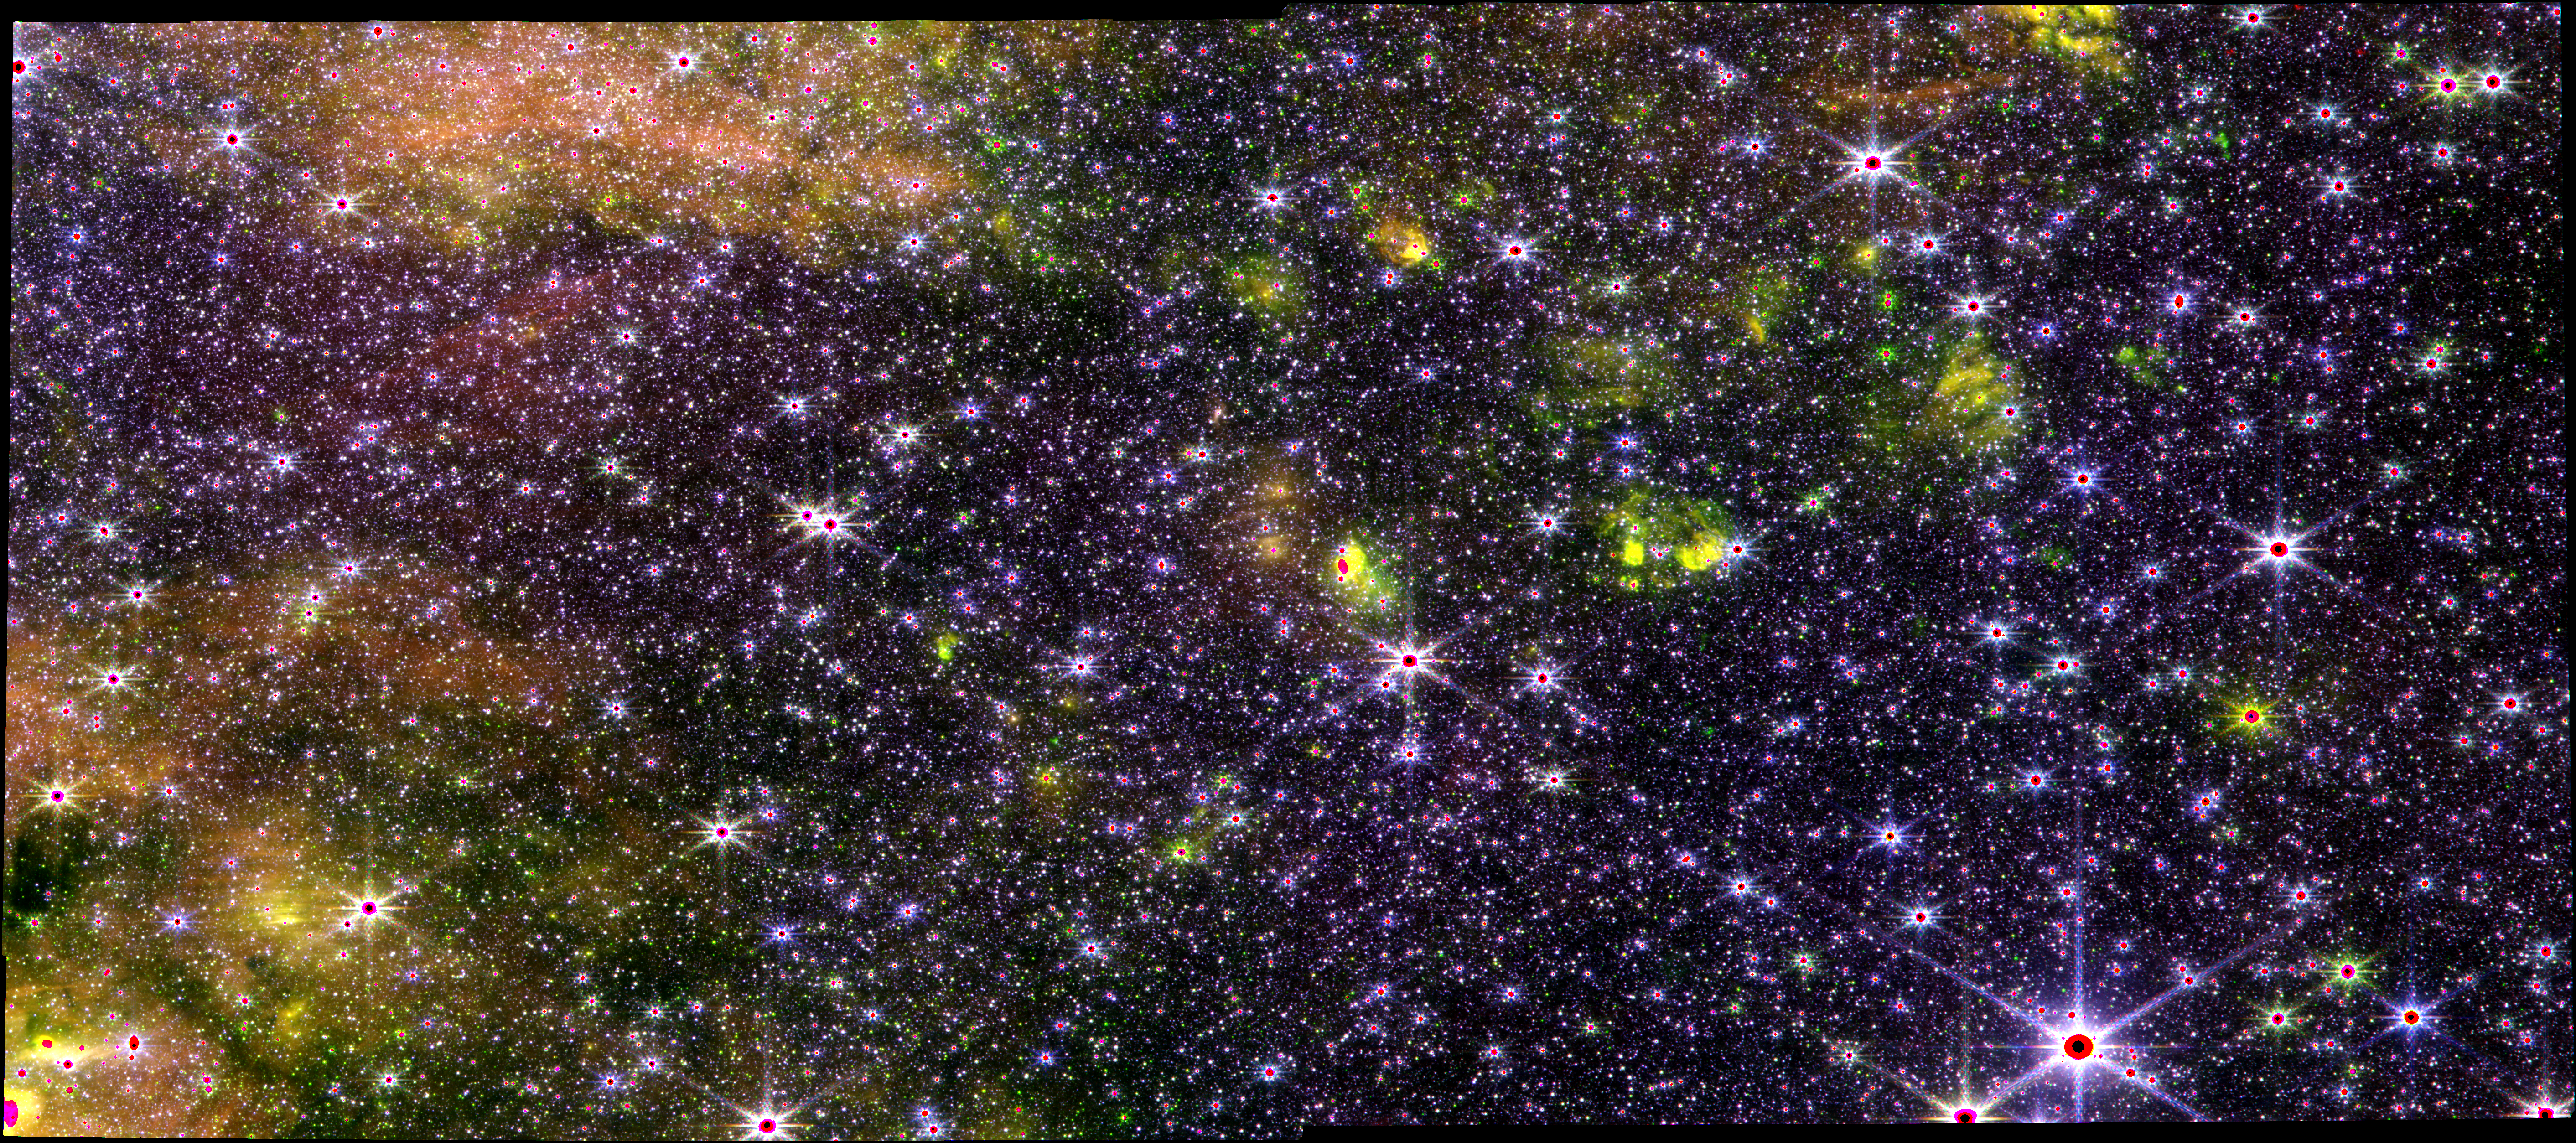
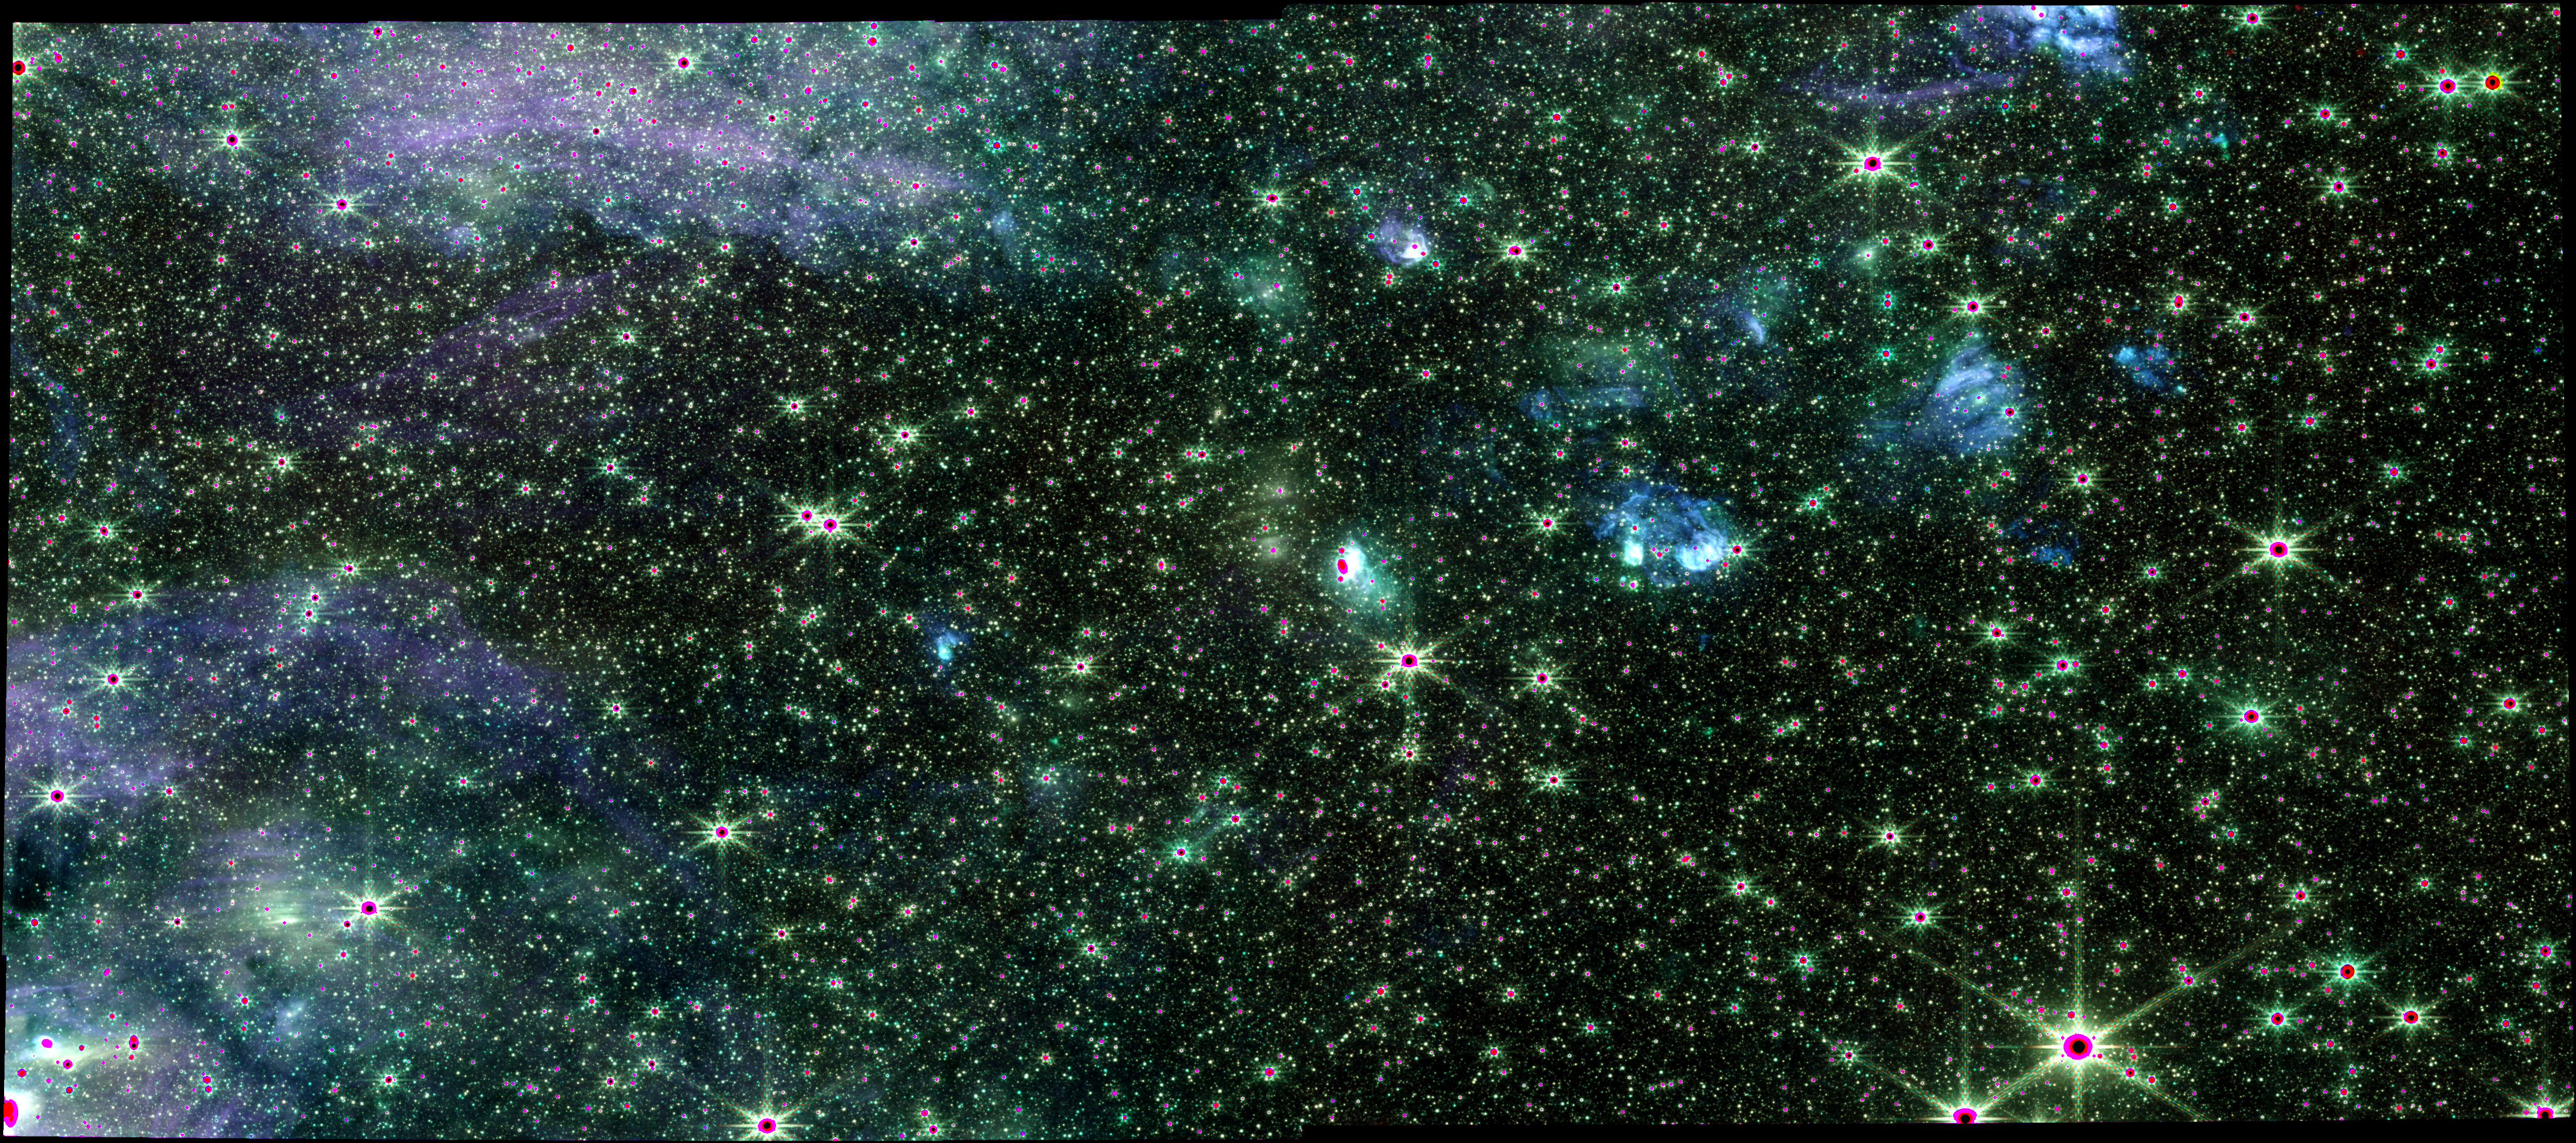
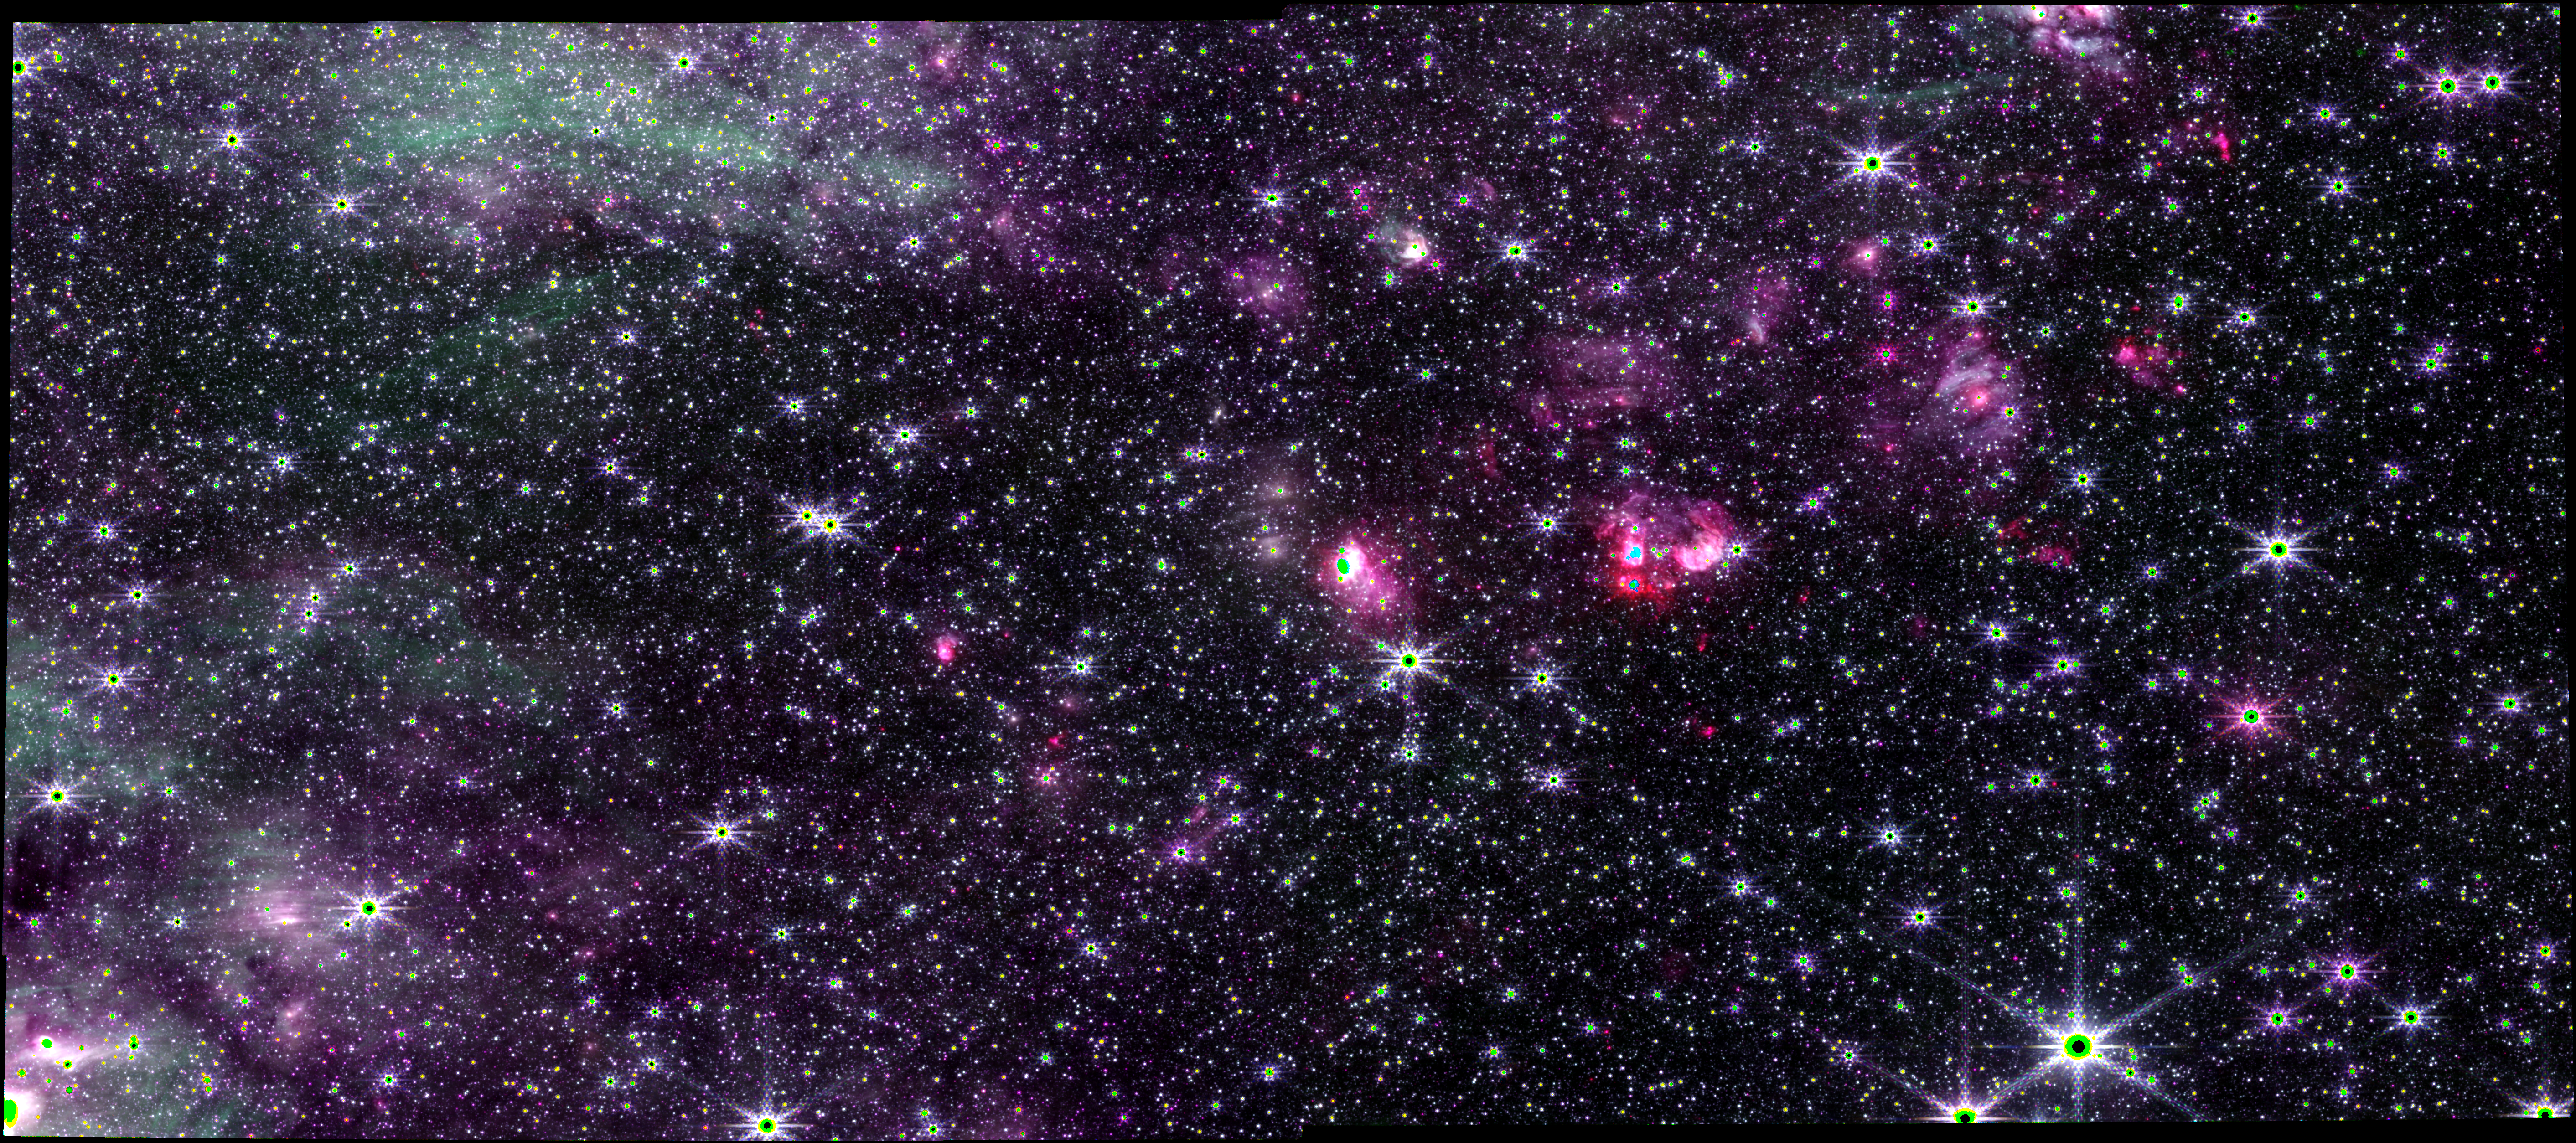
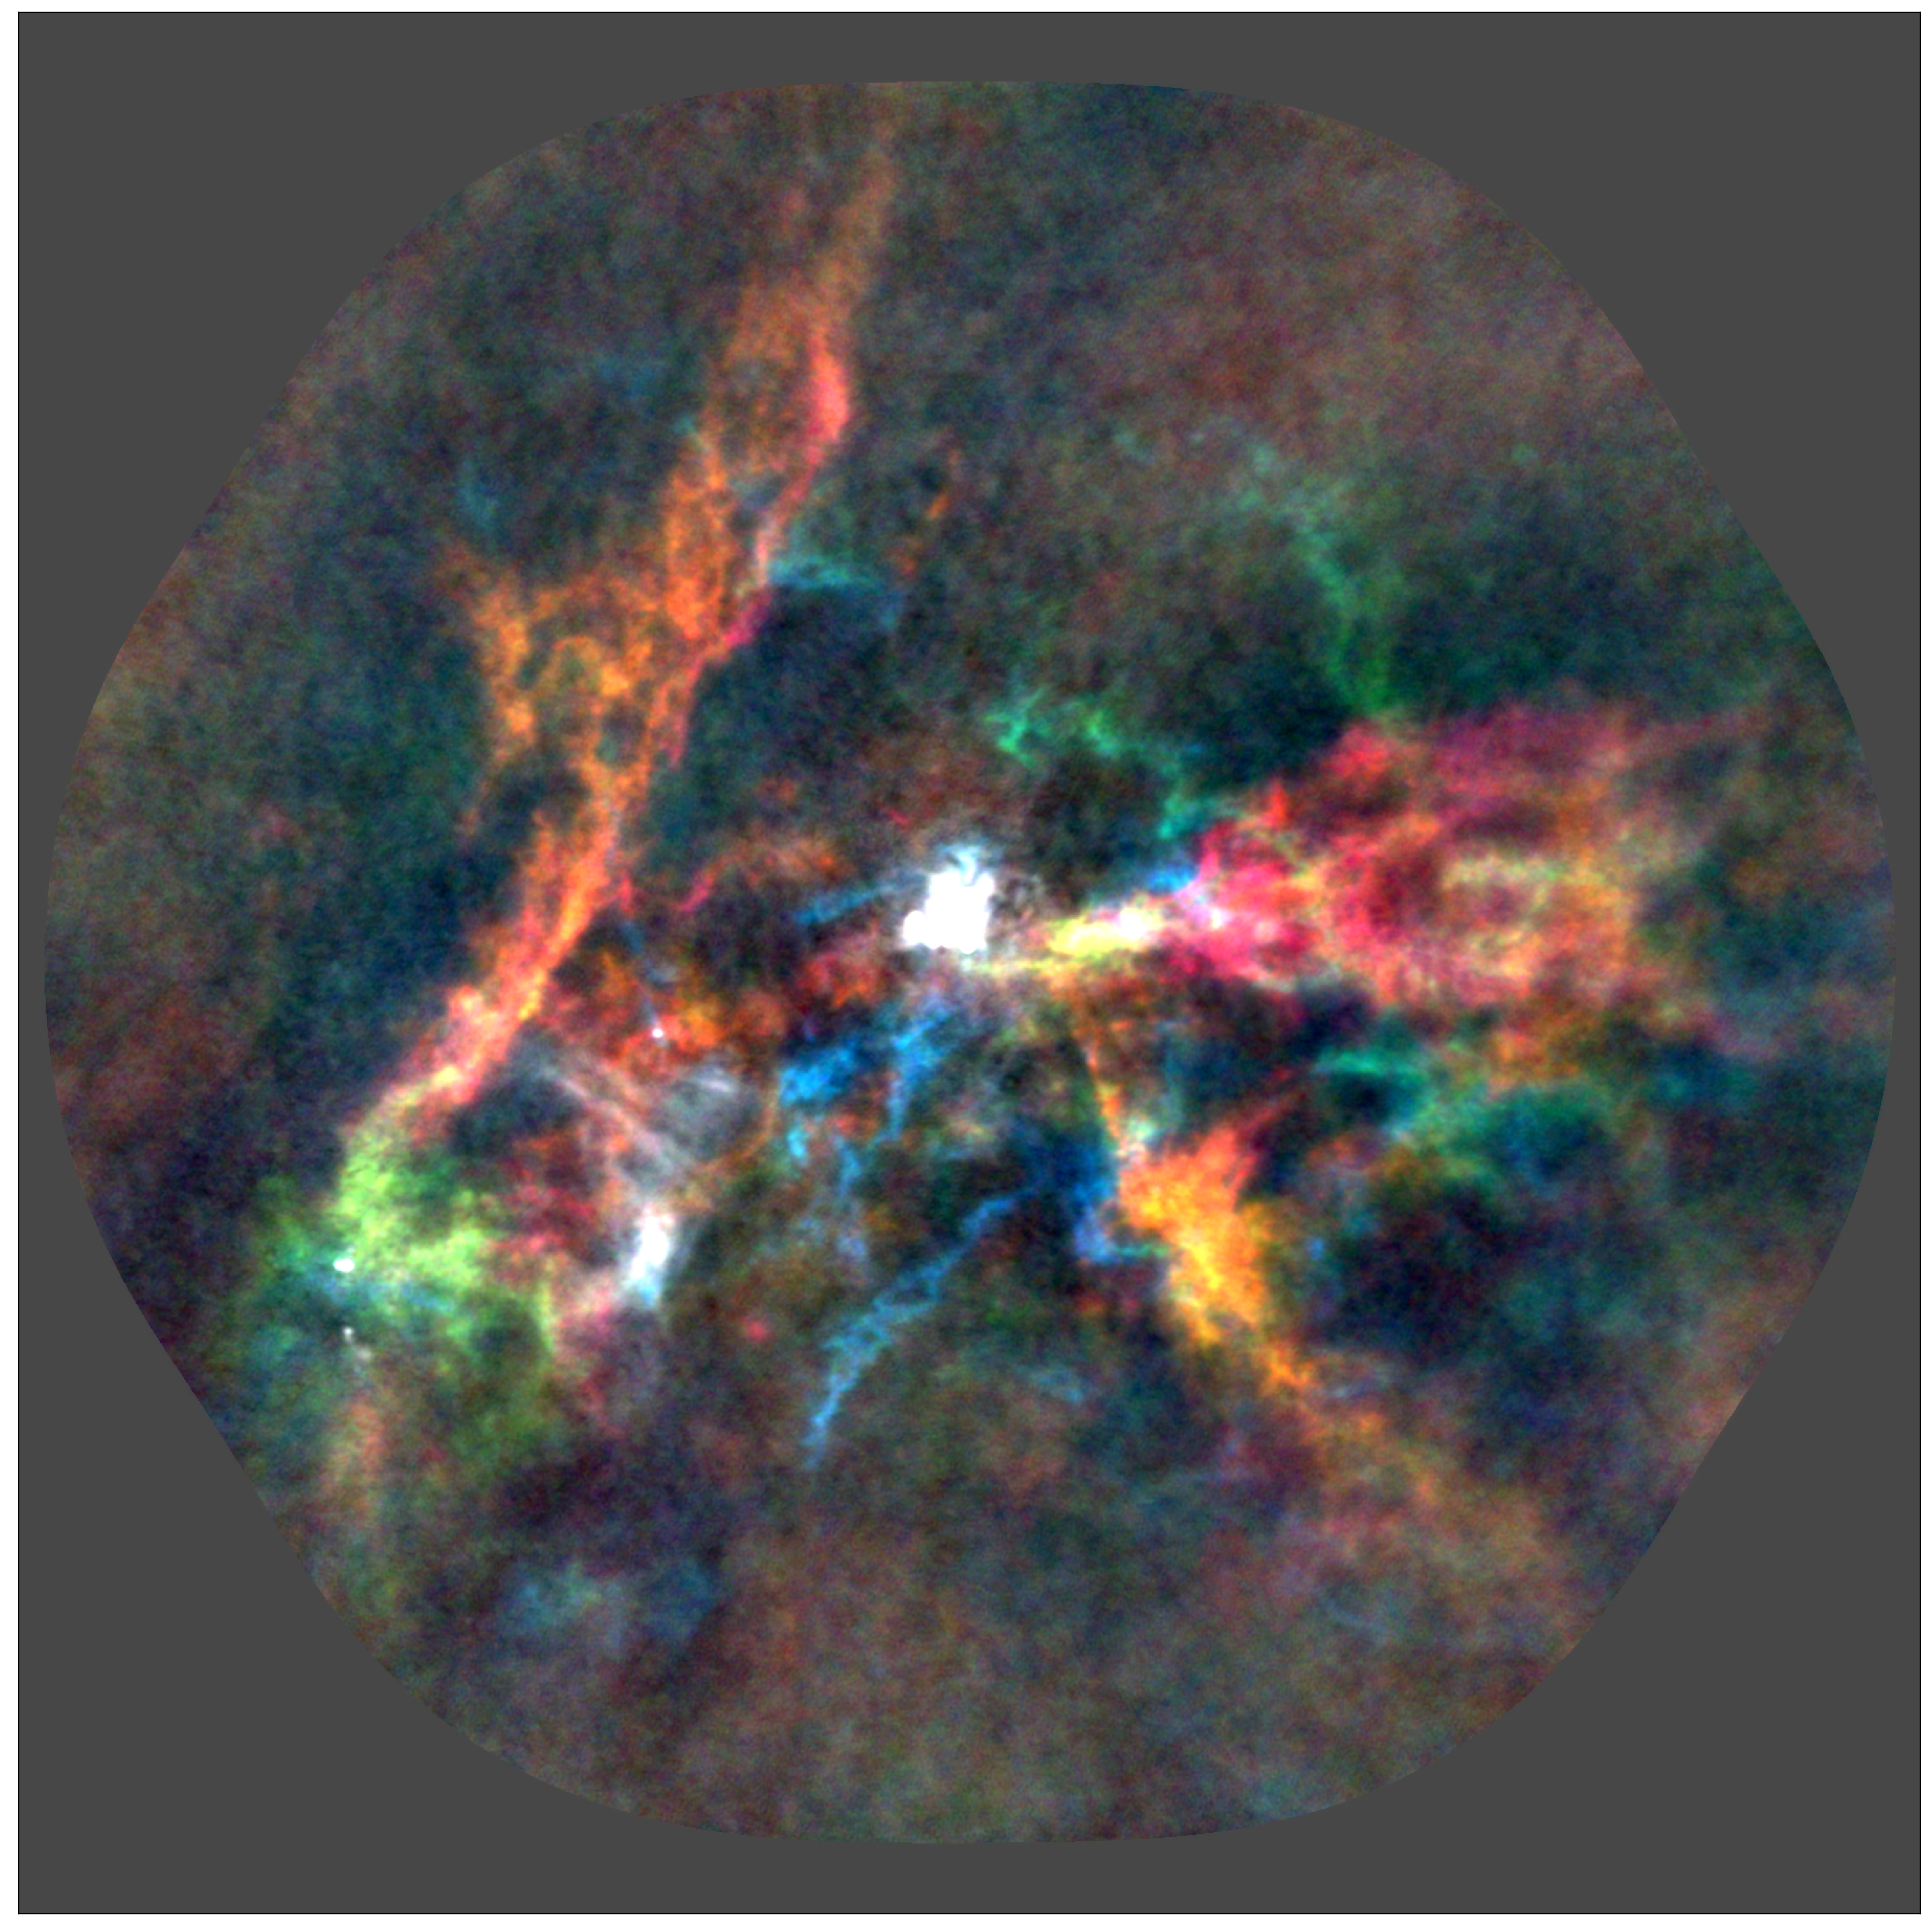
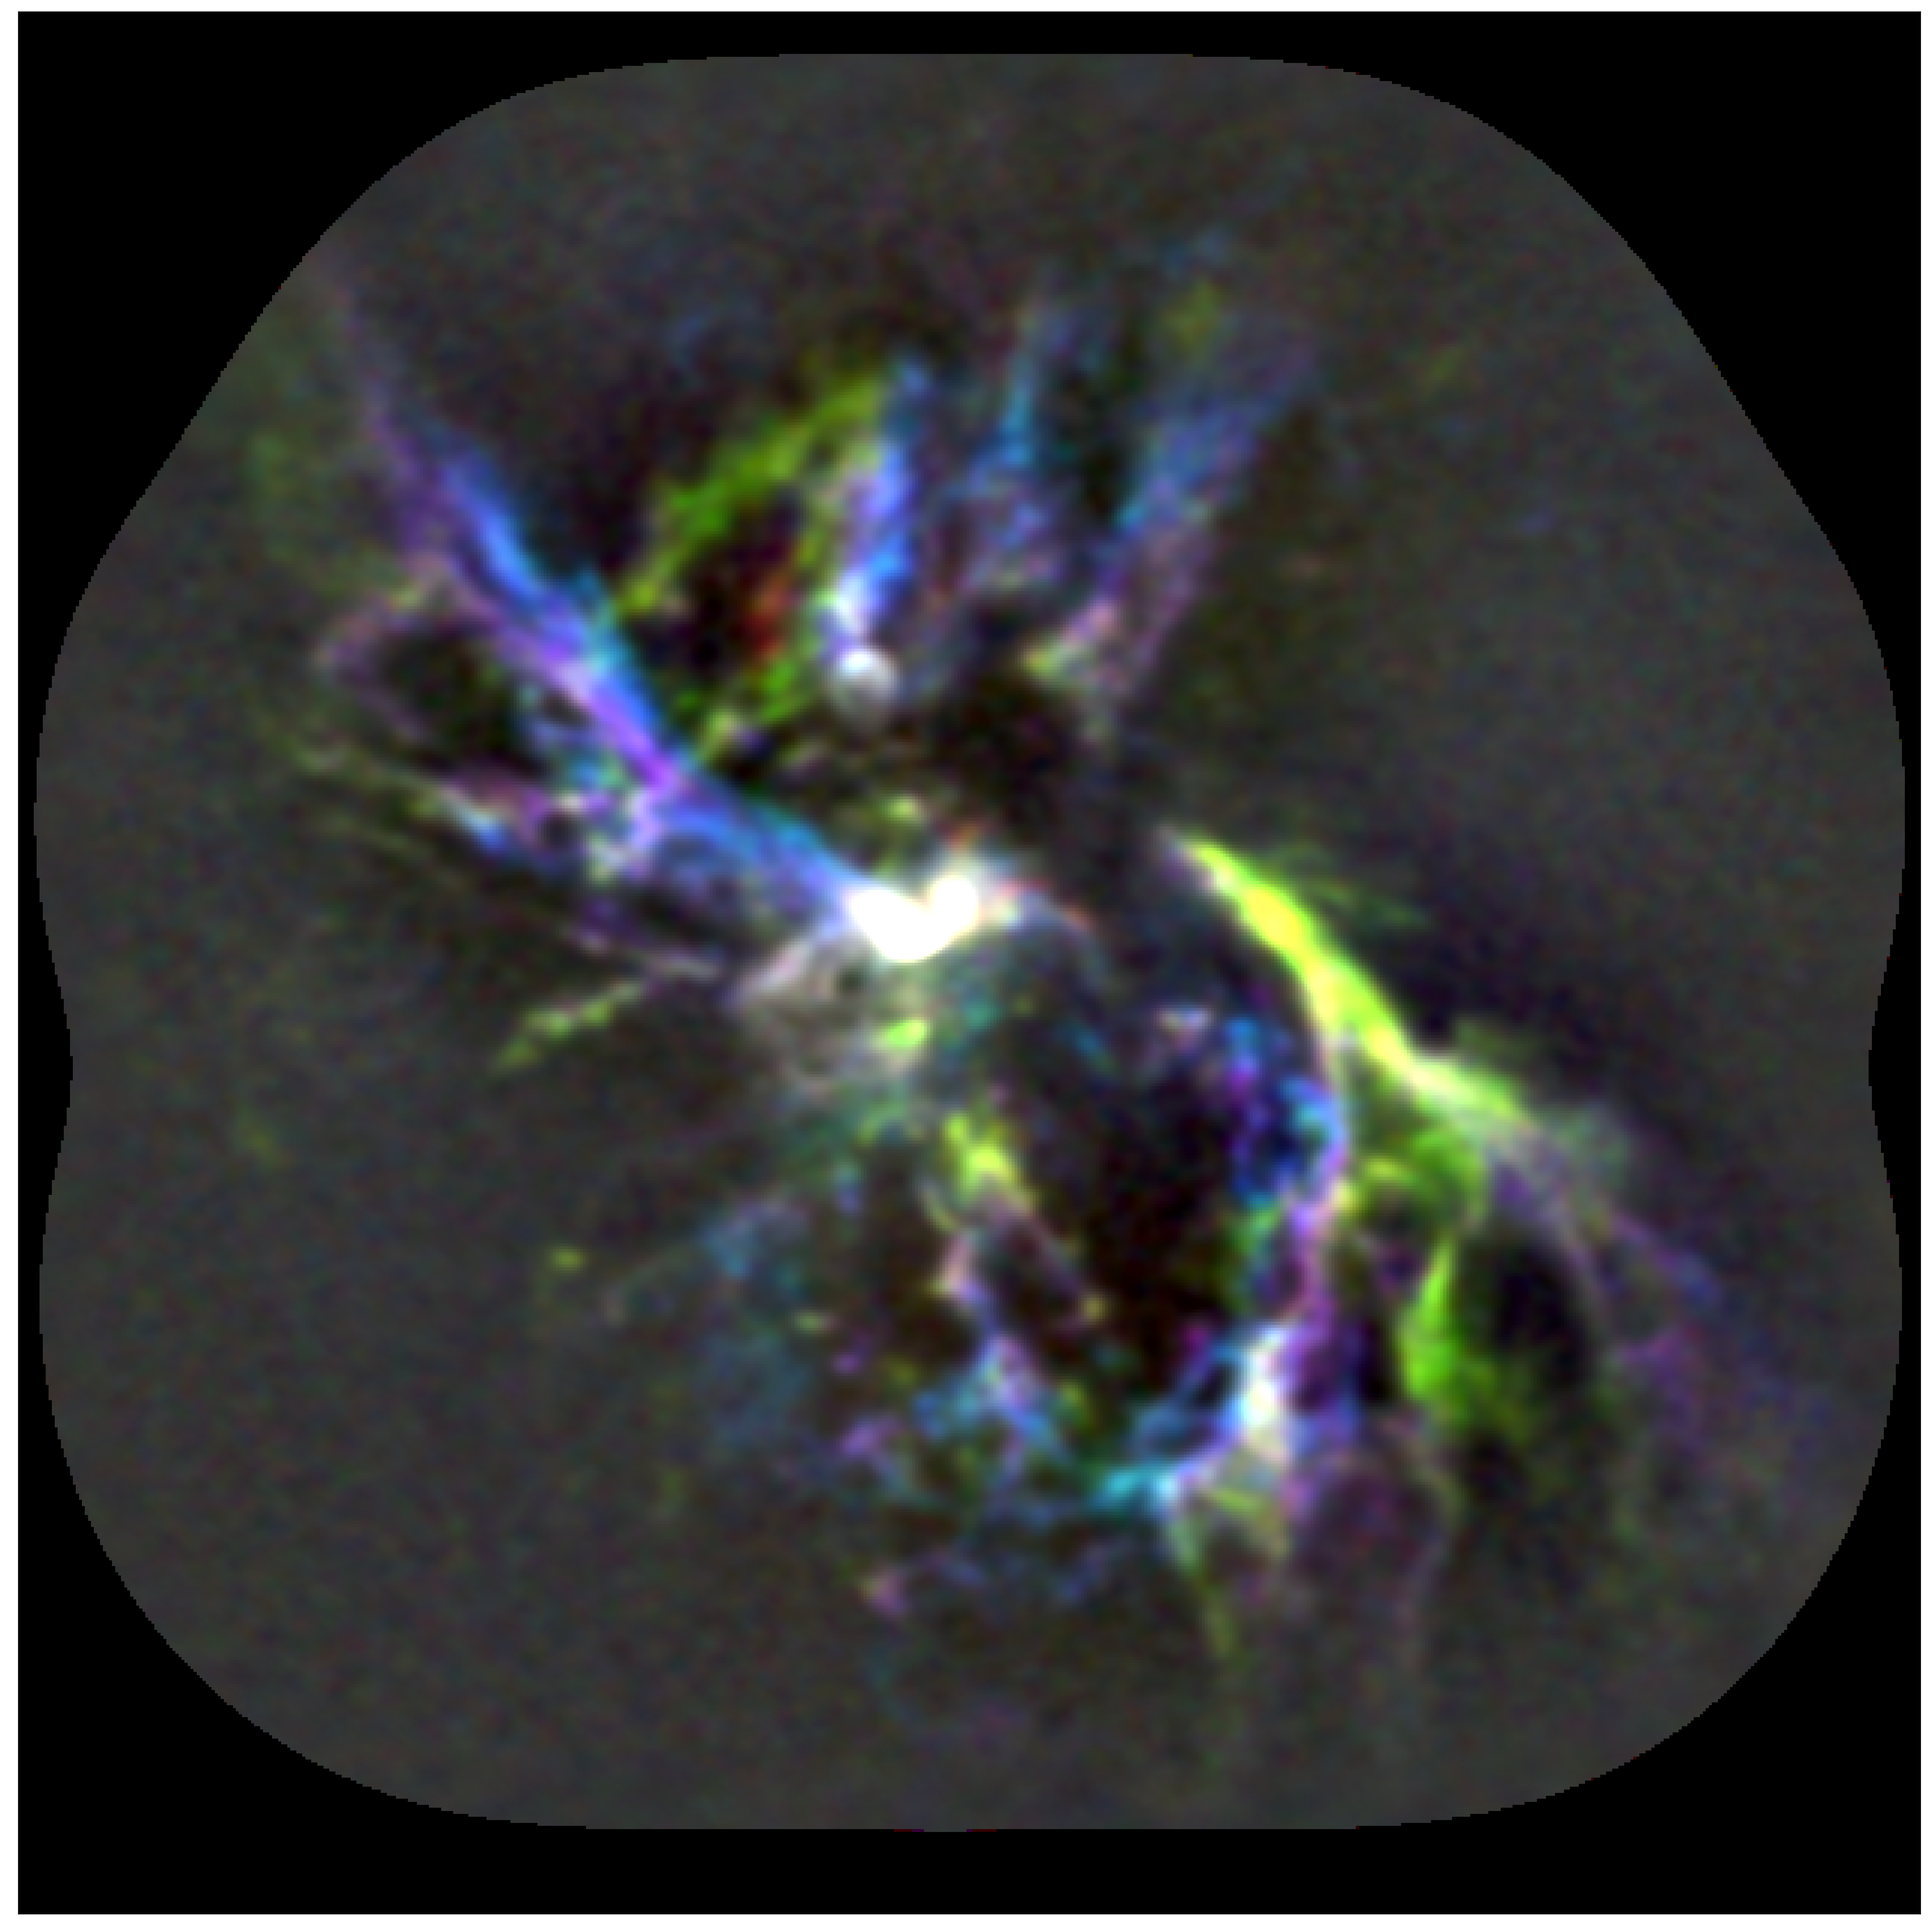
The CMZ: ACES (the ALMA CMZ Exploration Survey)
The first complete survey of the CMZ with 2.4" resolution between ~2 microns and 10 cm. (previous best was ~15")
https://sites.google.com/view/aces-cmz/home
https://sites.google.com/view/aces-cmz/home
First five data papers refereed (resubmitted Nov 2025); six early-result papers out:
https://sites.google.com/view/aces-cmz/publications
https://sites.google.com/view/aces-cmz/publications
ACES: the first results
The survey overview, four data-release papers, and a wave of early-science results — the first ~10 ACES papers (2024–2026)
Publications: sites.google.com/view/aces-cmz/publications
I. The survey: a contiguous ALMA view of the inner ~200 pc
~2″ (~0.07 pc) Band-3 mosaic of the whole CMZ; spatial dynamic range ~103.5 links 100-pc gas flows to protostellar cores.
ACES I (Overview), Longmore+ 2026 — arXiv:2602.20340
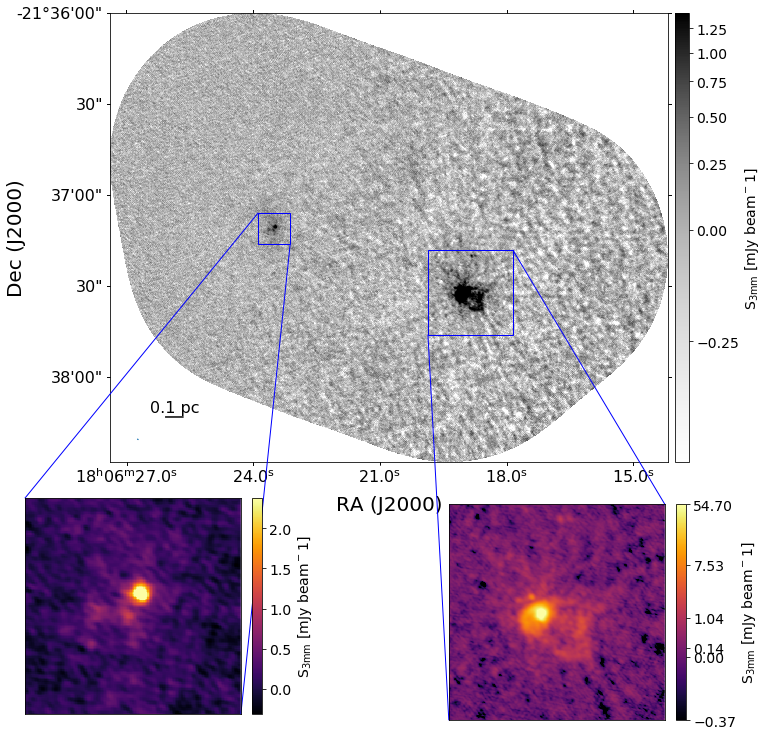
II. CMZ-wide 3 mm continuum
A contiguous 3 mm continuum mosaic (dust + free-free) across the CMZ; catalog of compact sources forthcoming (Wallace+).
ACES II (3 mm continuum), Ginsburg+ 2026 — arXiv:2602.20240
III. Gas kinematics at 0.2 km/s: a resolution leap
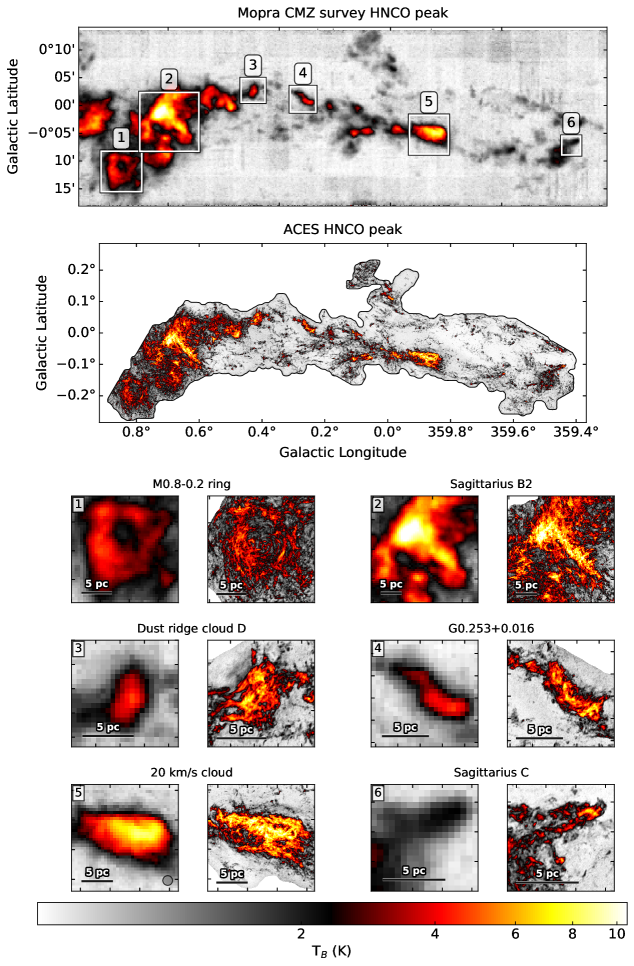
HNCO & HCO+ resolve CMZ-wide motions (~15″ Mopra → ~2″ ACES); ubiquitous parsec-scale linear HCO+ absorption features.
ACES III (HNCO/HCO+), Walker+ 2026 — arXiv:2602.20276
IV. Shock tracers & isotopologues at 1.7 km/s
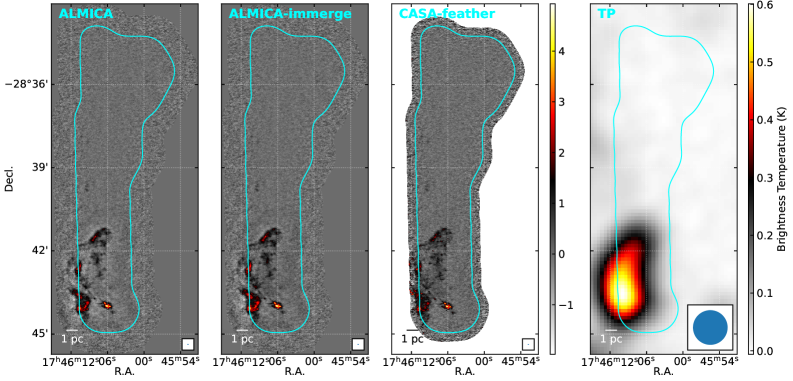
SiO, SO, H13CO+, H13CN, HN13C, HC15N maps.
Evaluation of image combination methods (feather is fine)
ACES IV (intermediate-width windows), Lu+ 2026 — arXiv:2602.20445
V. A rich spectrum: COMs and ionized gas
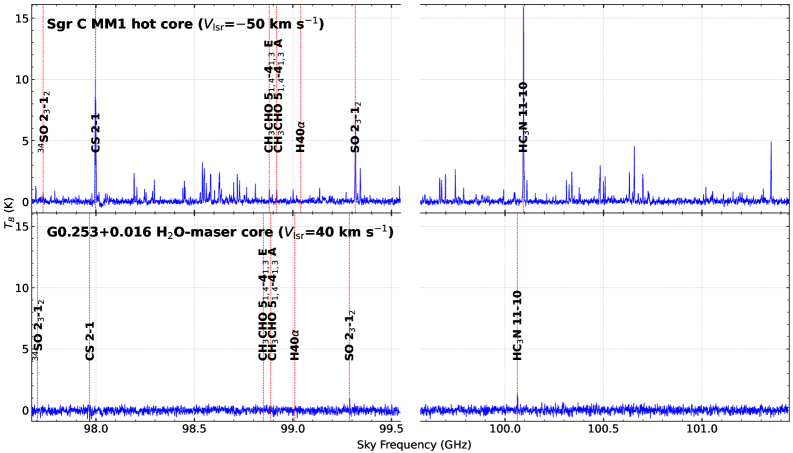
The broad windows (CS, SO, CH3CHO, HC3N, H40α) capture dozens of lines — complex molecules plus the H40α recombination line tracing ionized gas.
ACES V (broad windows), Hsieh+ 2026 — arXiv:2603.00863
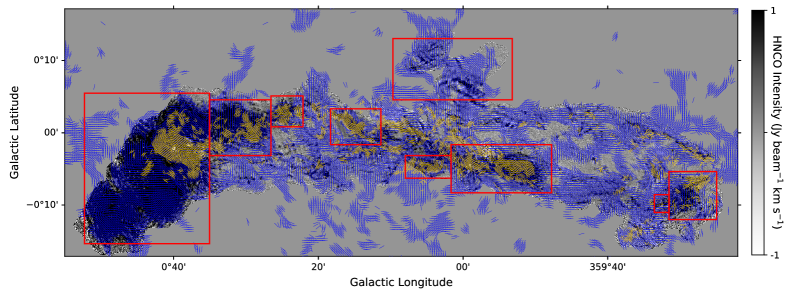
VI. The CMZ is highly filamentary
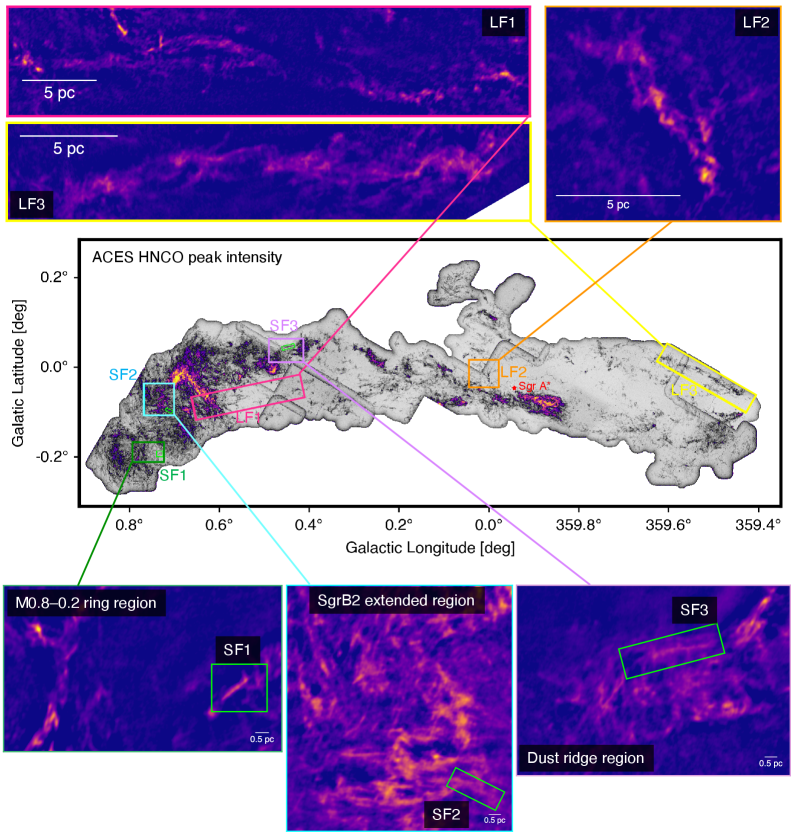
ACES resolves a population of small-scale filaments threading the entire CMZ — a new census of these structures.
ACES VI (filamentary CMZ), Battersby+ 2026 — arXiv:2602.20262
The MUBLO: a millimeter ultra-broad-line object
A bright, very broad-line (~160 km/s), cold, dusty mm source with no IR/radio counterpart and no SiO — still unexplained.
Ginsburg+ 2024, ApJL 968, L11 — 2024ApJ...968L..11G
The M0.8–0.2 ring: a hypernova remnant?
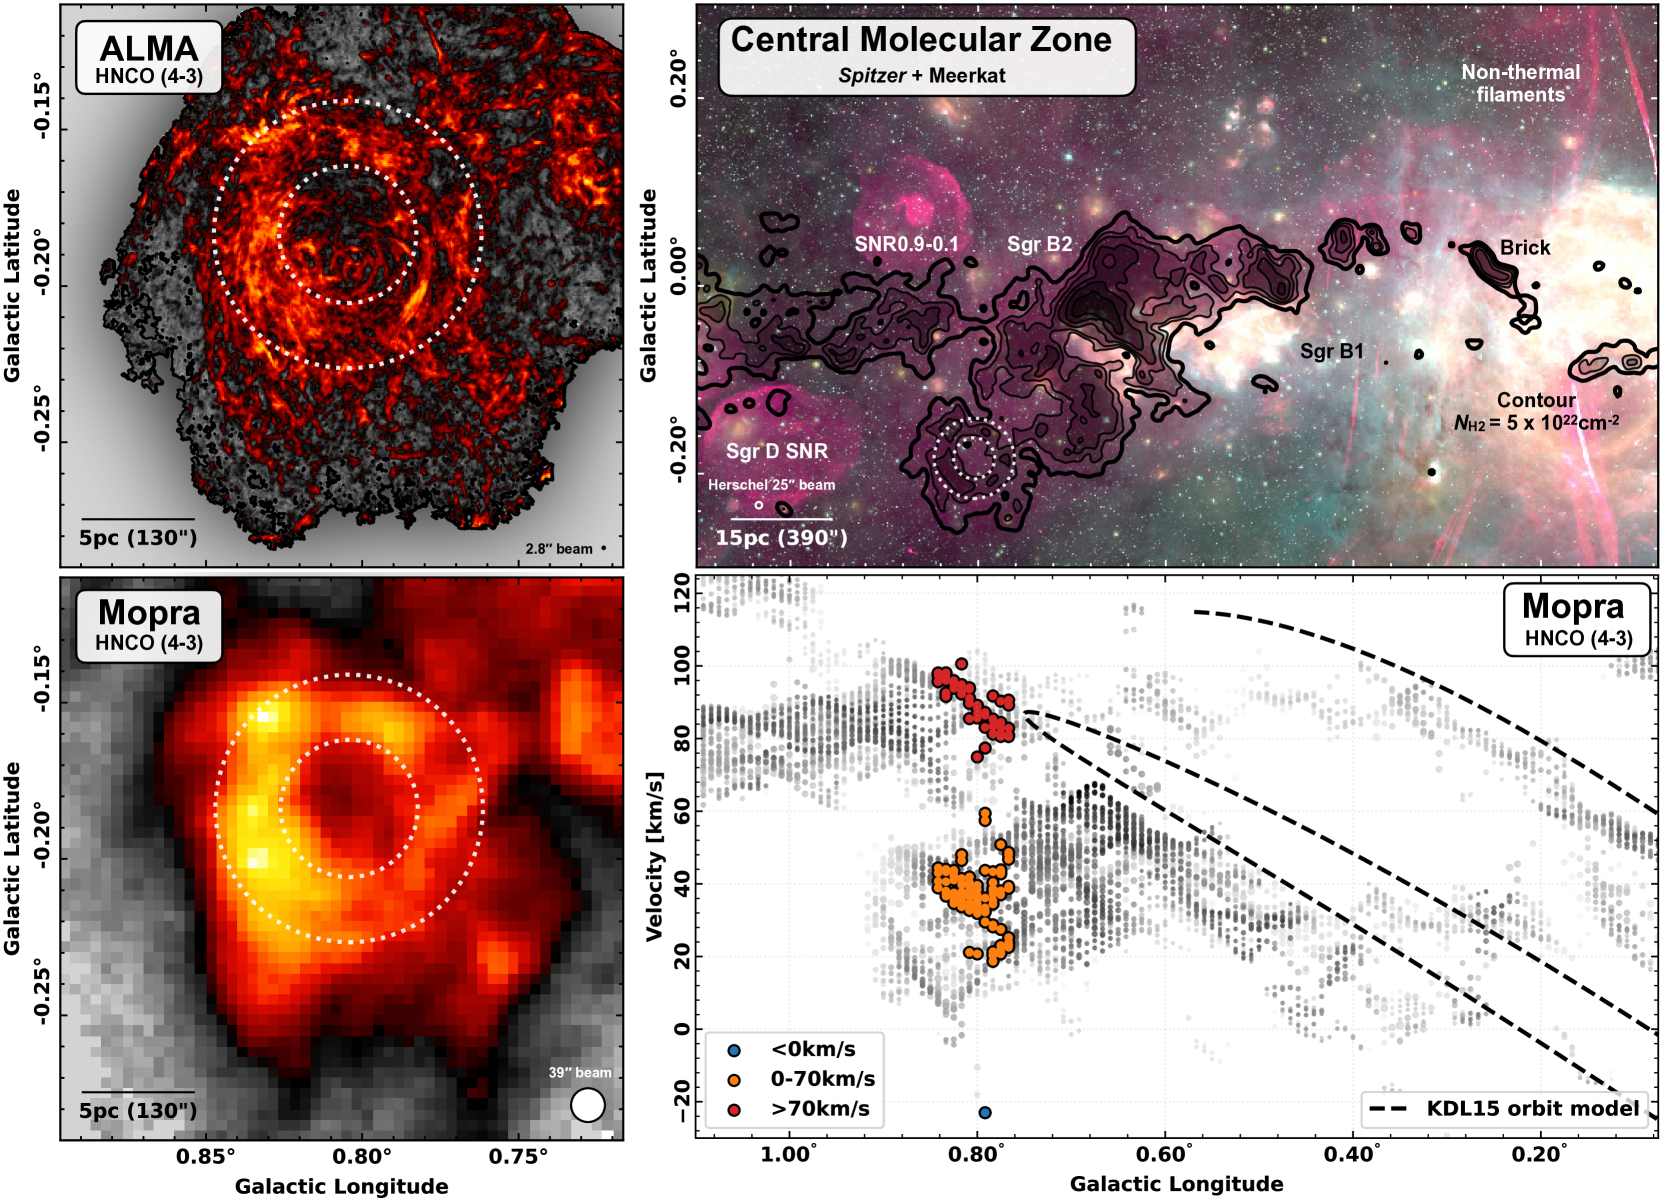
A ~106 M⊙ expanding shell (~20 km/s, >1051 erg) — most plausibly carved by a single high-energy hypernova.
Nonhebel+ 2024 — arXiv:2409.12185
but recall Betteridge's law of headlines
An eccentric circum-nuclear gas flow around Sgr A*
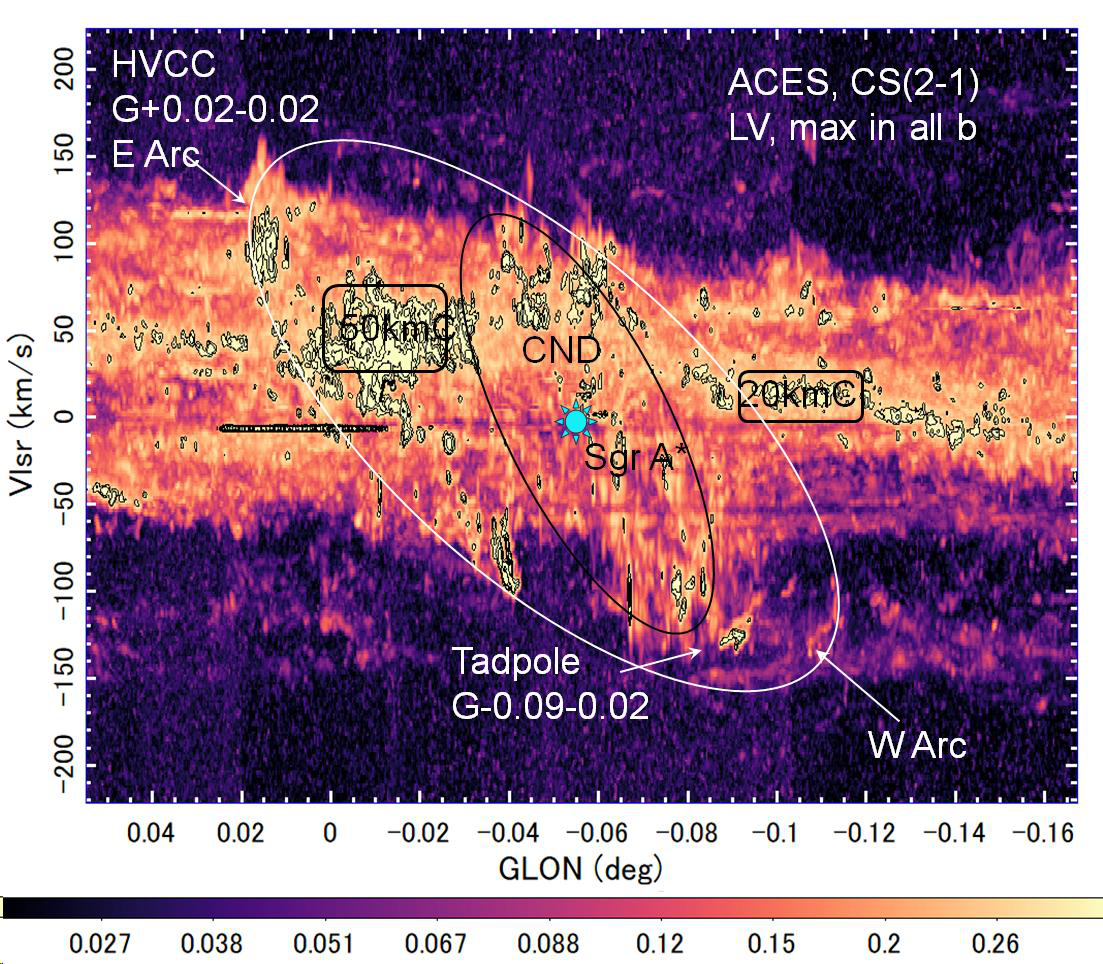
CS(2–1) draws an elliptical track in the longitude–velocity diagram — an eccentric orbit of dense gas in the inner ~10 pc.
Sofue 2025 — arXiv:2506.11553
Magnetic fields support the large filaments
Comparing HNCO filaments to SOFIA/JCMT polarization: many filaments sit in magnetically dominated environments that resist collapse.
Paré+ 2025 — arXiv:2511.18029
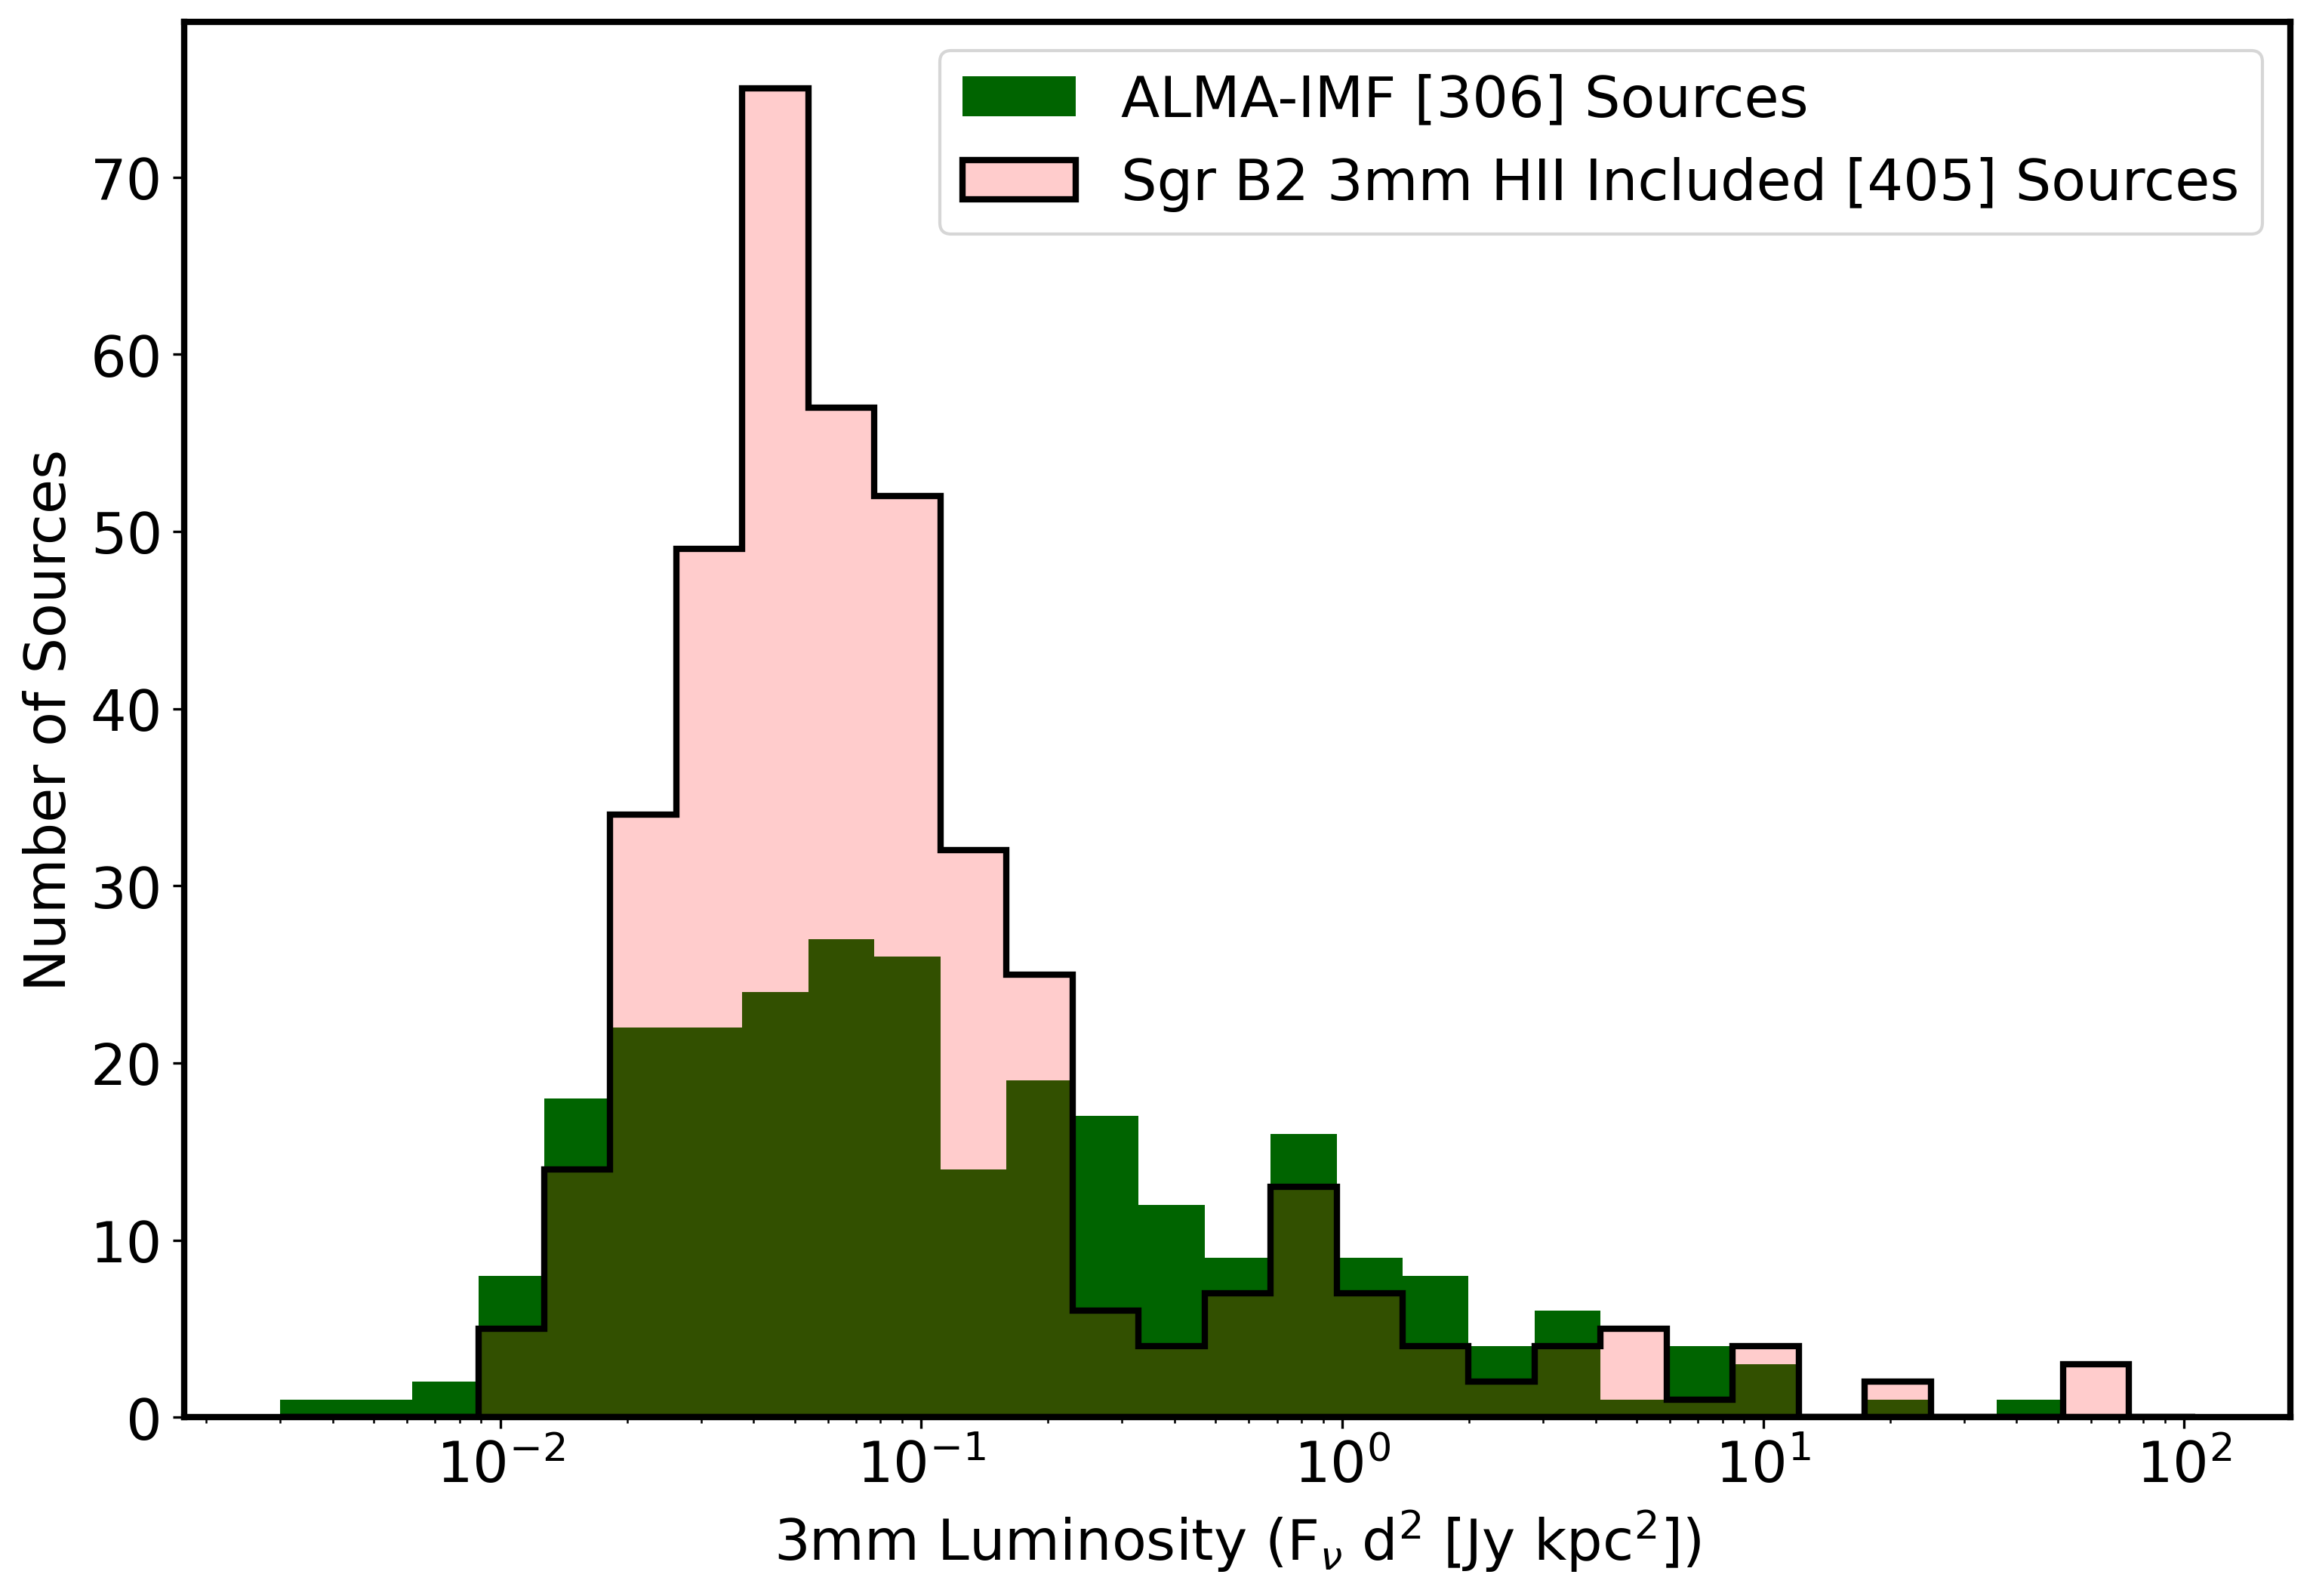
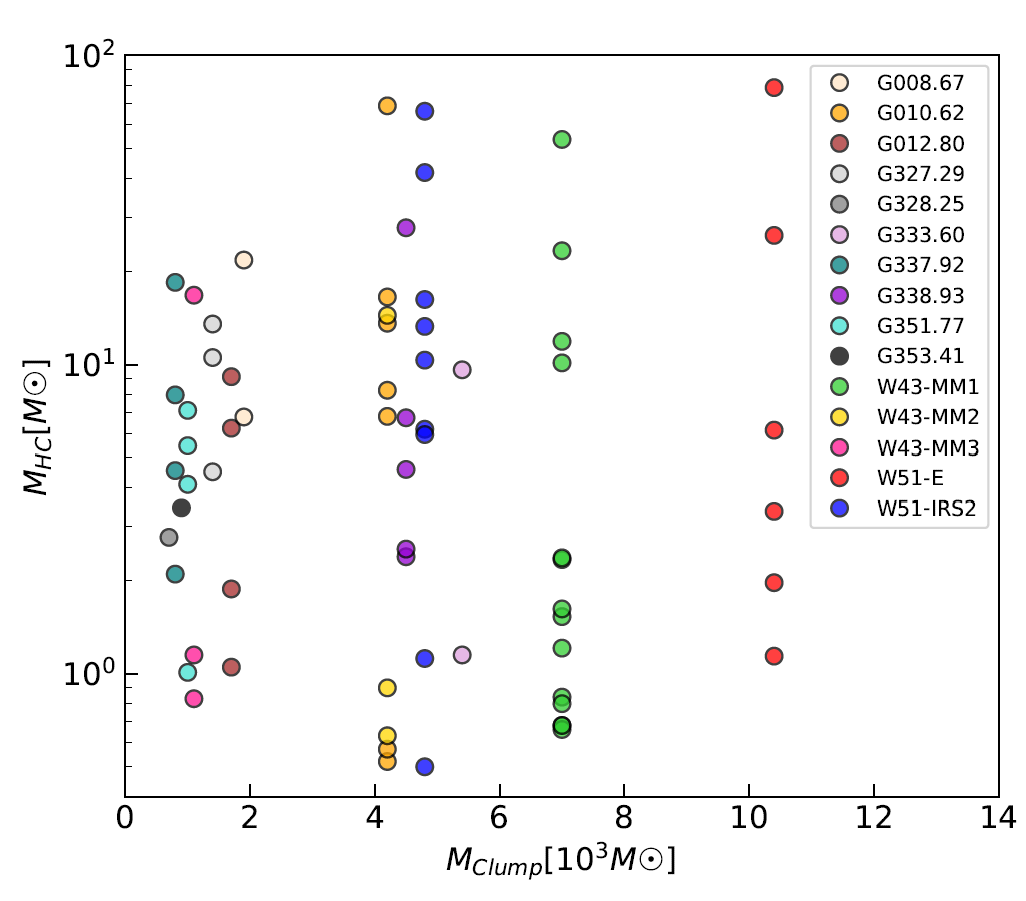
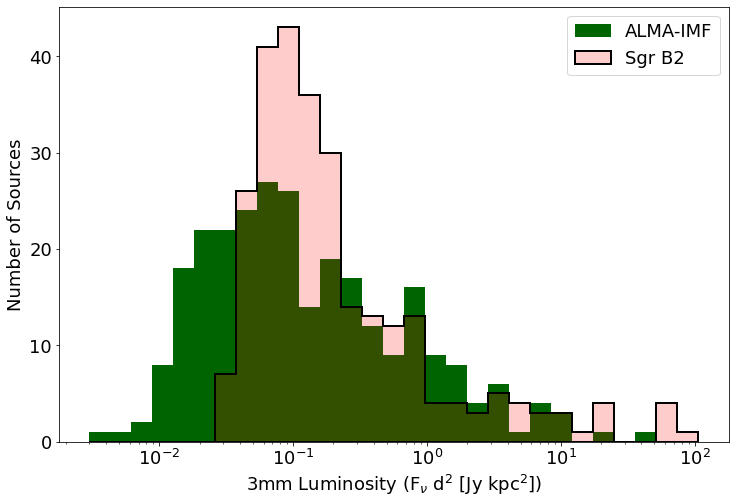
3 mm core luminosity functions
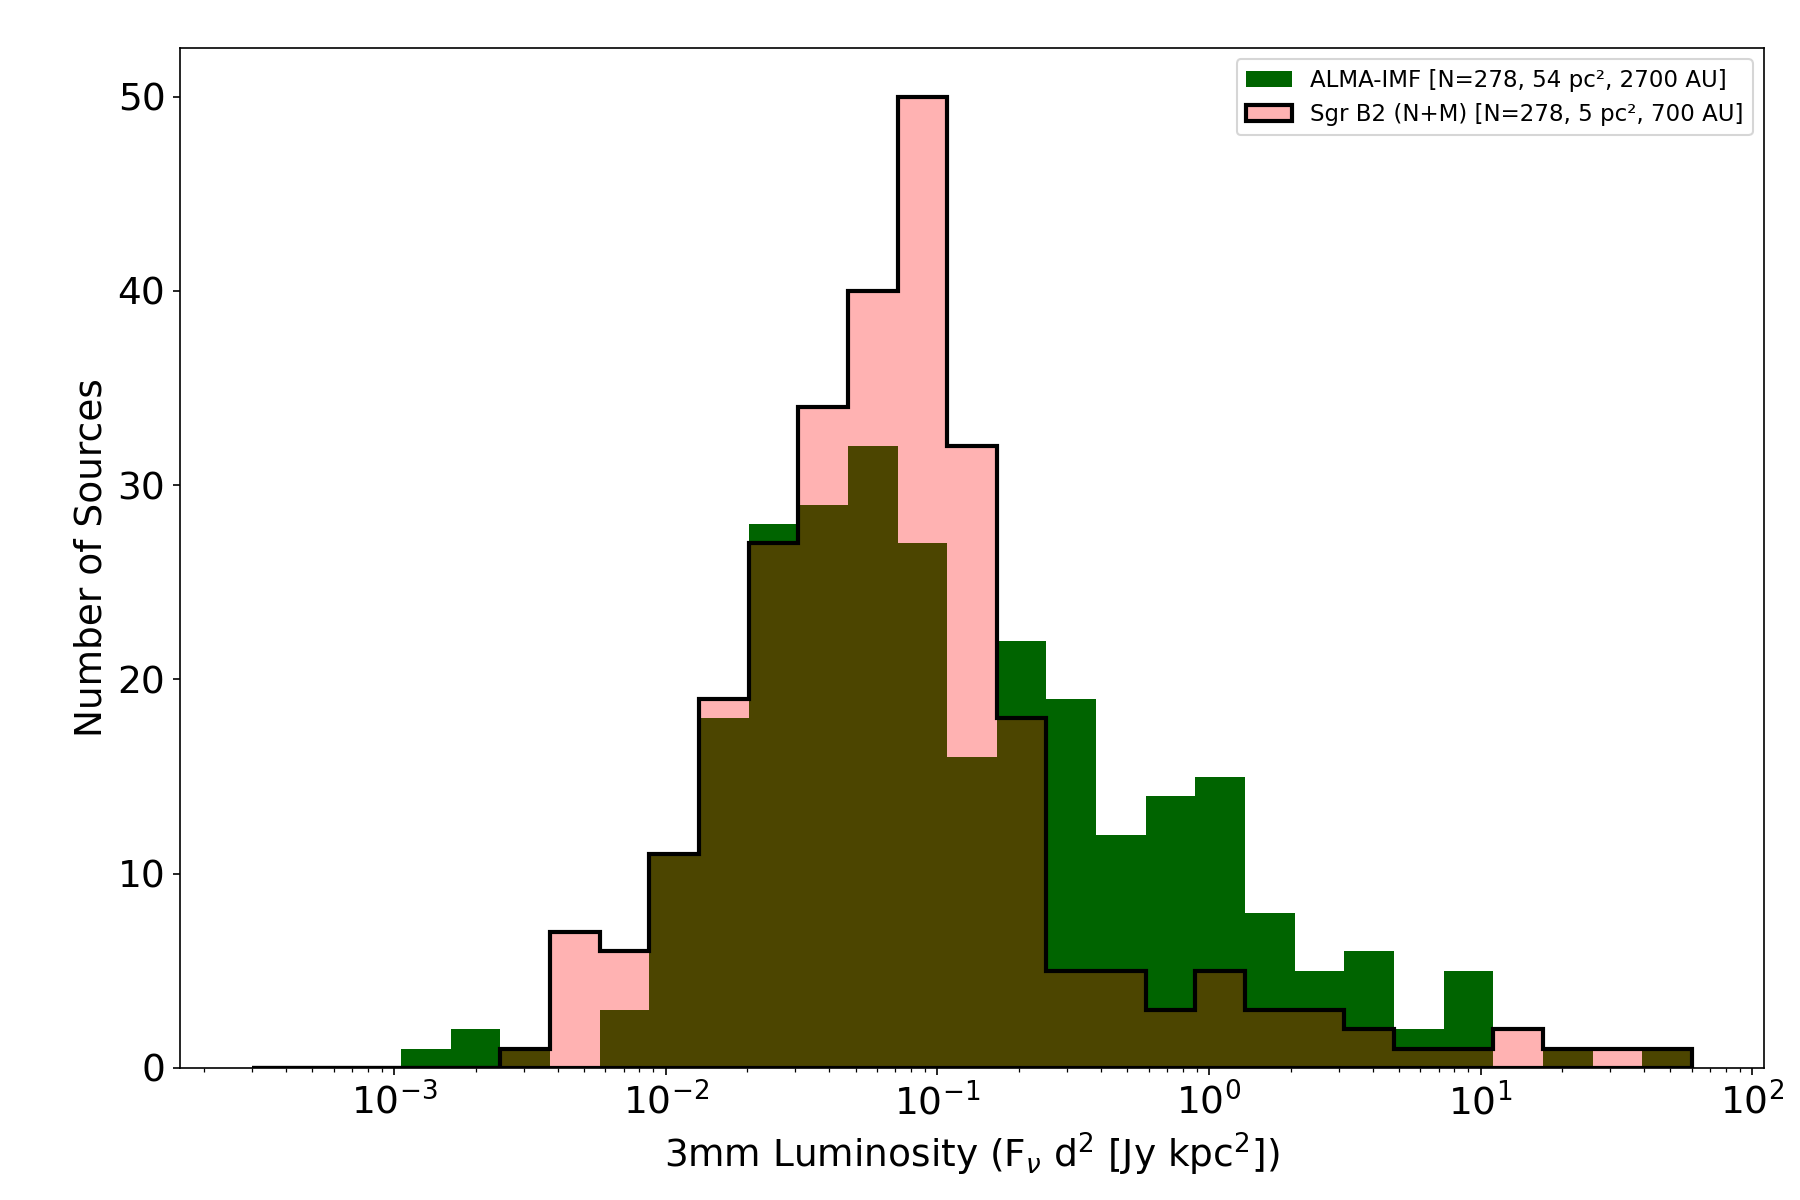
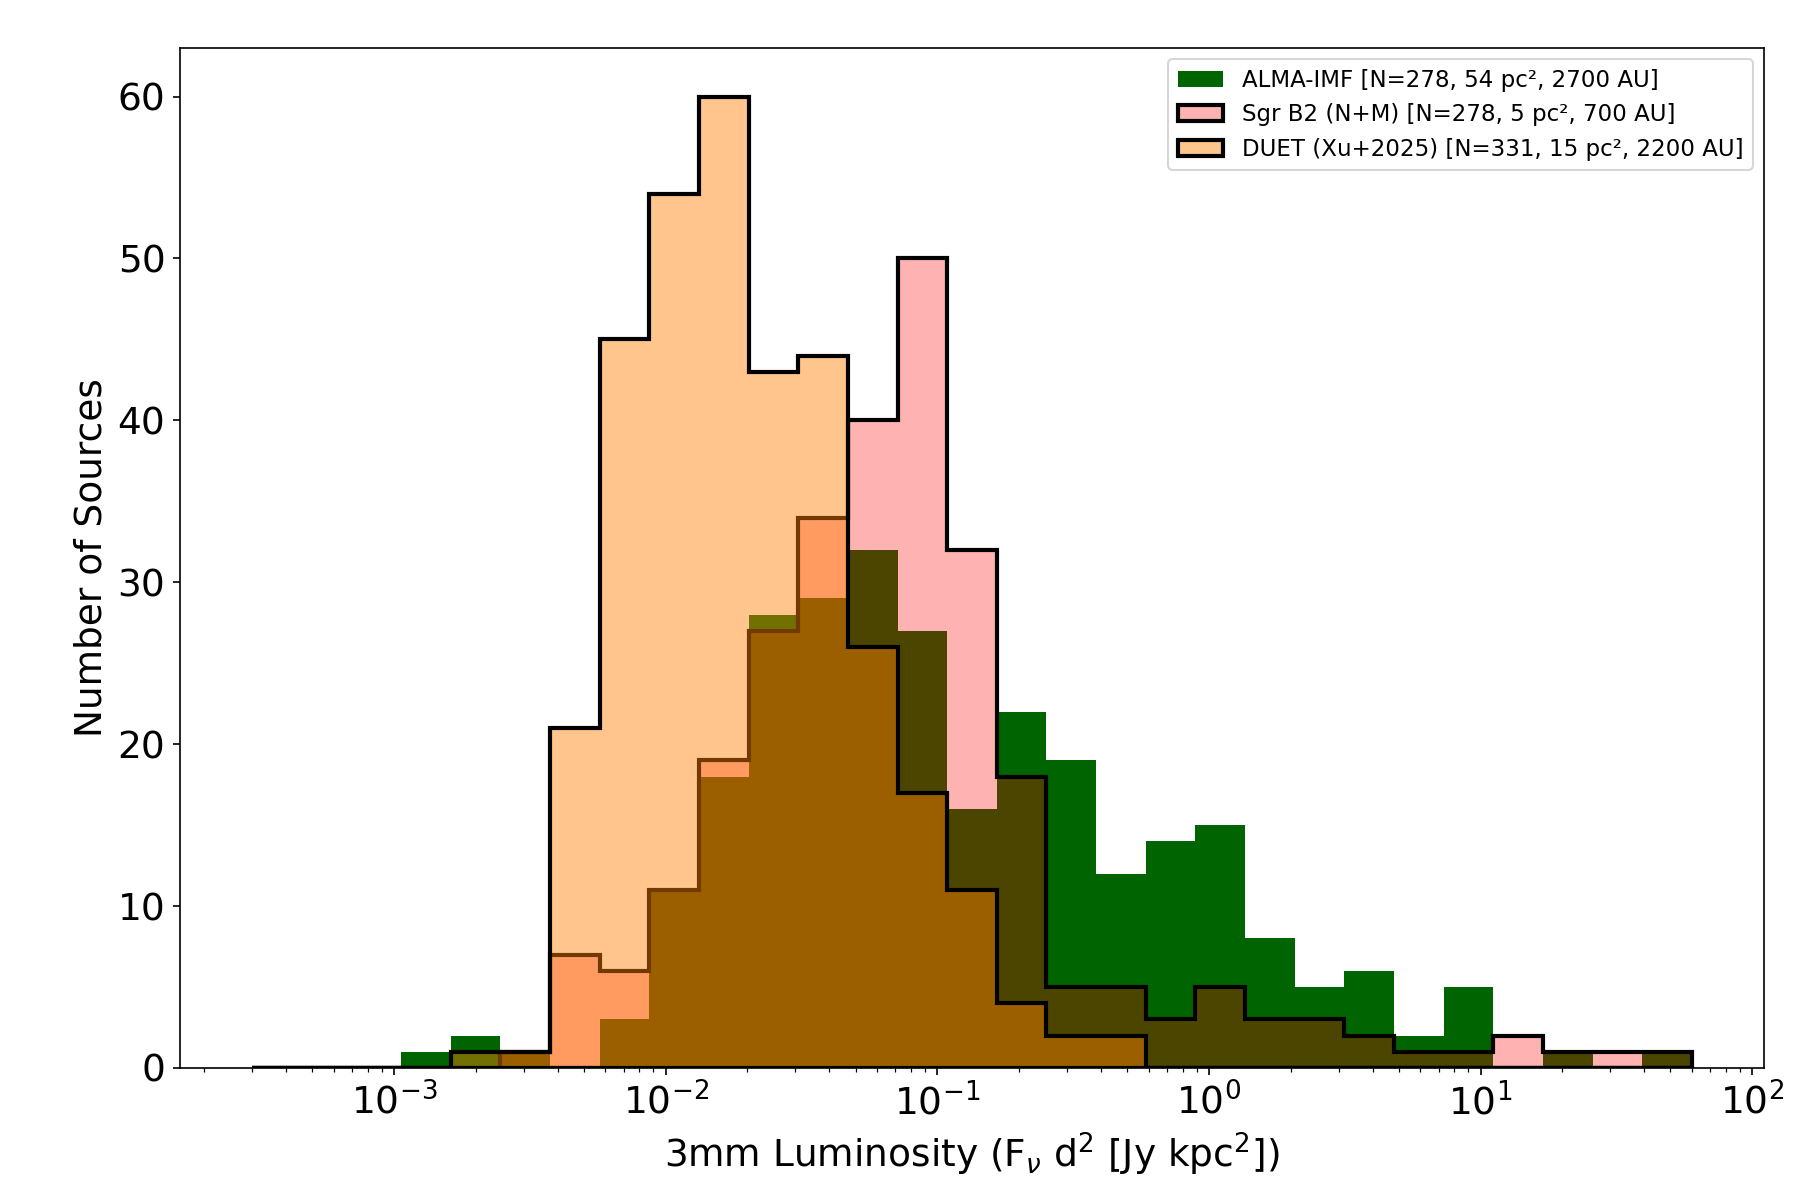
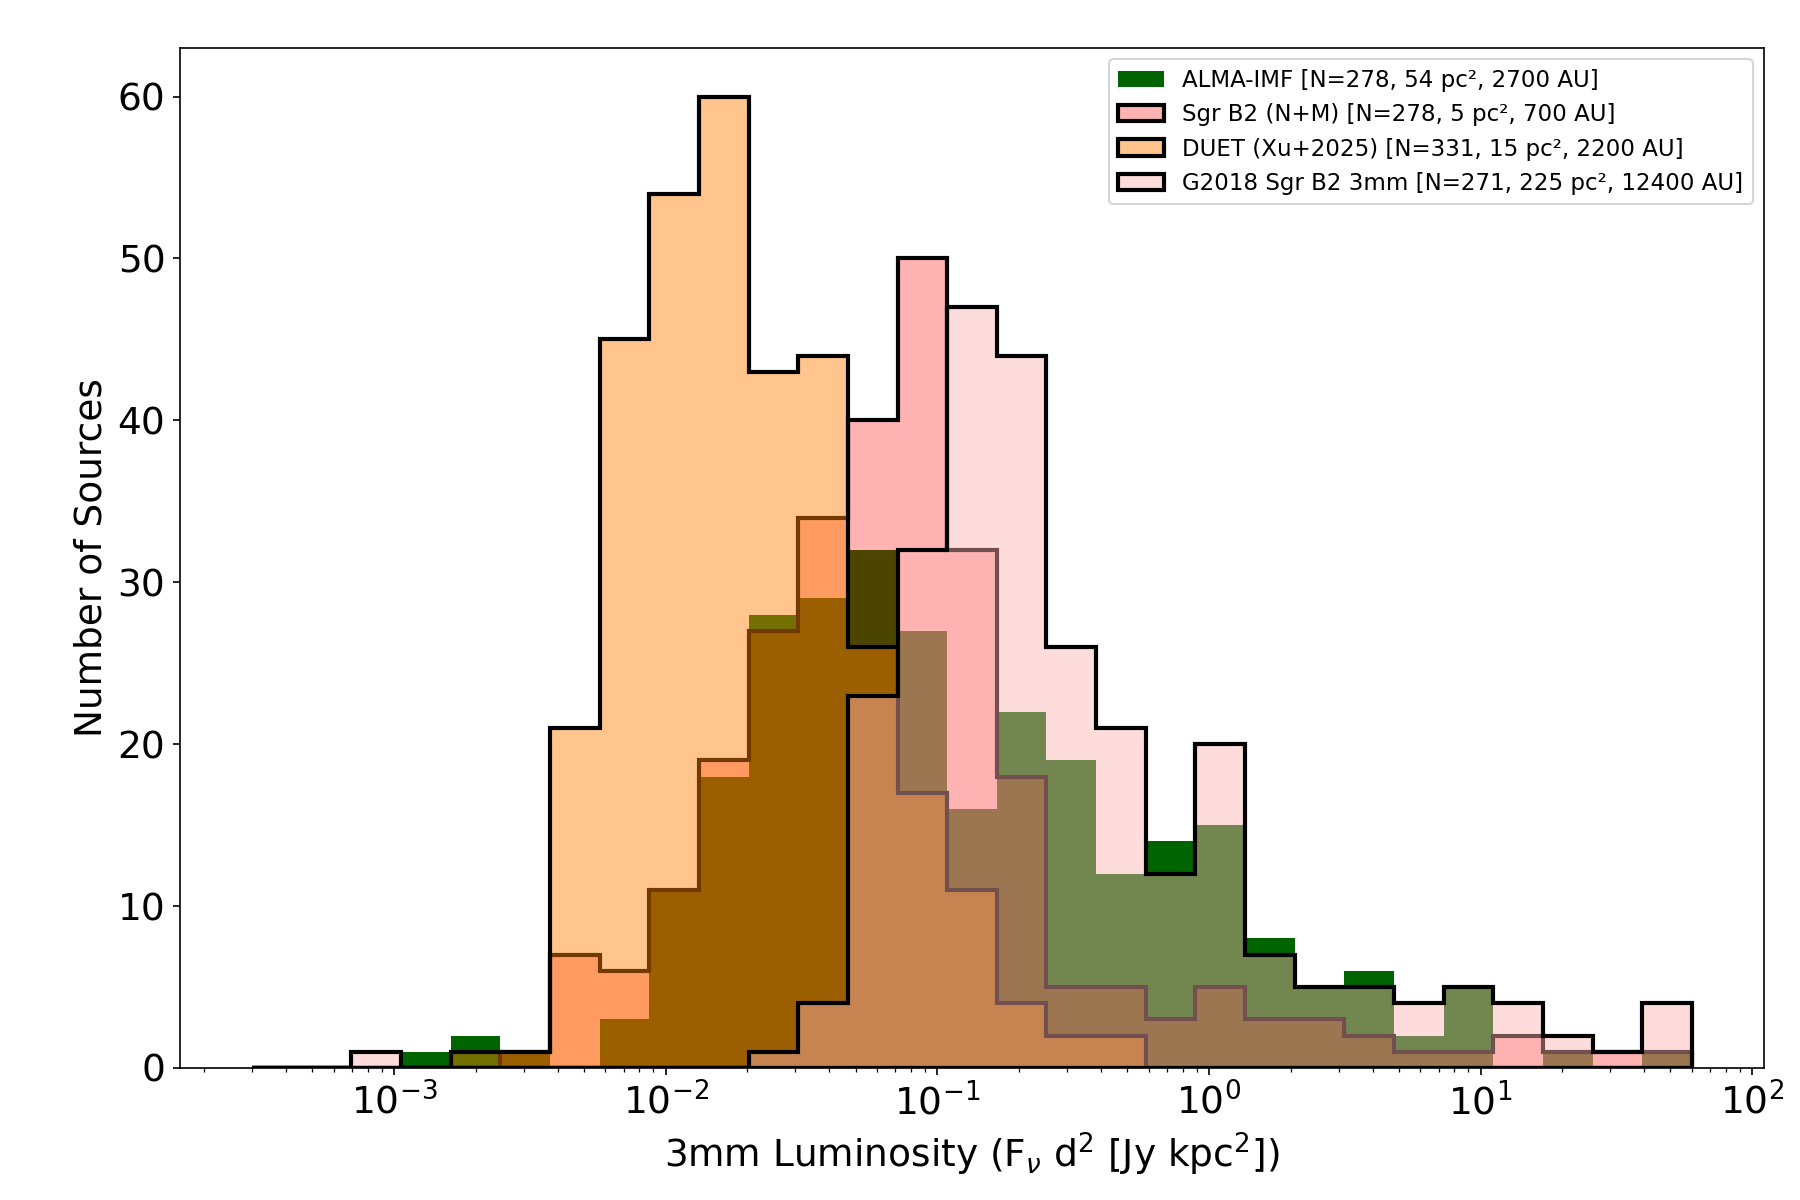
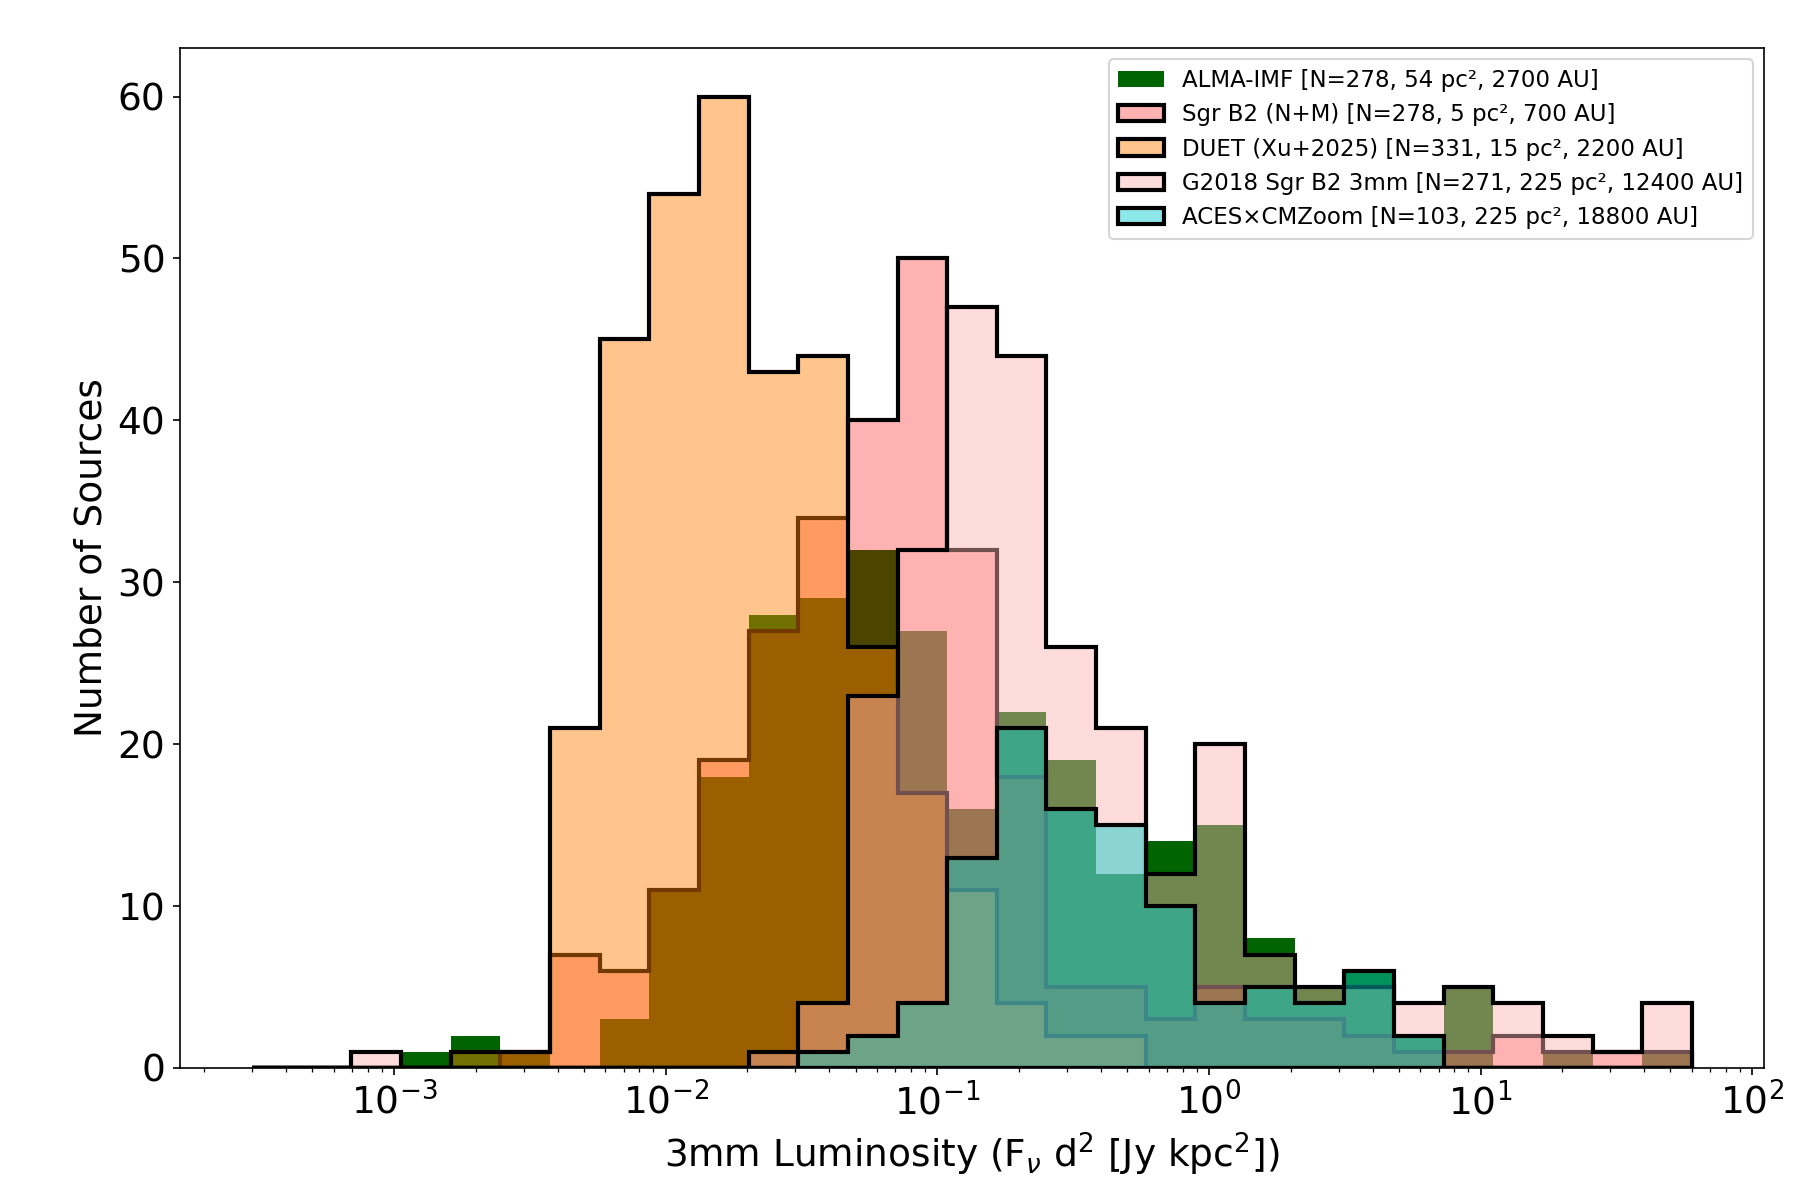


Distance-normalized 3 mm luminosities
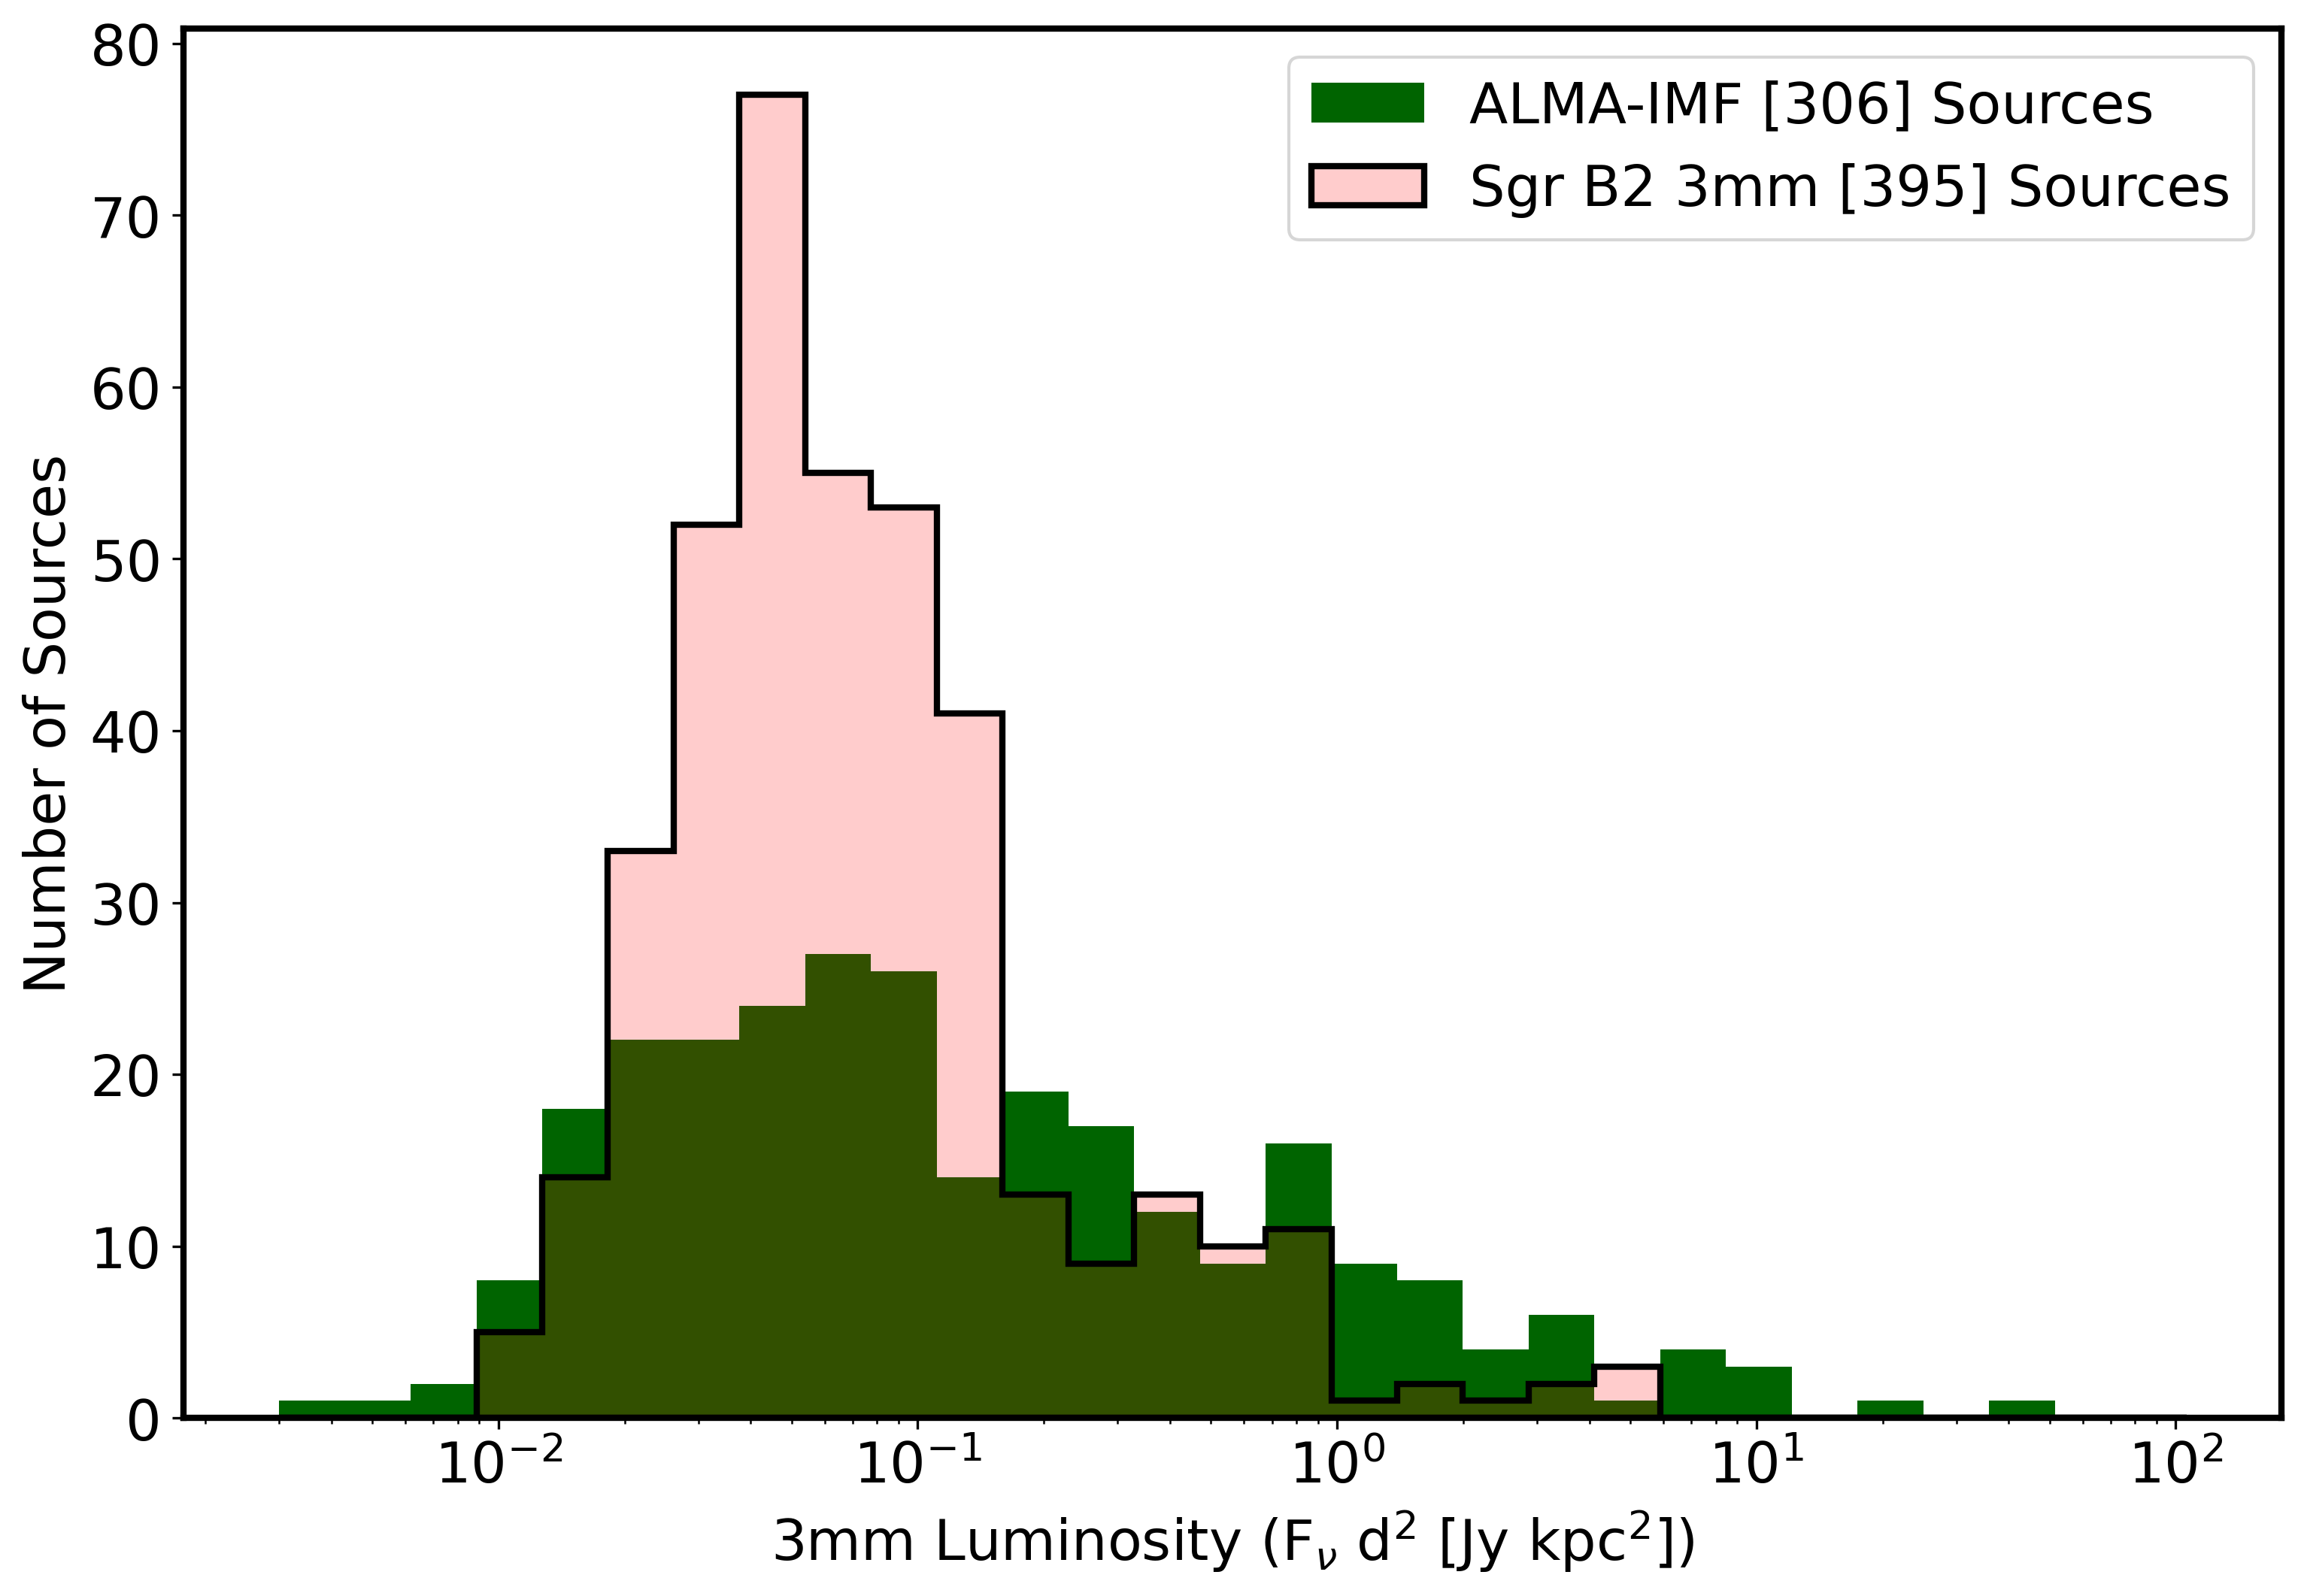
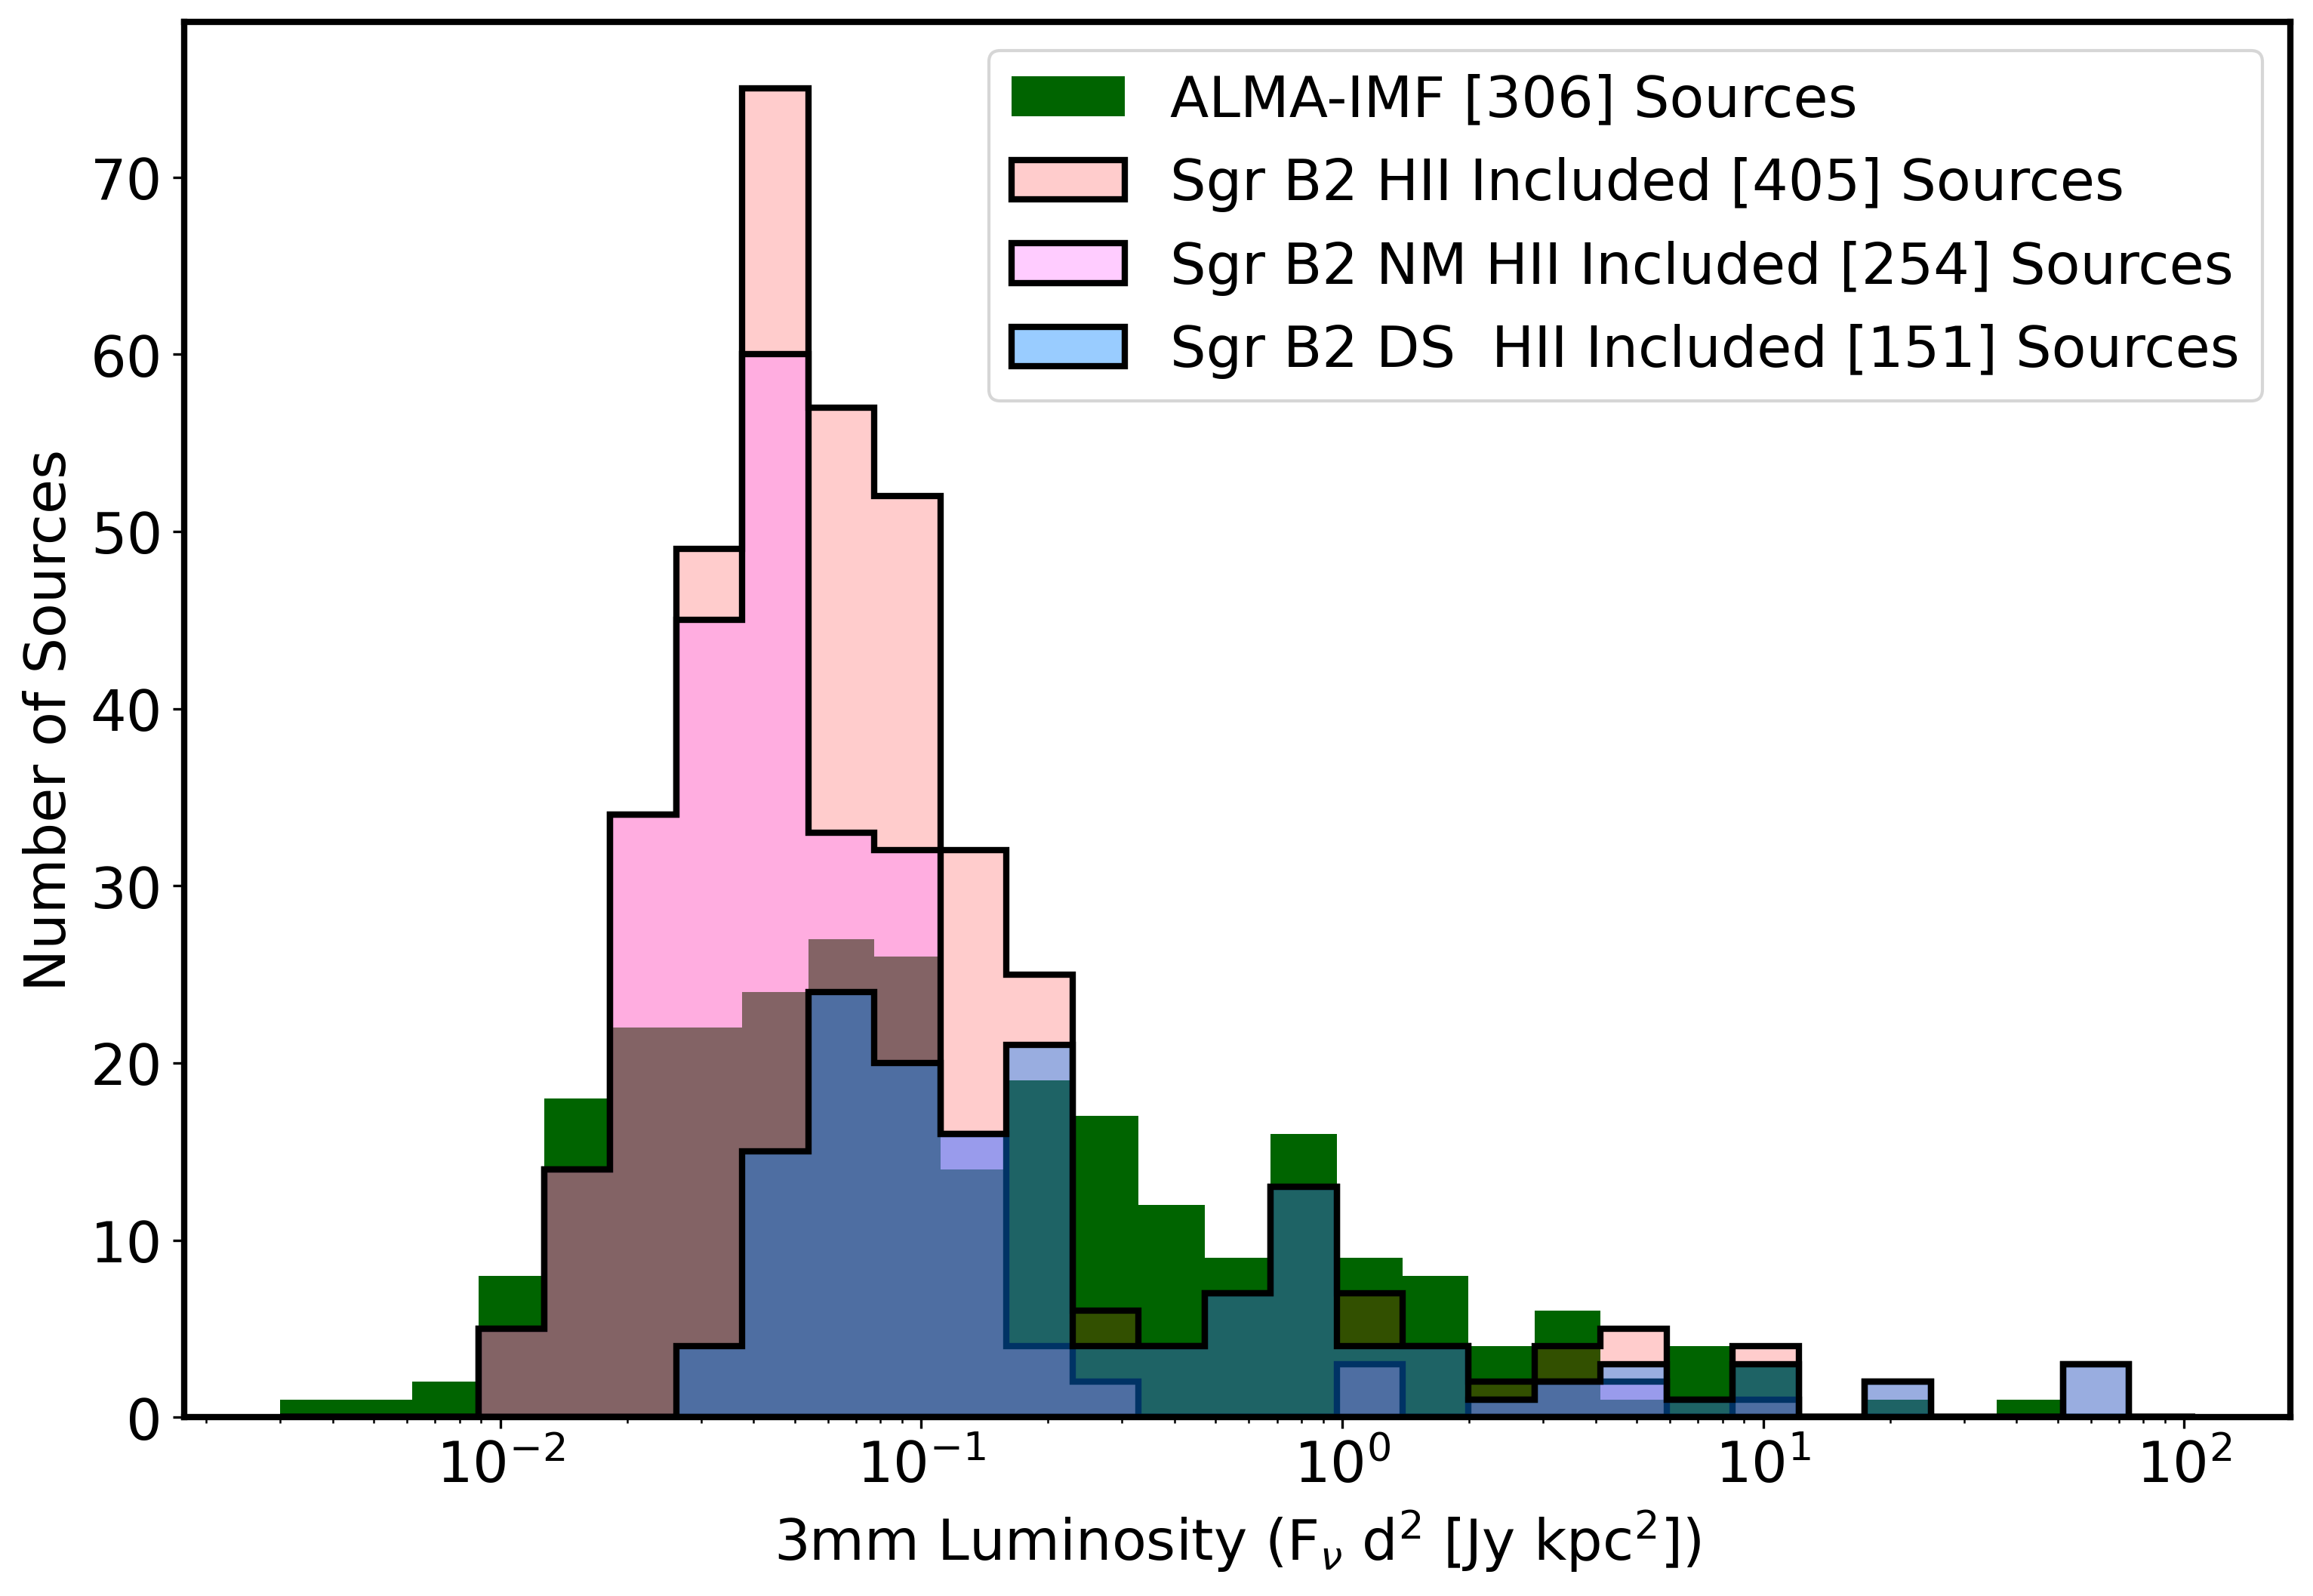
3 mm luminosities, now including HII regions in the Sgr B2 sample
3 mm luminosities, Sgr B2 split into its sub-regions (N+M vs DS)
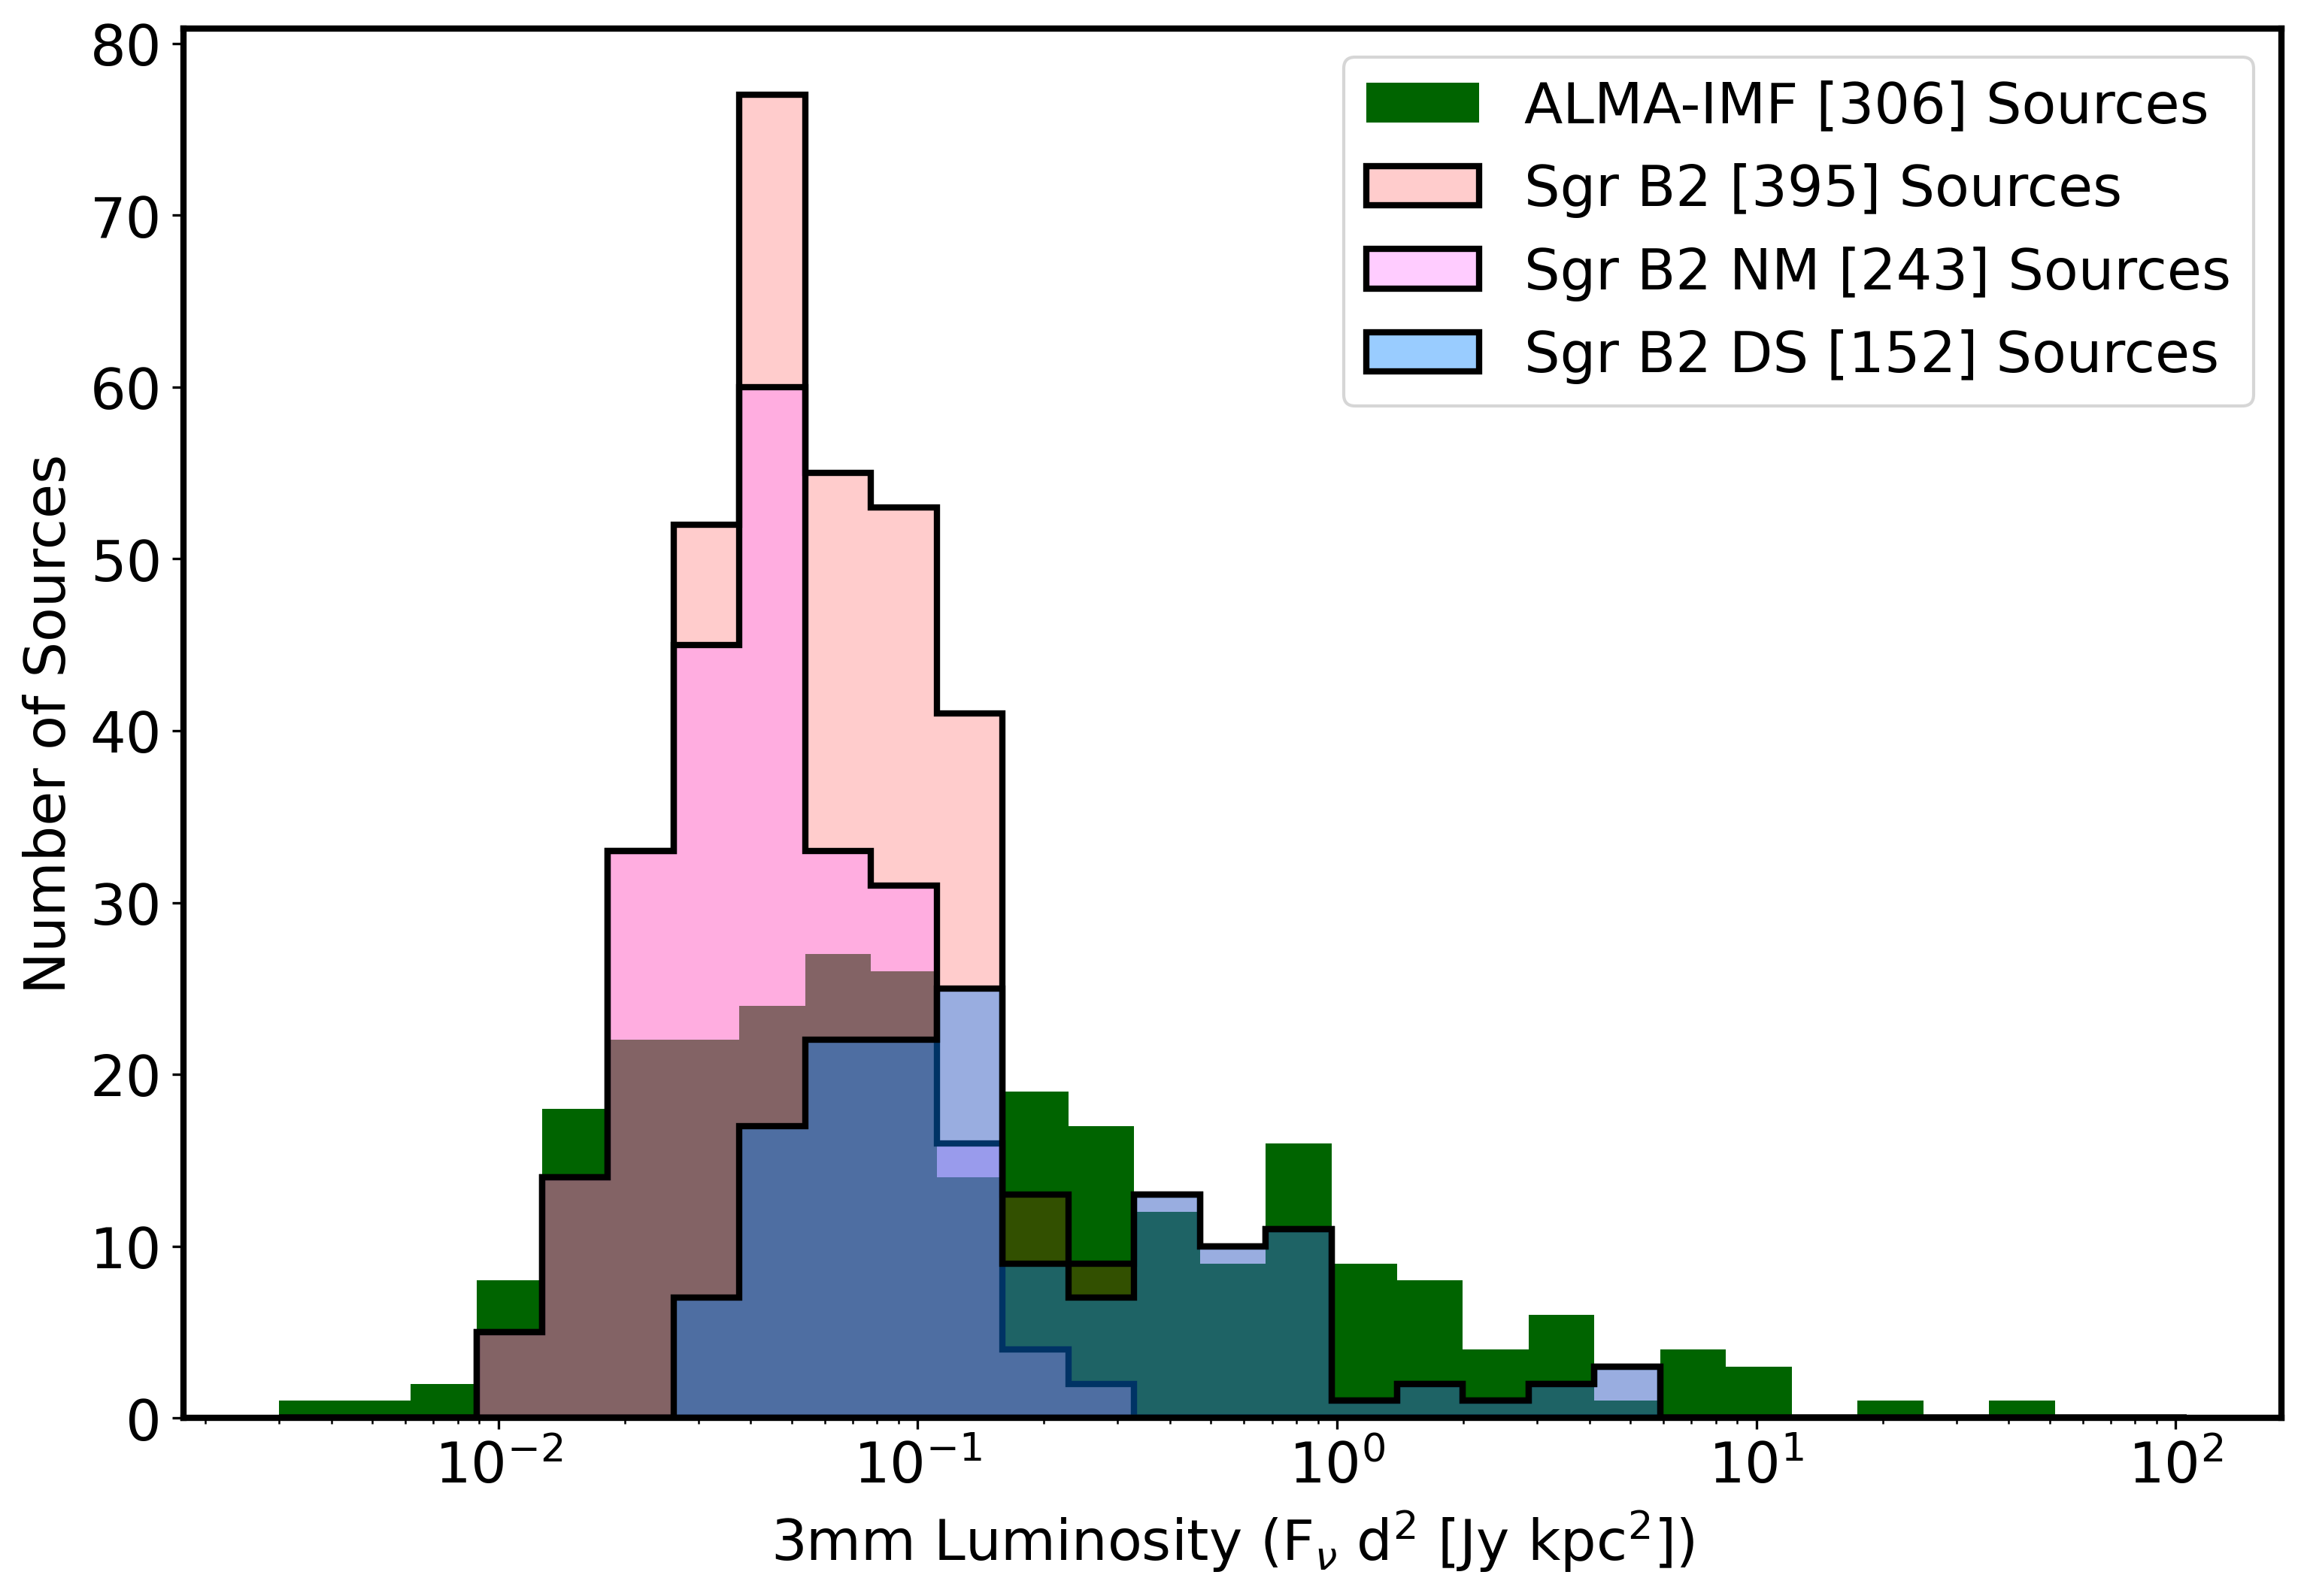
3 mm luminosities by sub-region, HII regions included
1 mm core luminosity functions
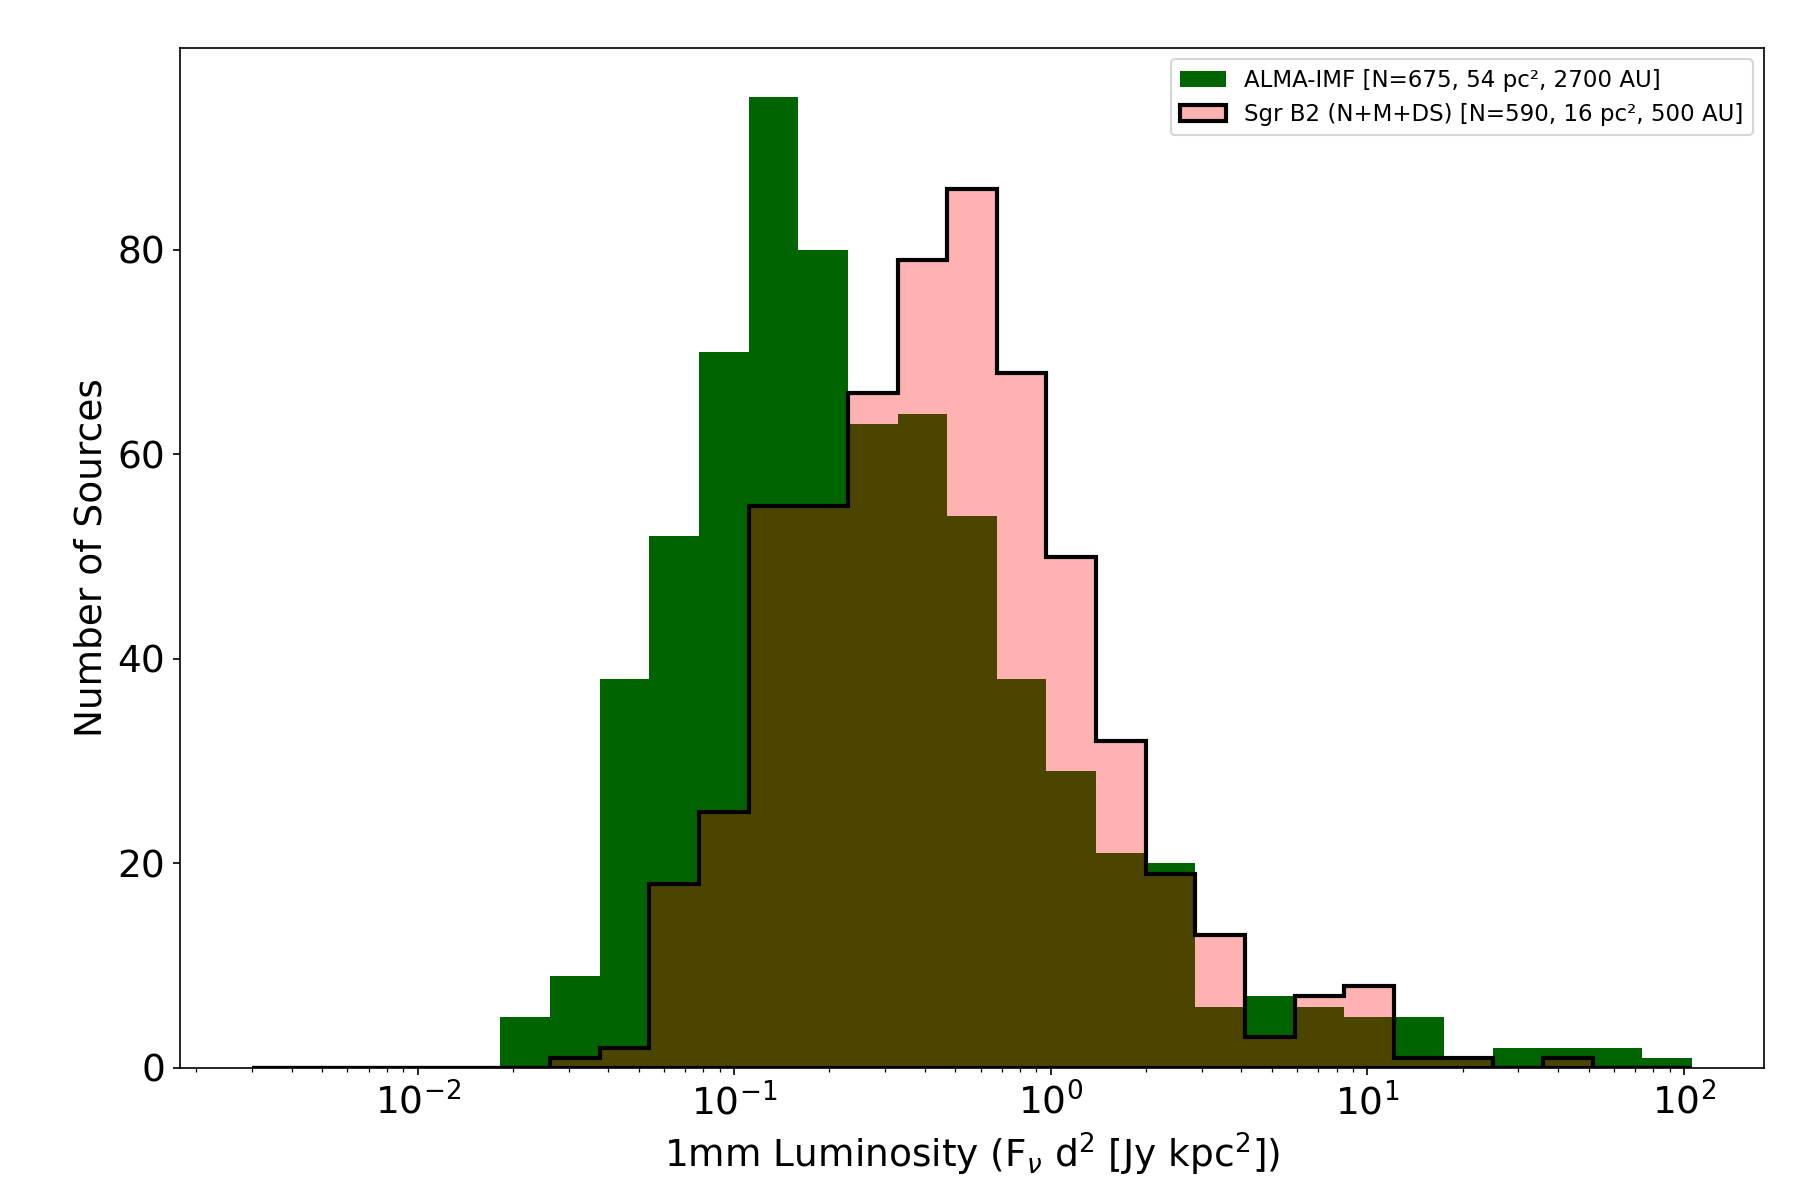
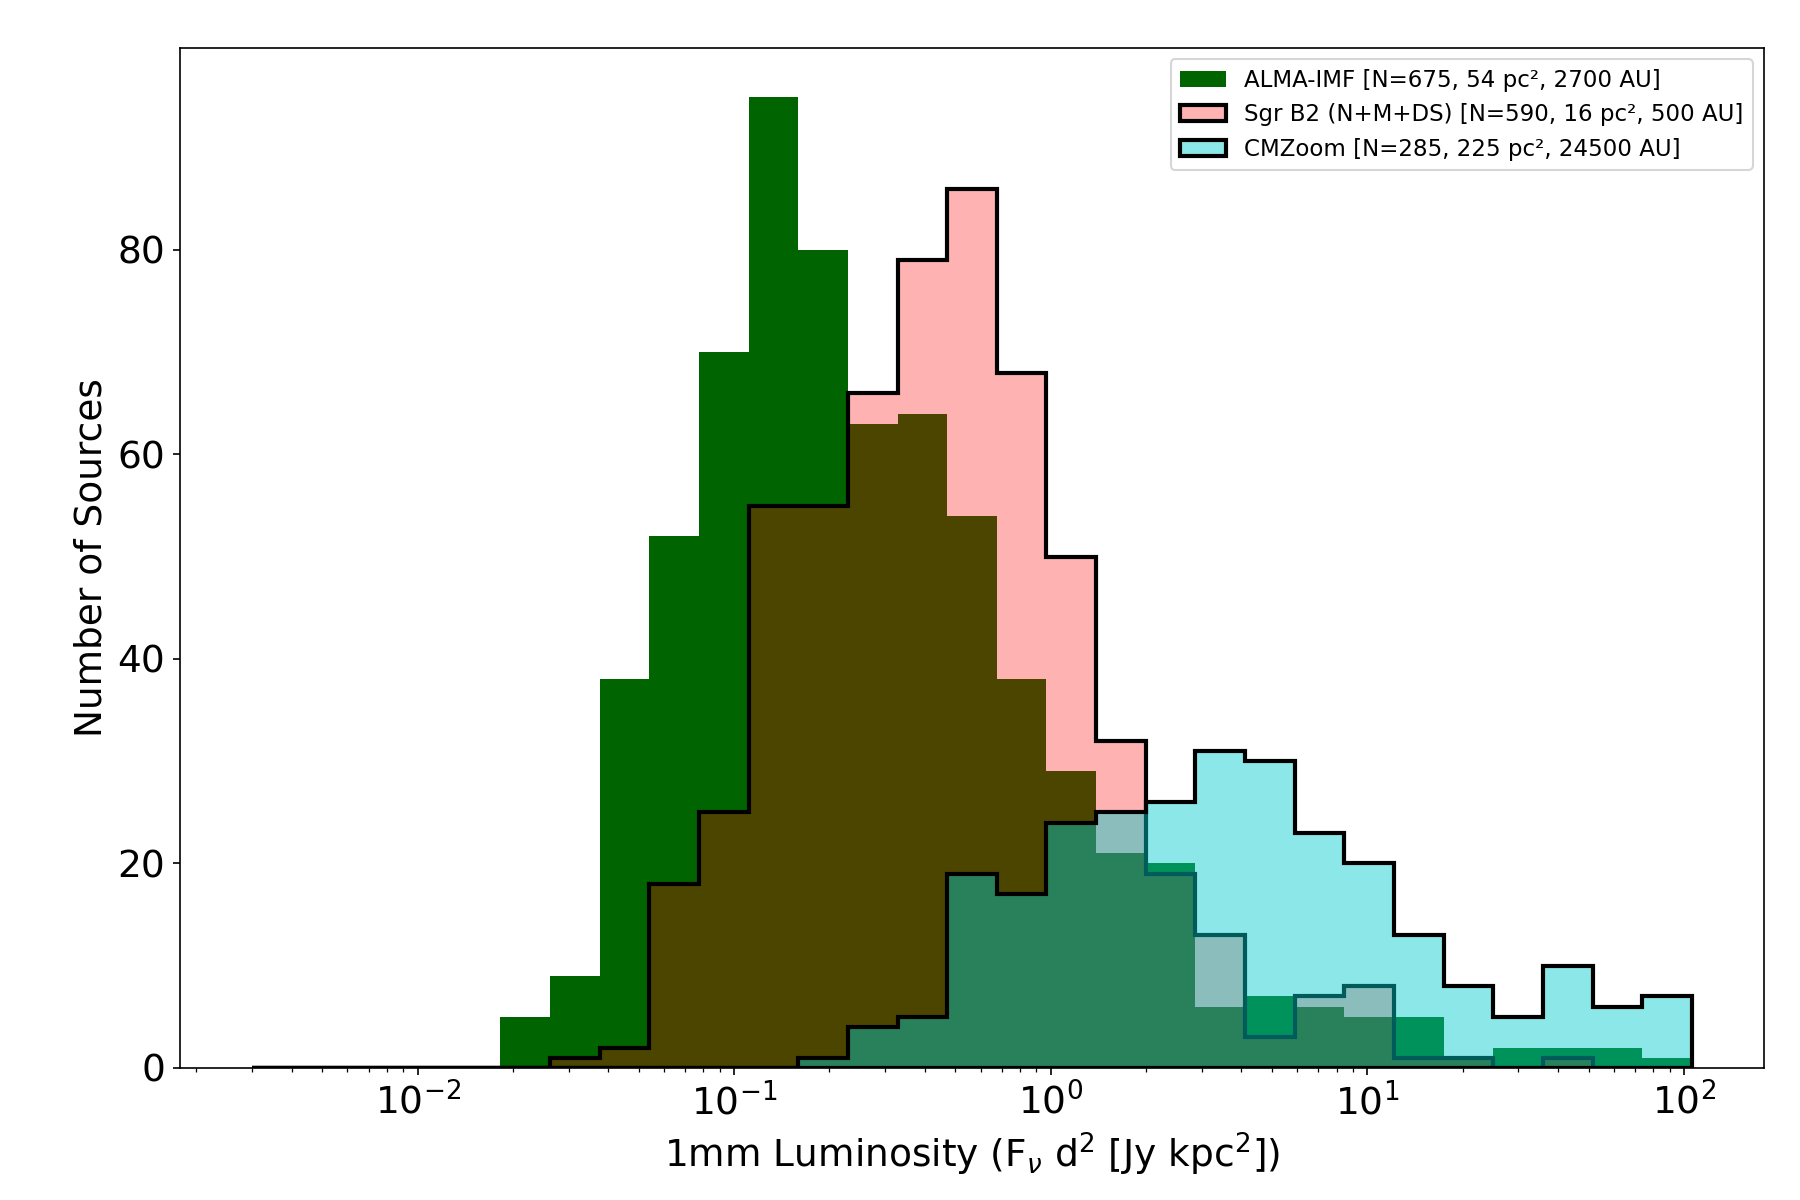
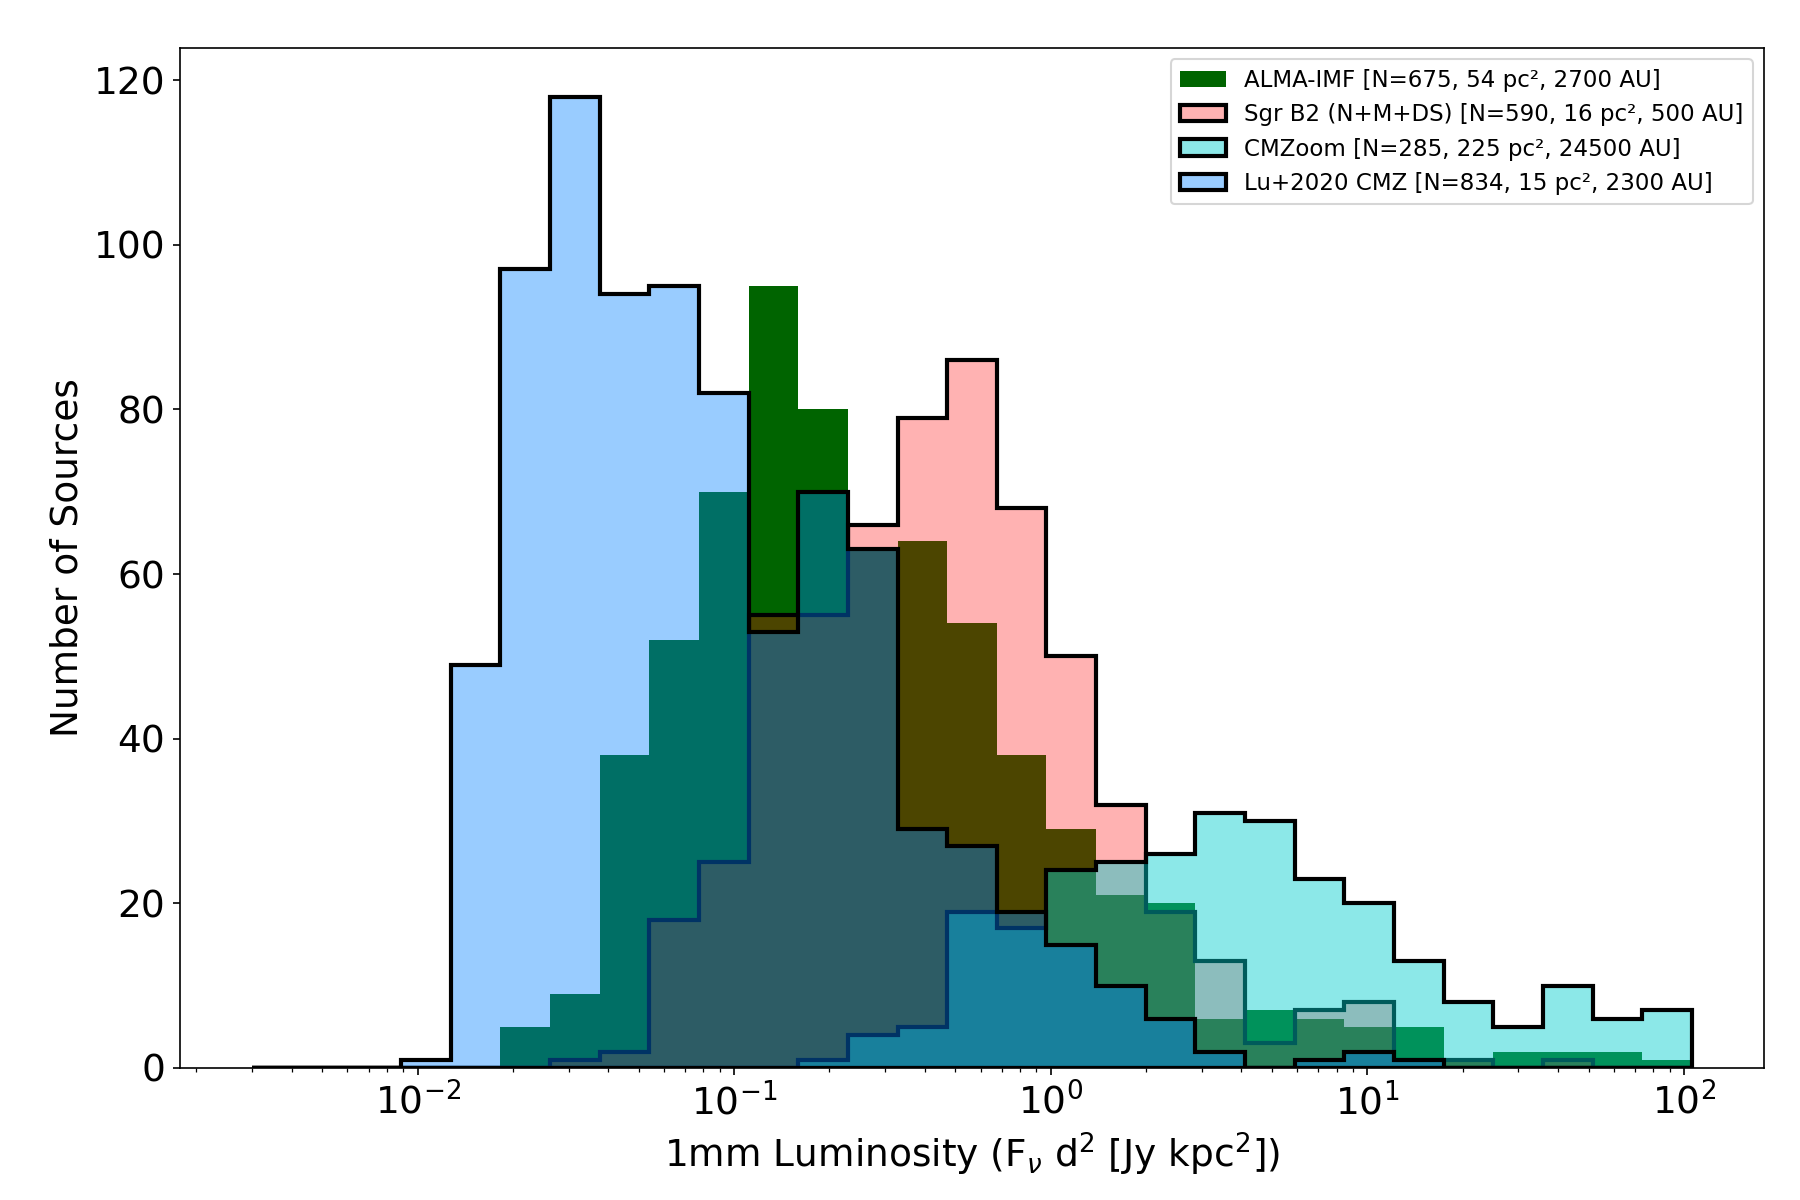
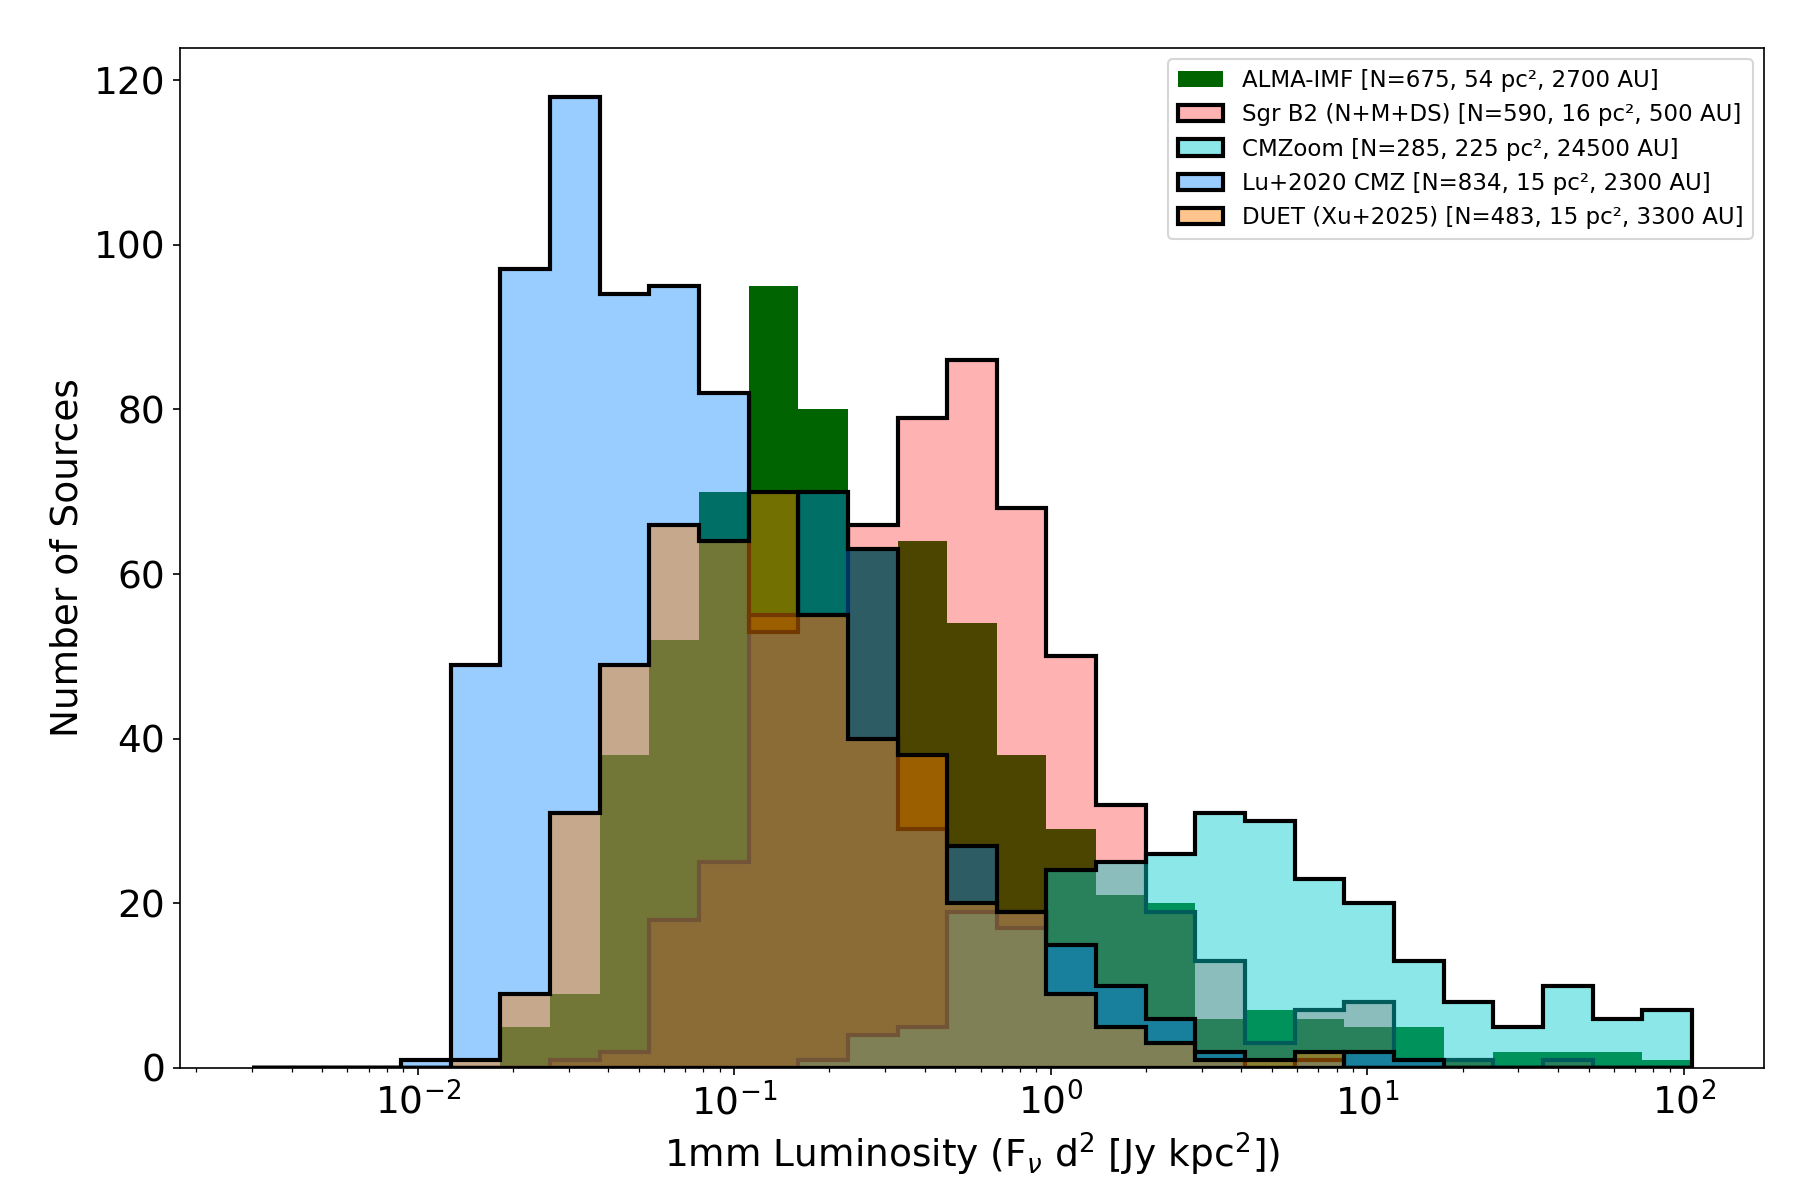
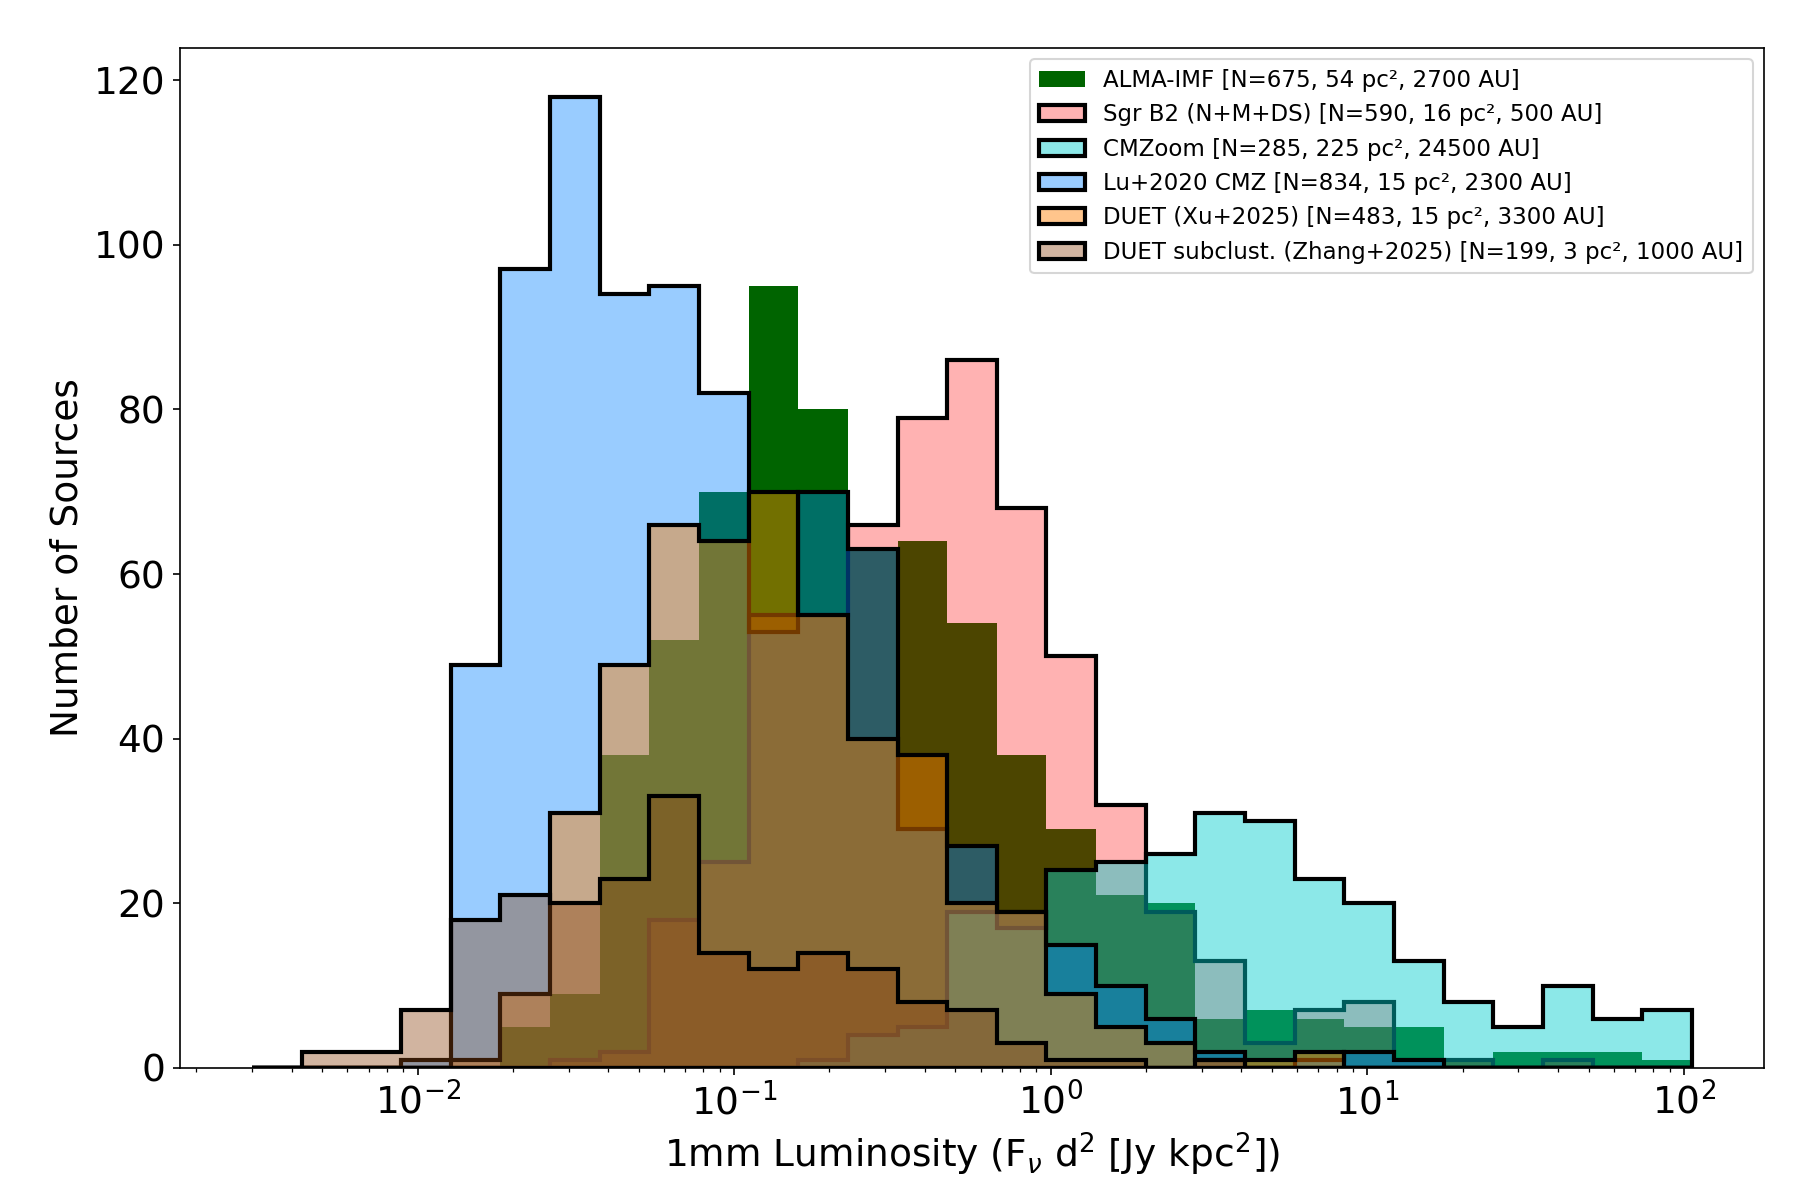
Distance-normalized 1 mm luminosities
1 mm luminosities, including HII regions in the Sgr B2 sample

1 mm luminosities, Sgr B2 split into its sub-regions (DS vs N+M)
1 mm luminosities by sub-region, HII regions included
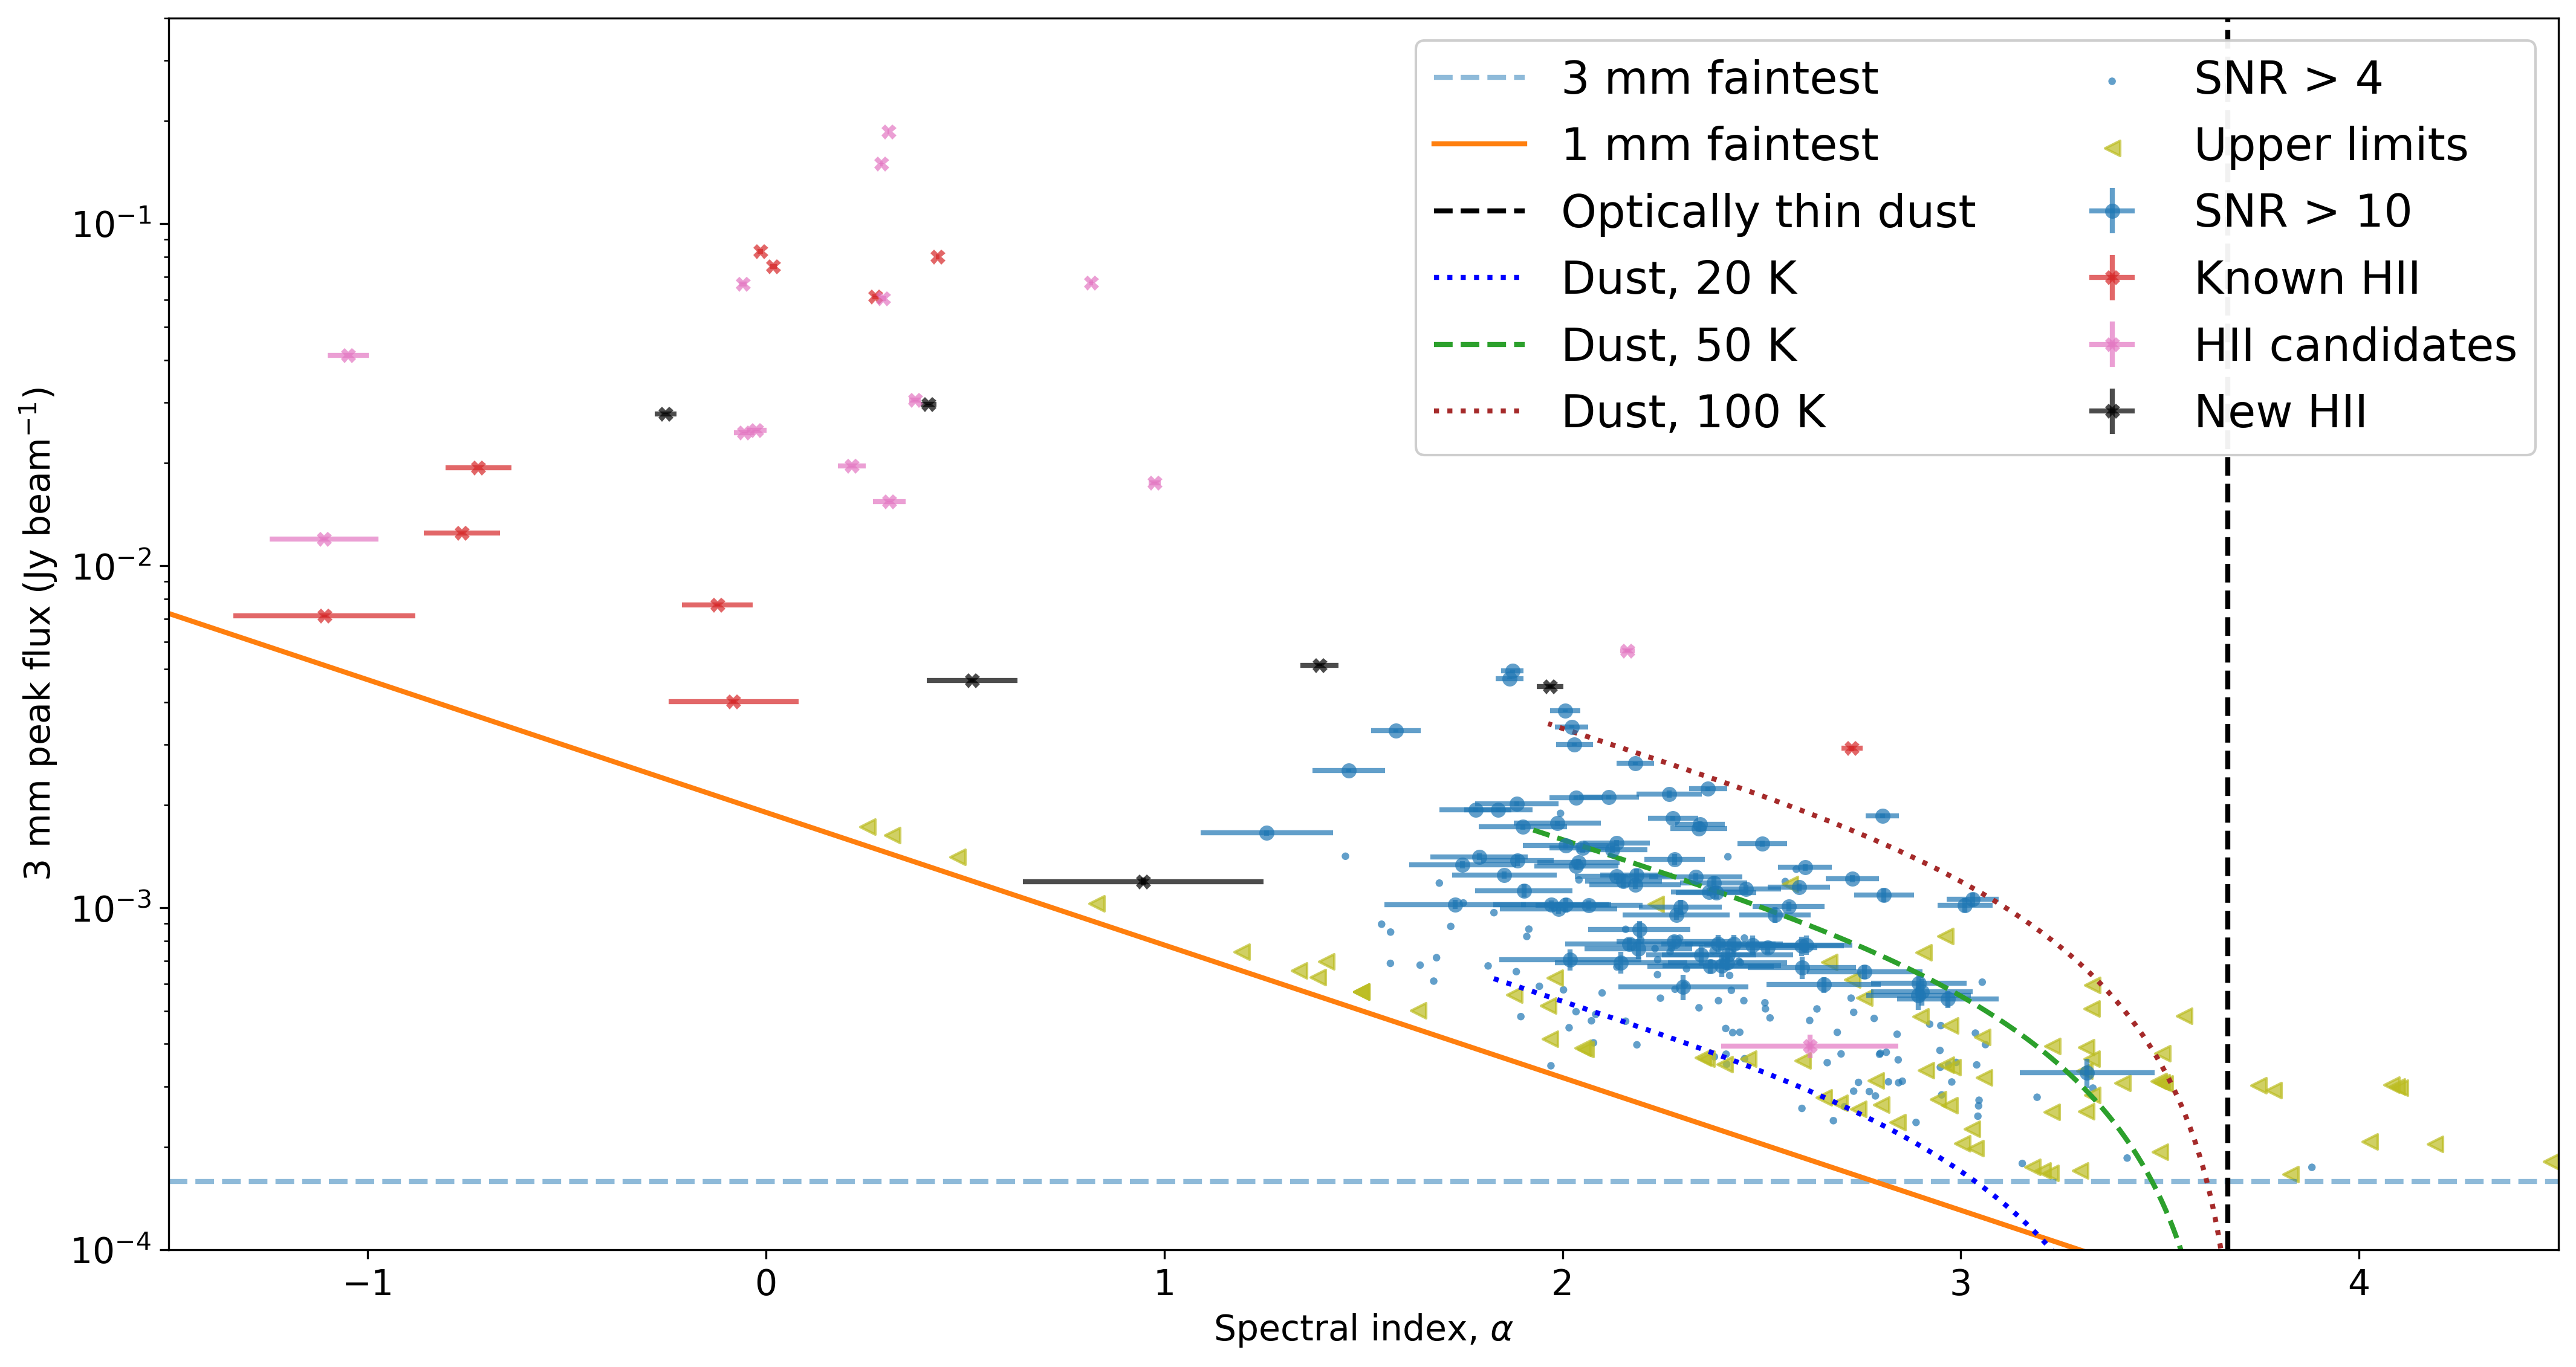
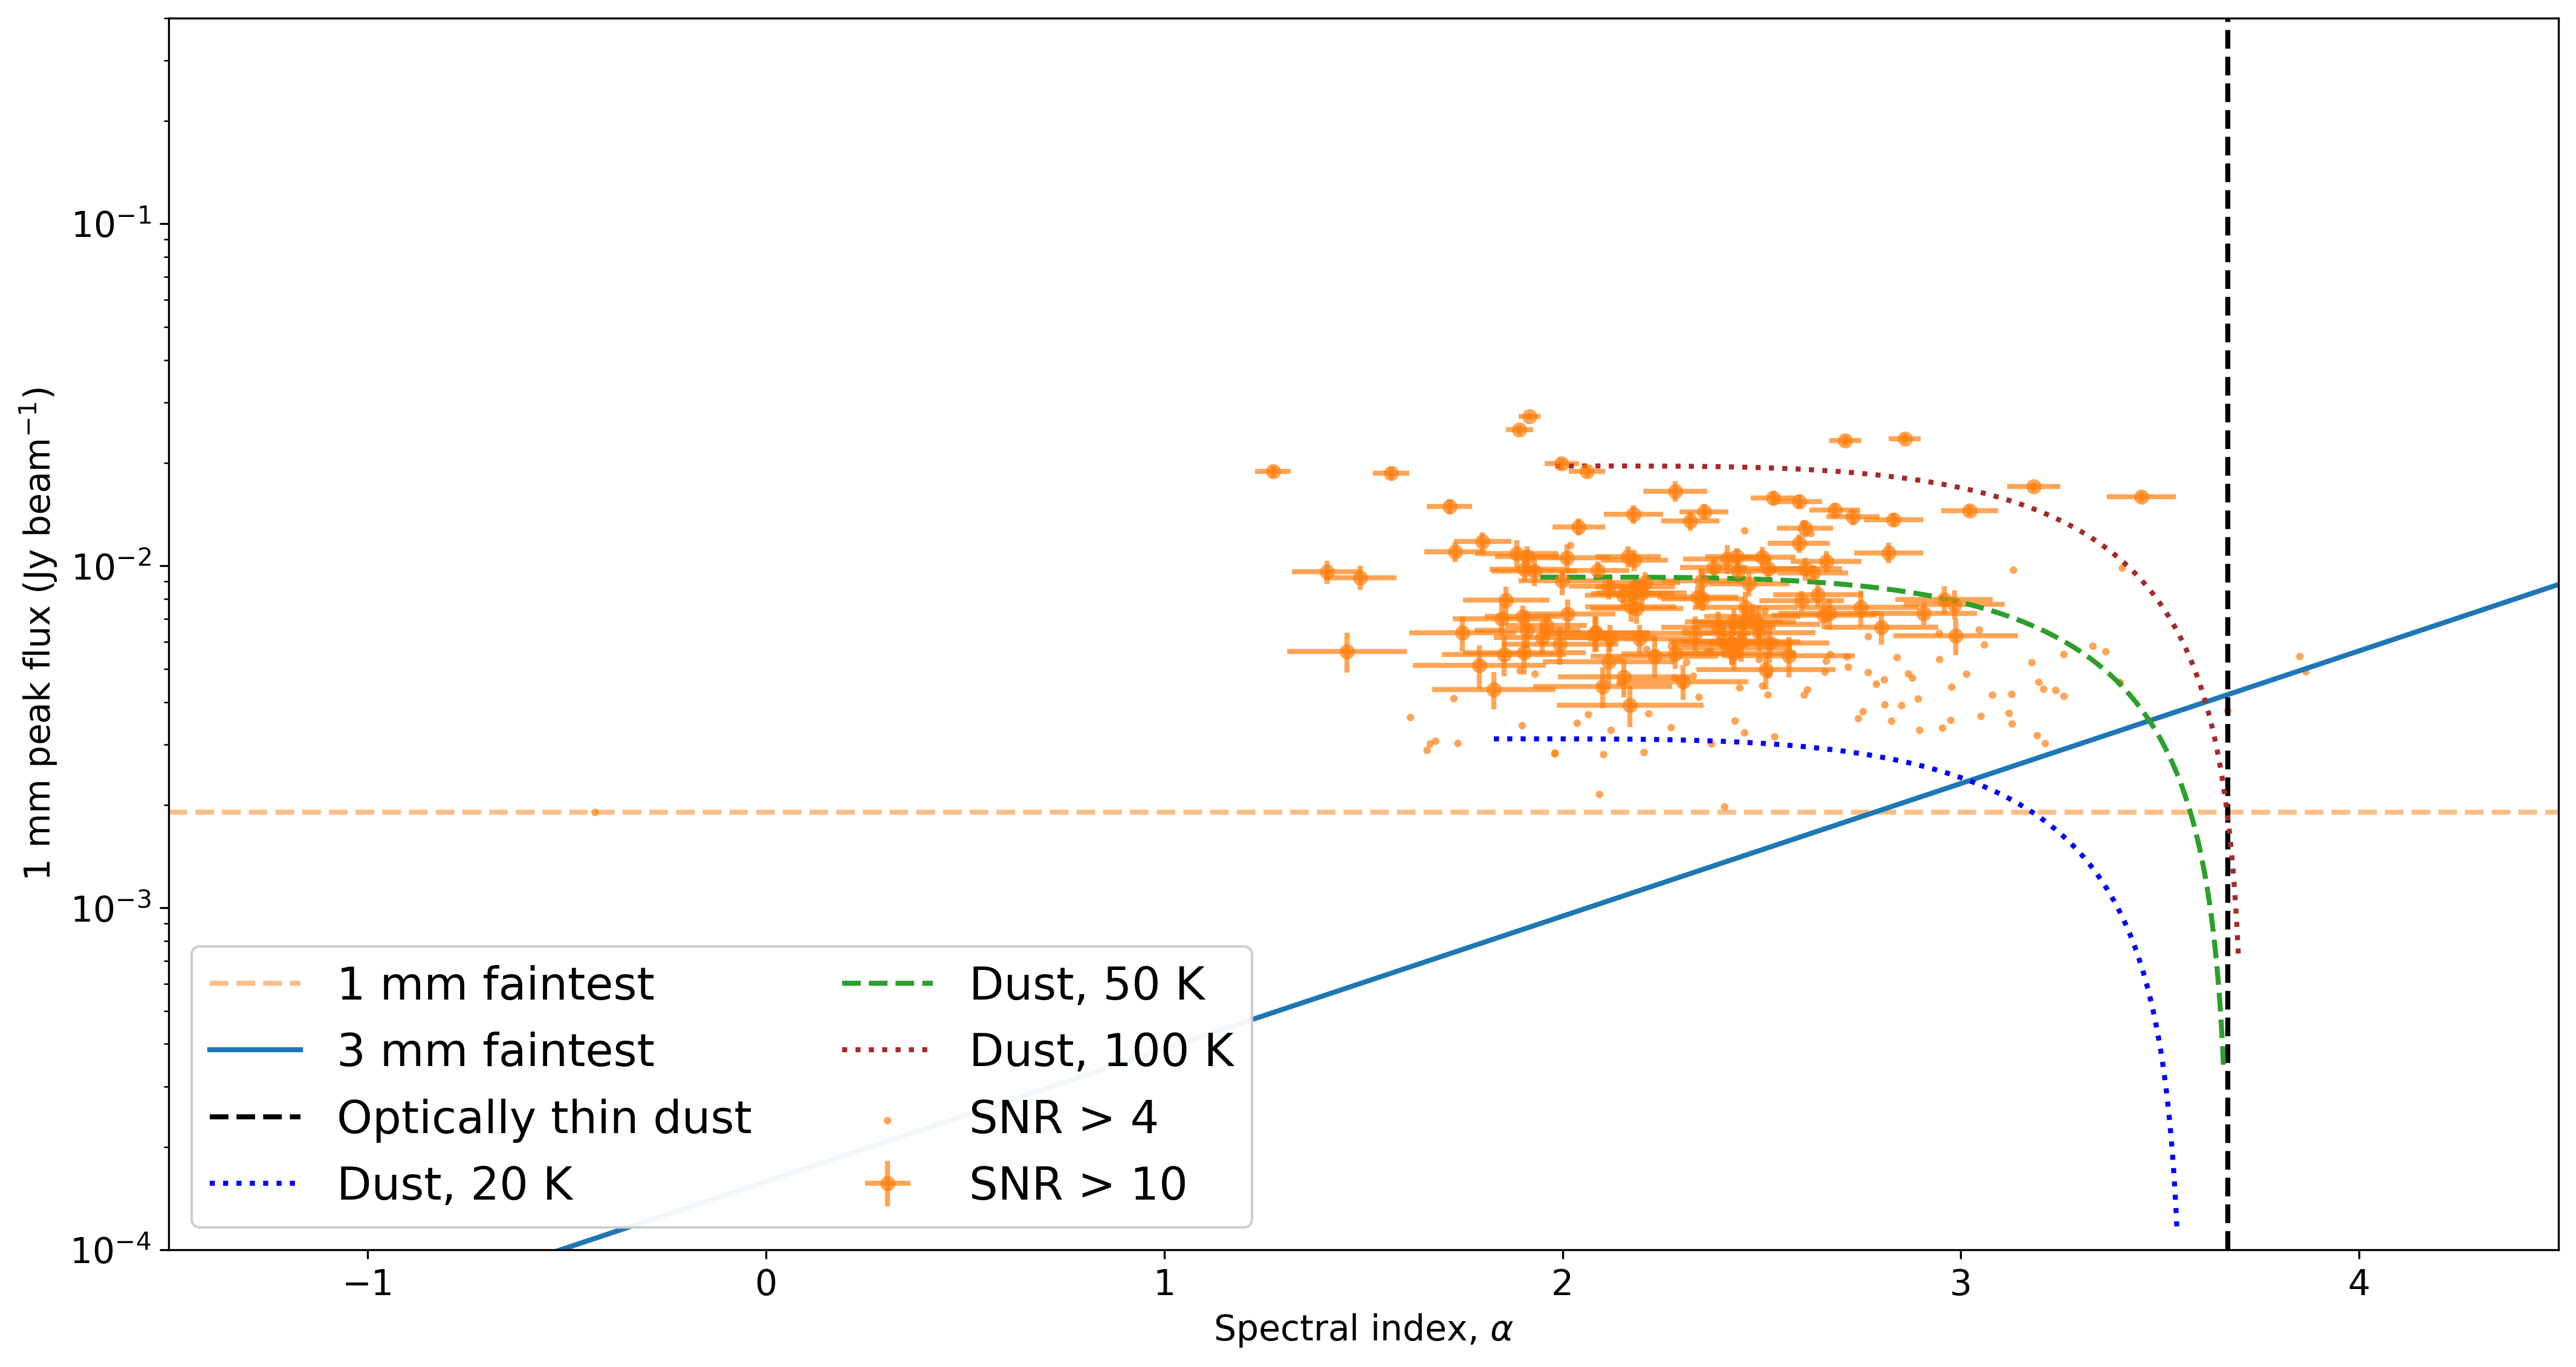
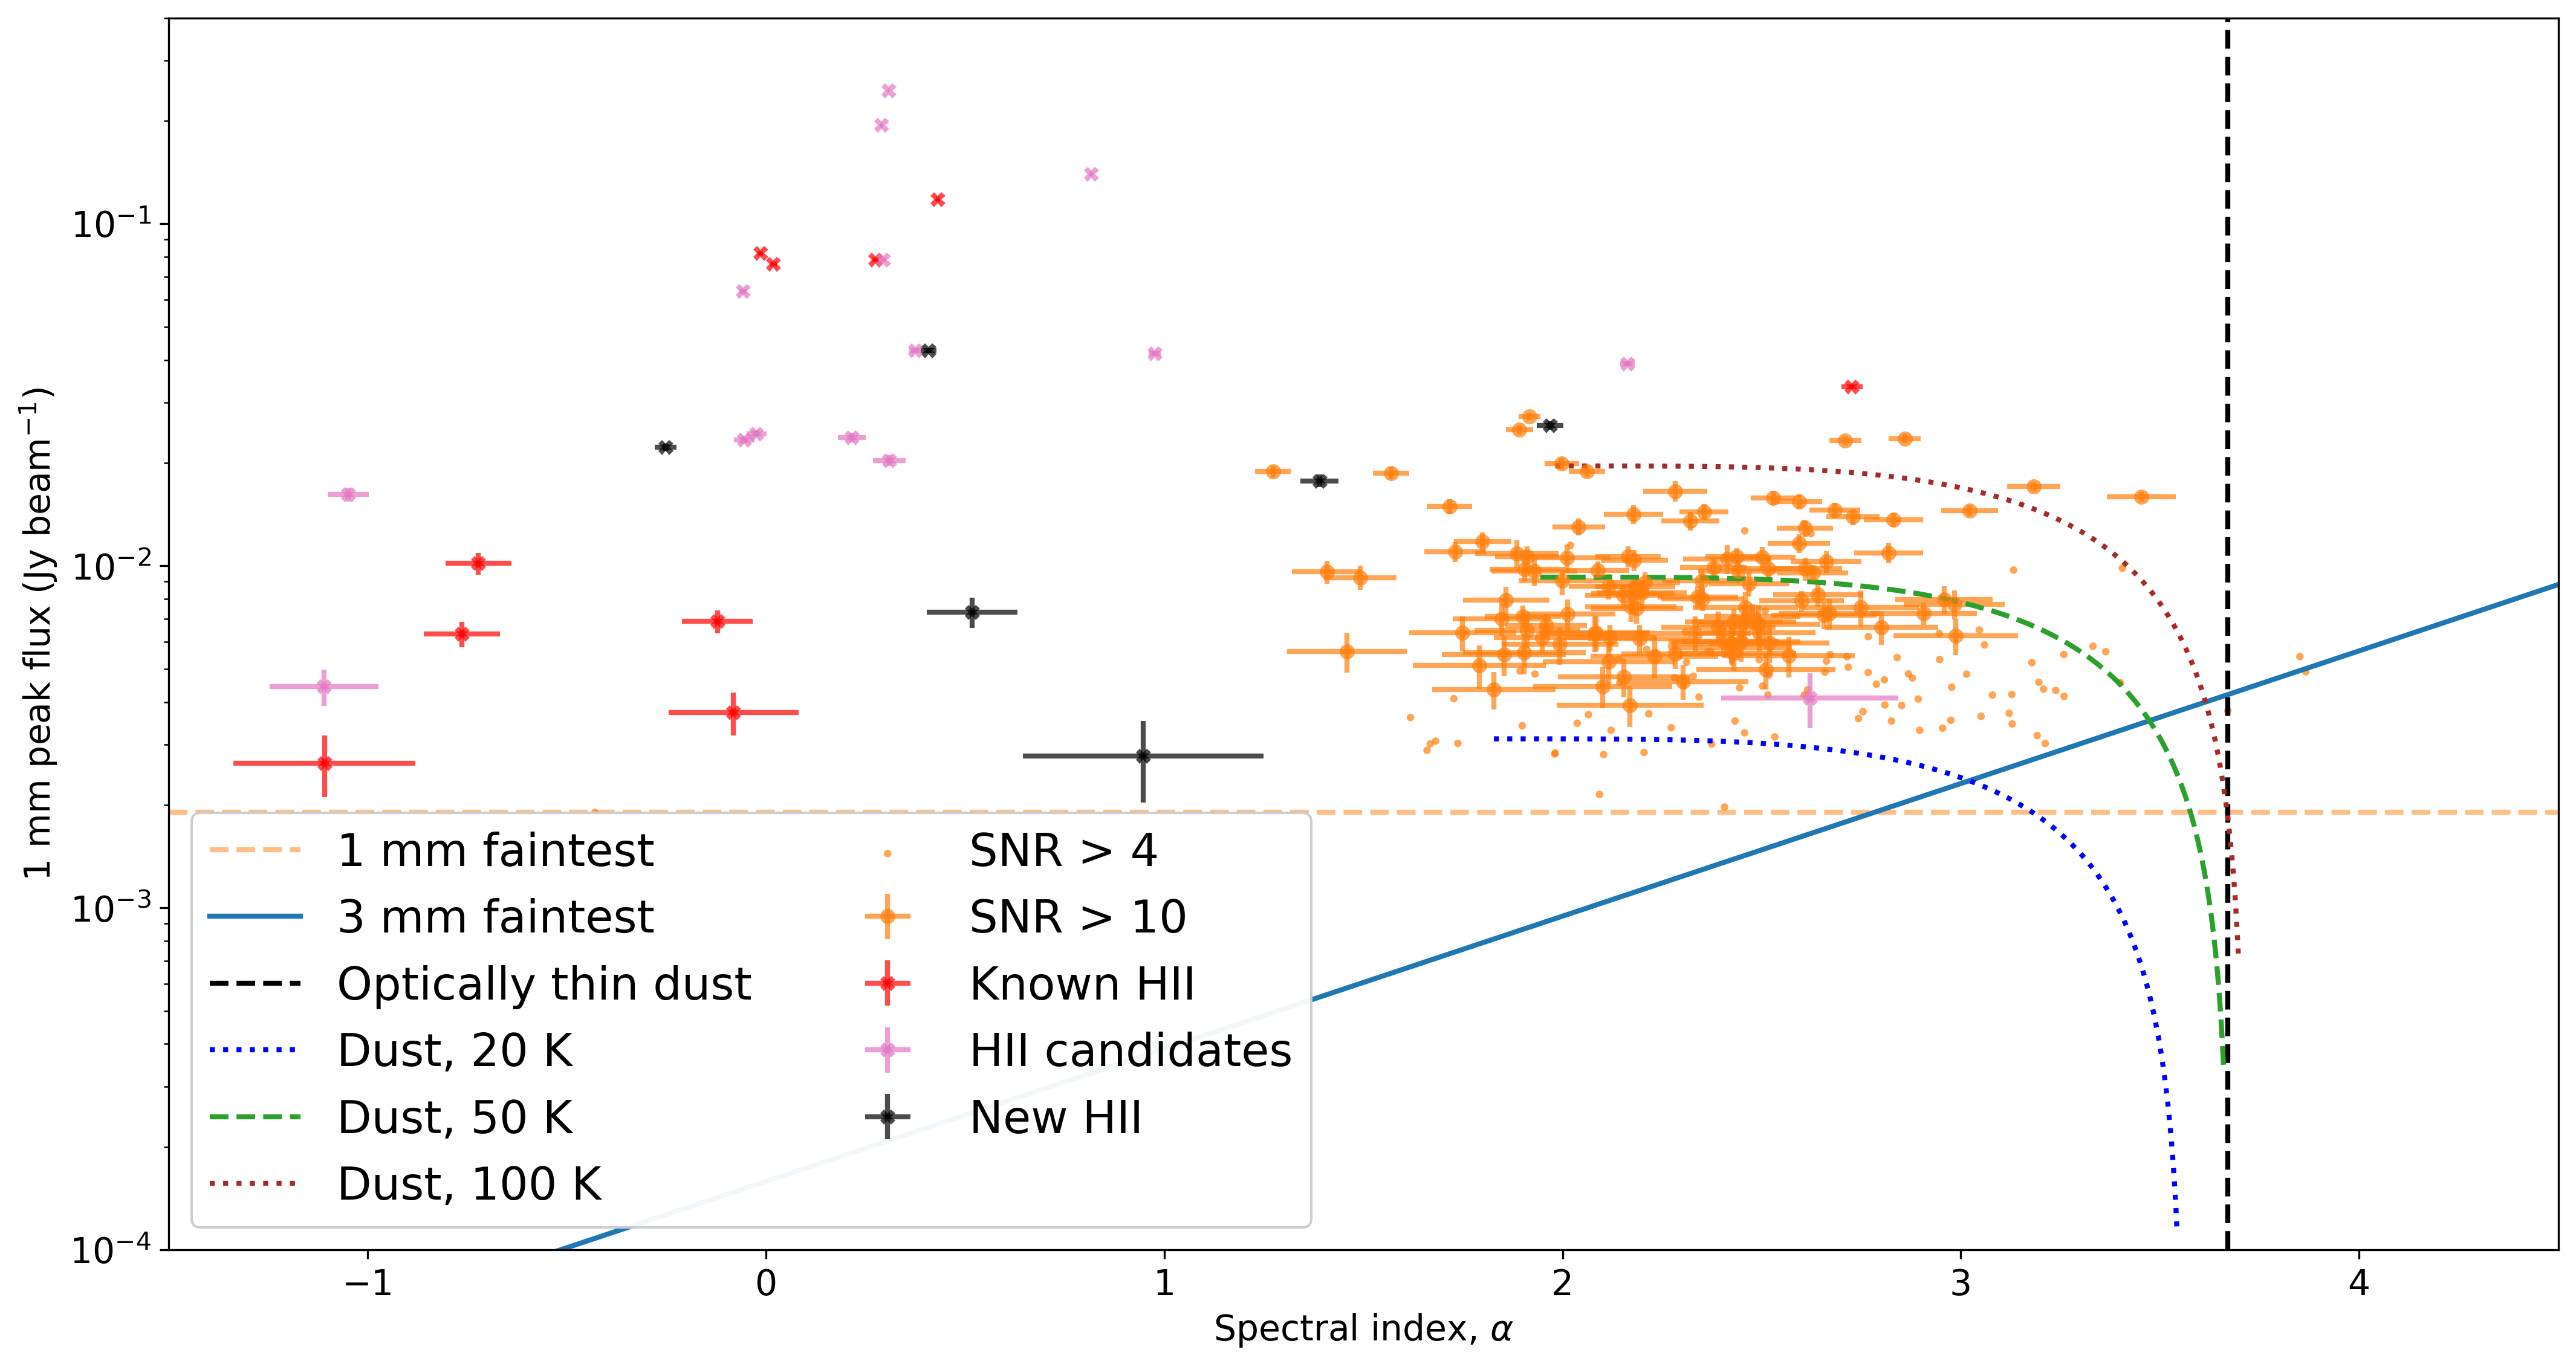
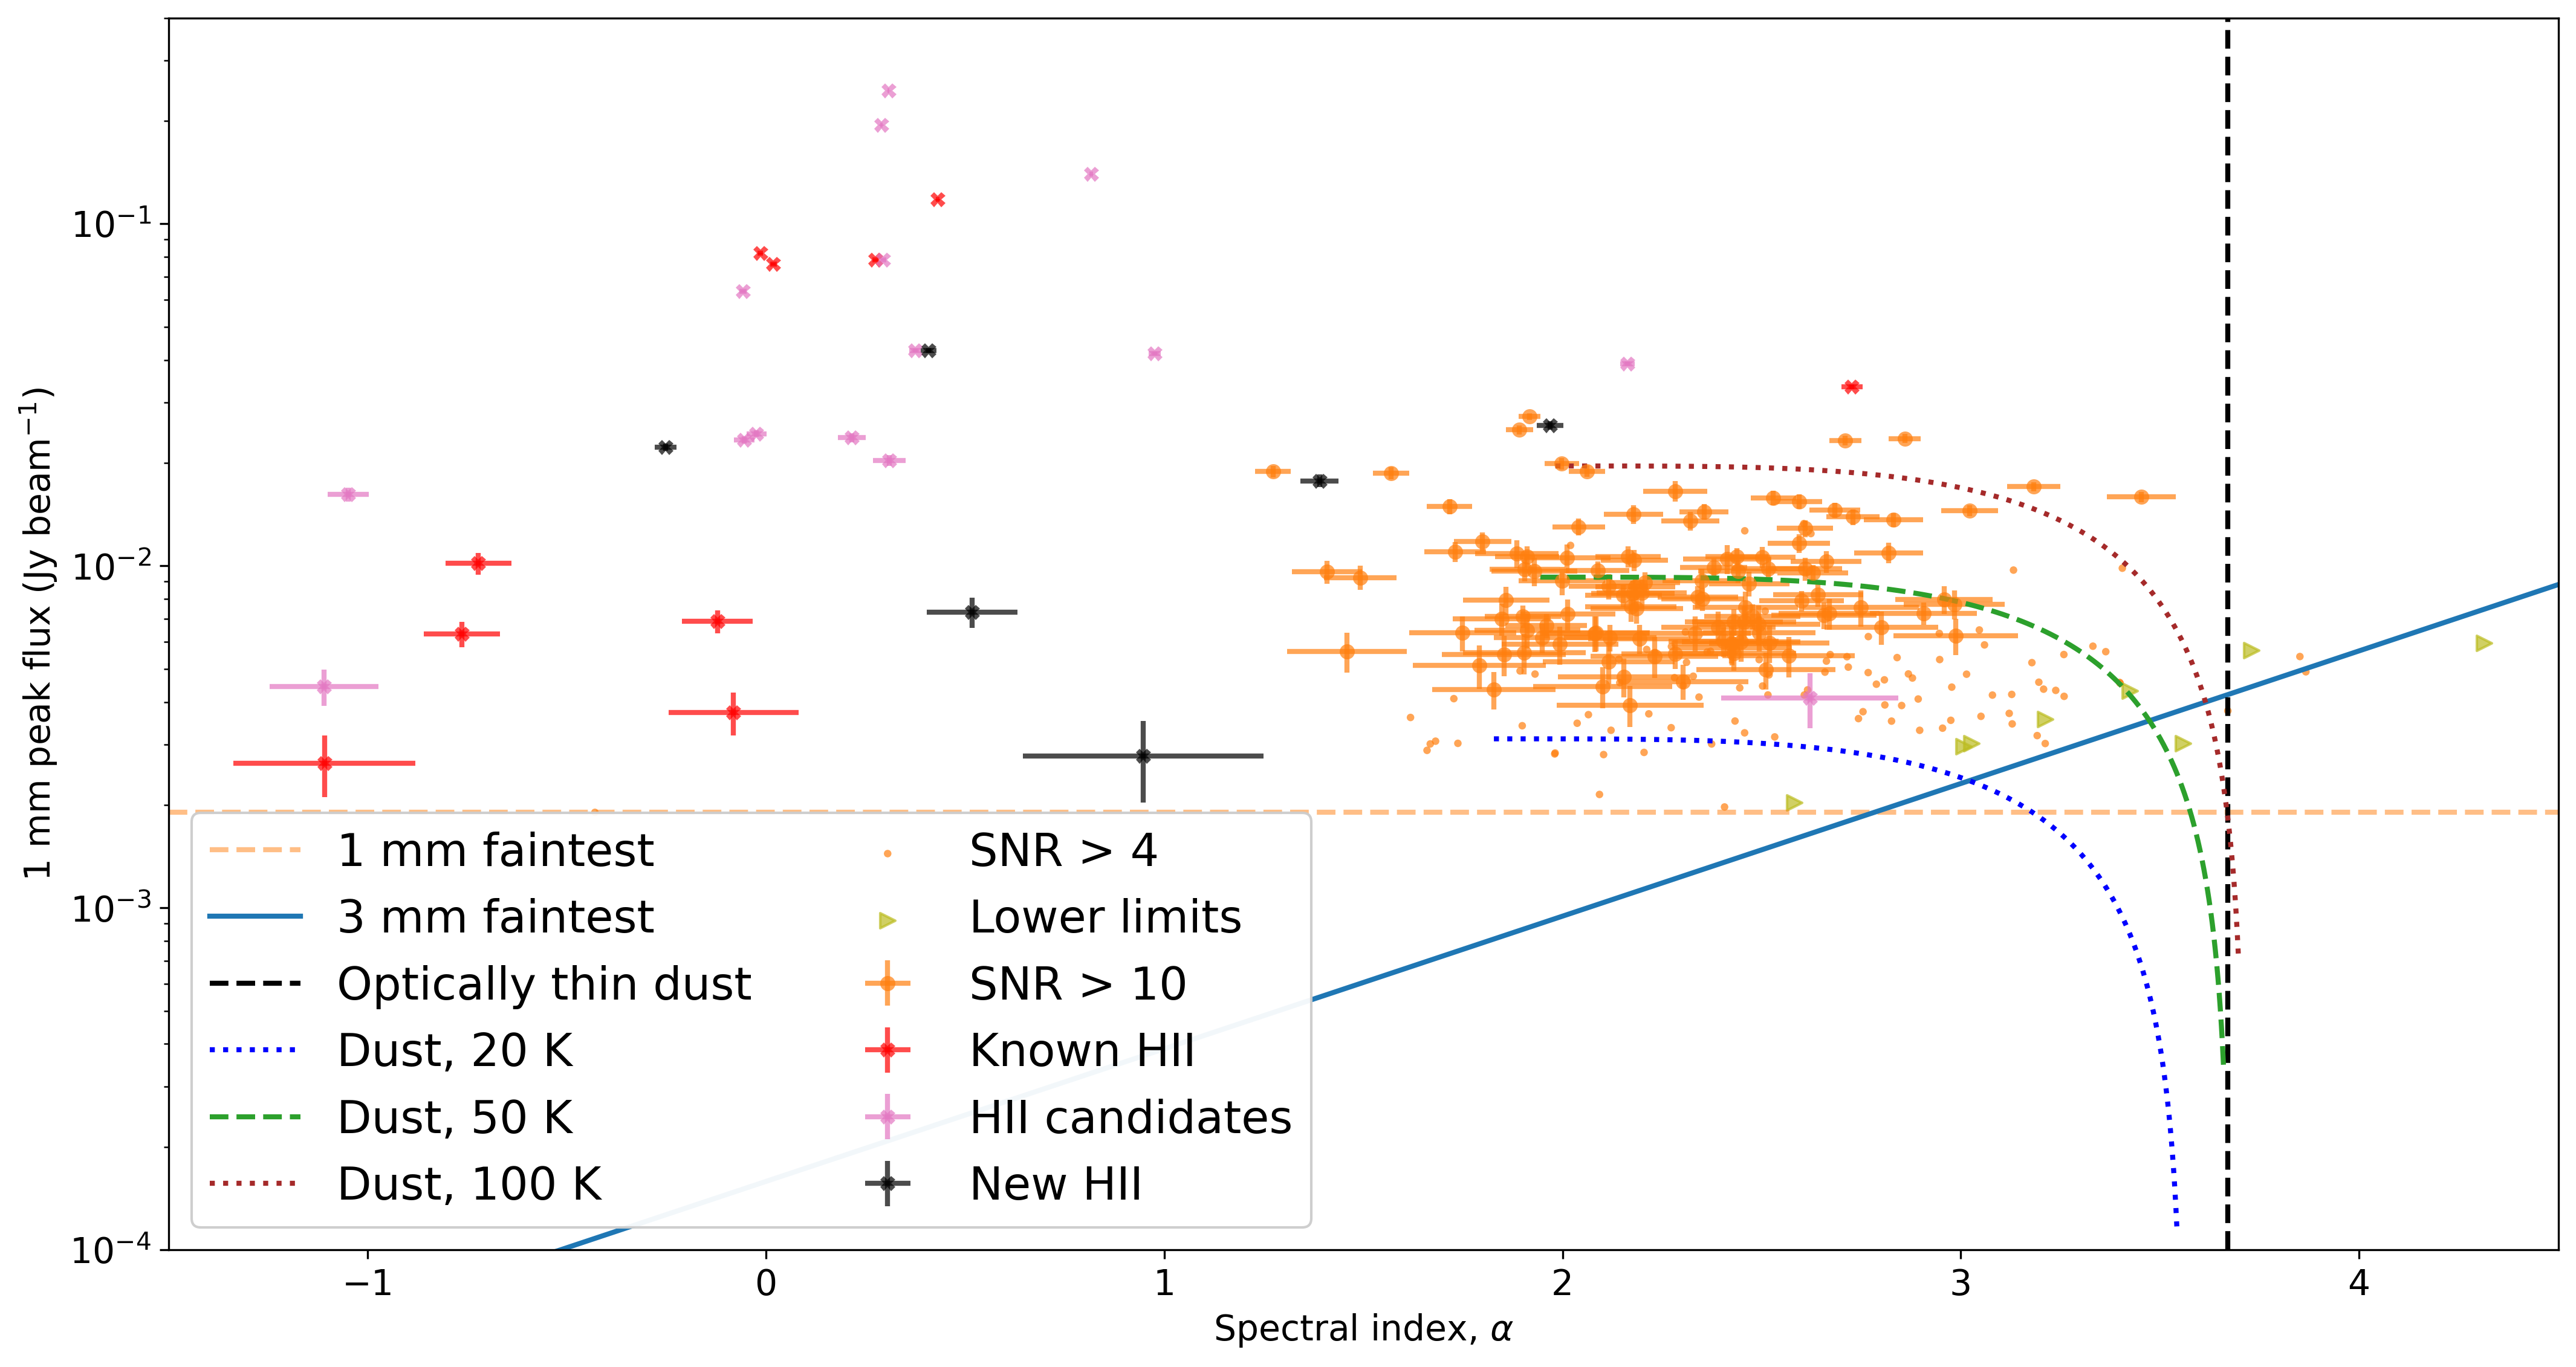
Sgr B2 "color–magnitude":
3 mm peak flux vs spectral index (α between 3 mm and 1 mm)
Budaiev+ (in prep); the axes we'll populate with cores
Sensitivity limits
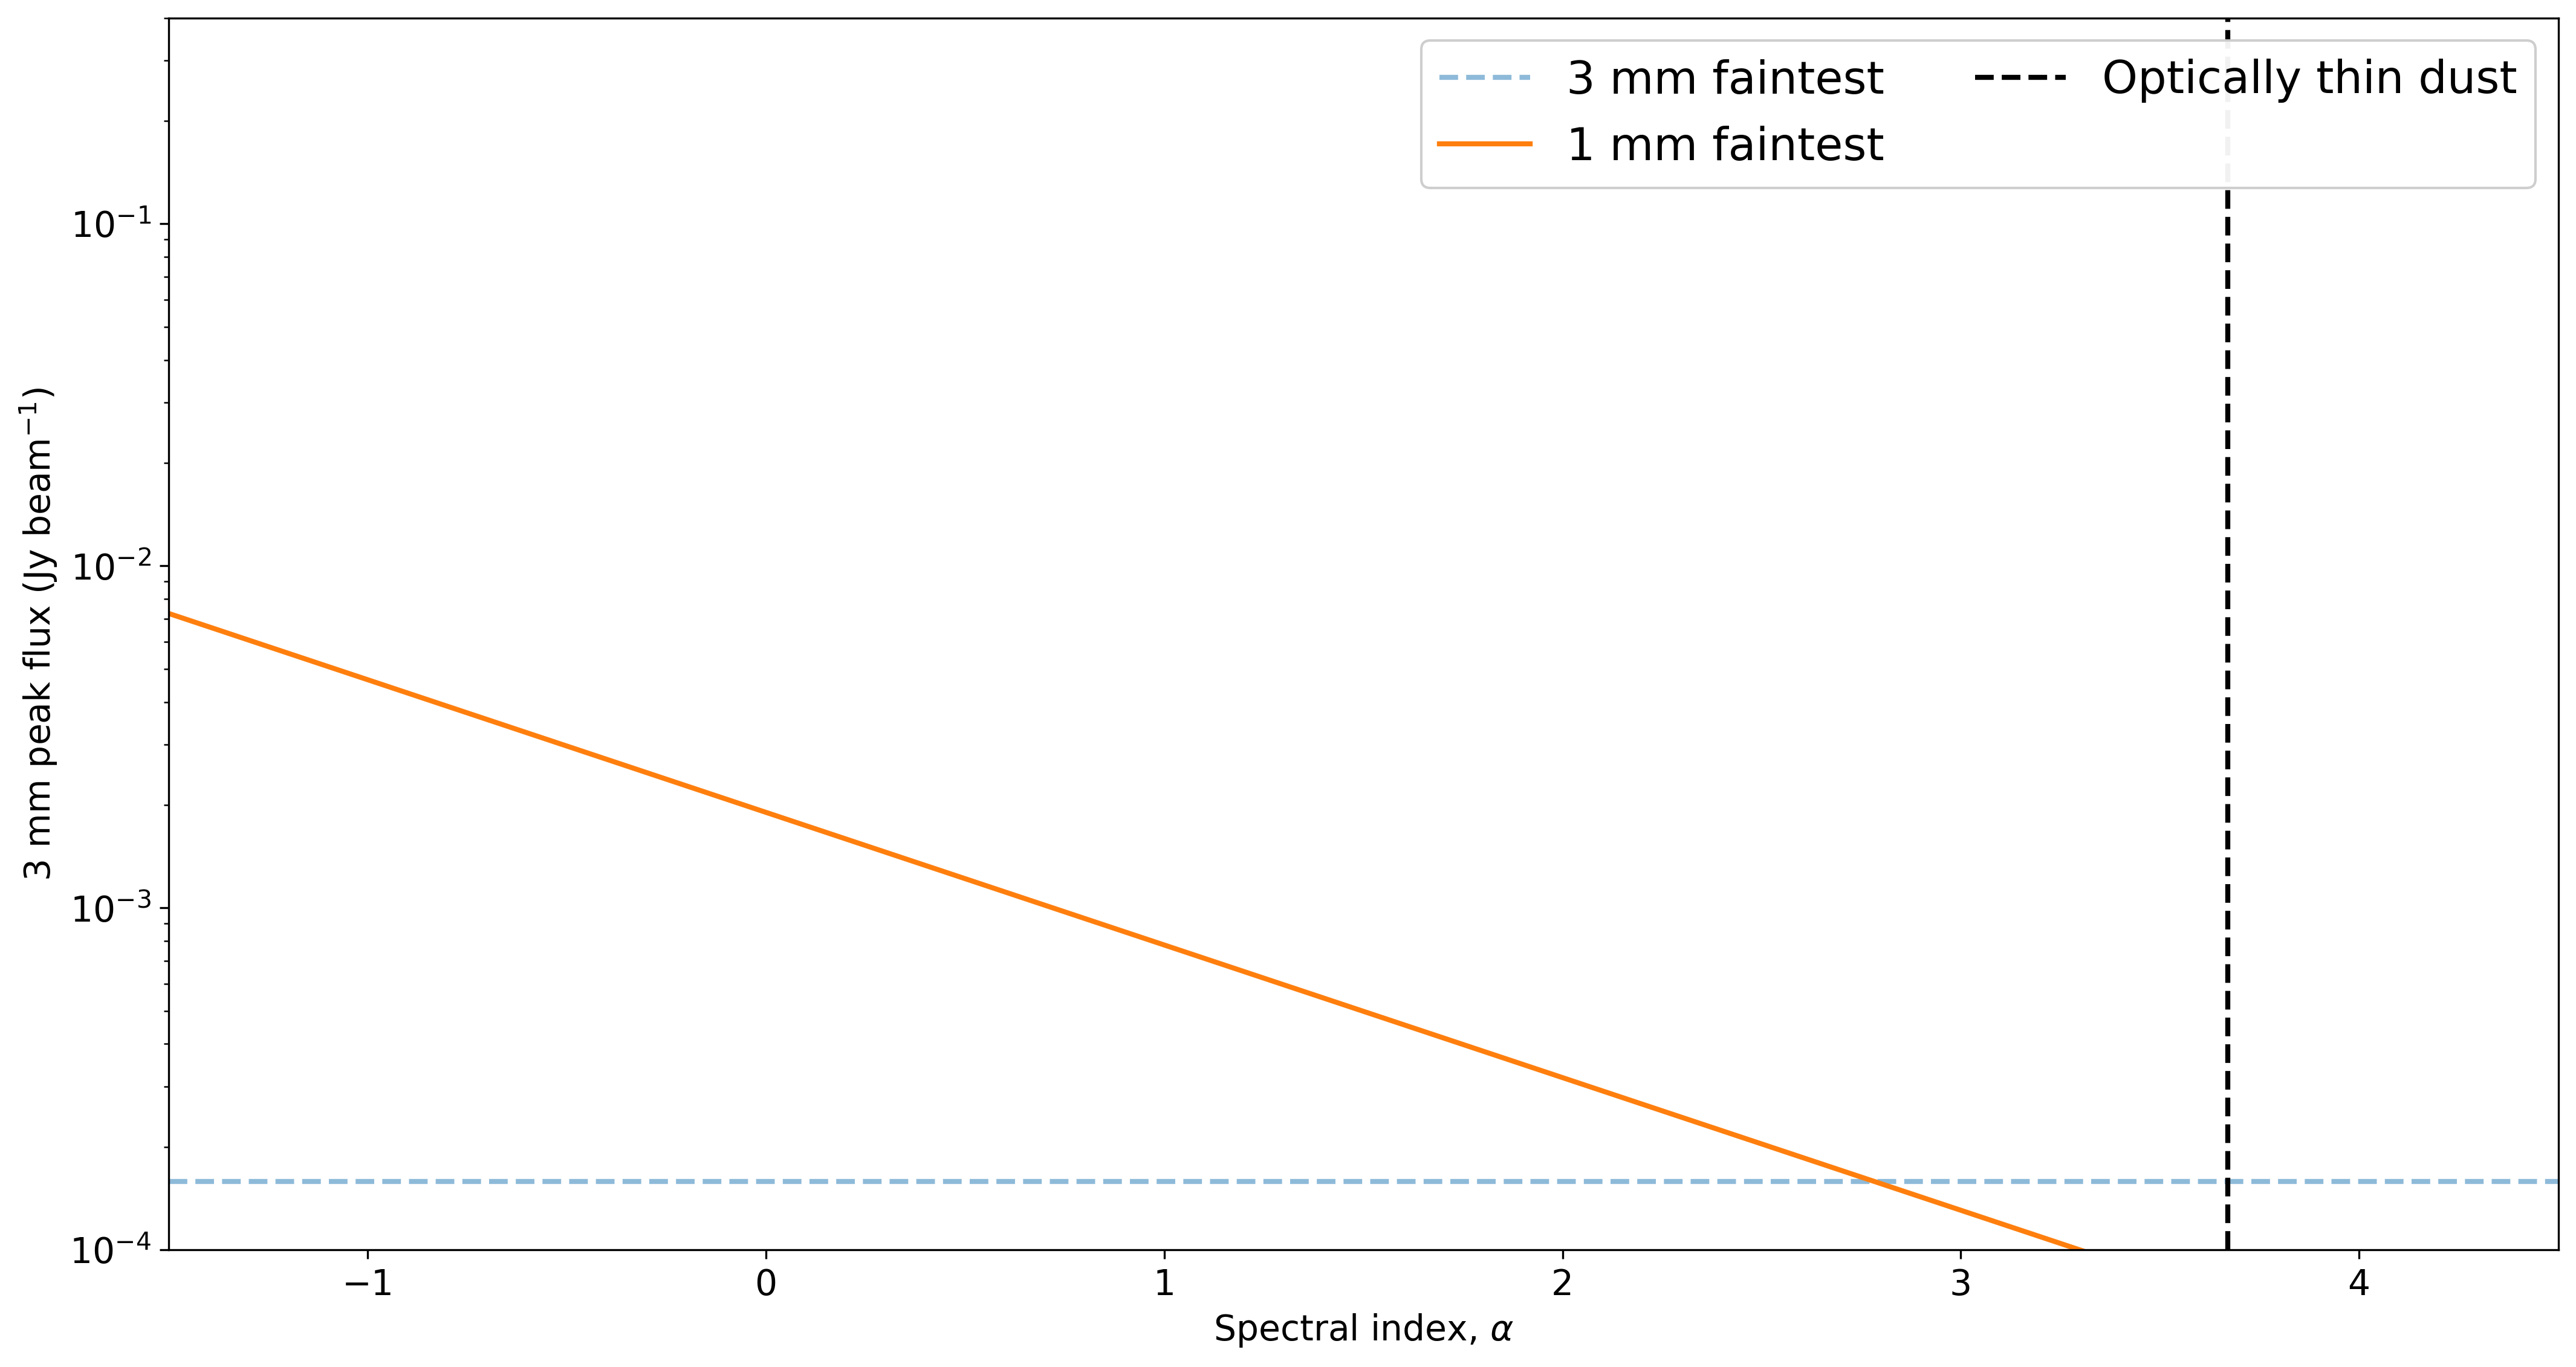
Dust model tracks (20/50/100 K)
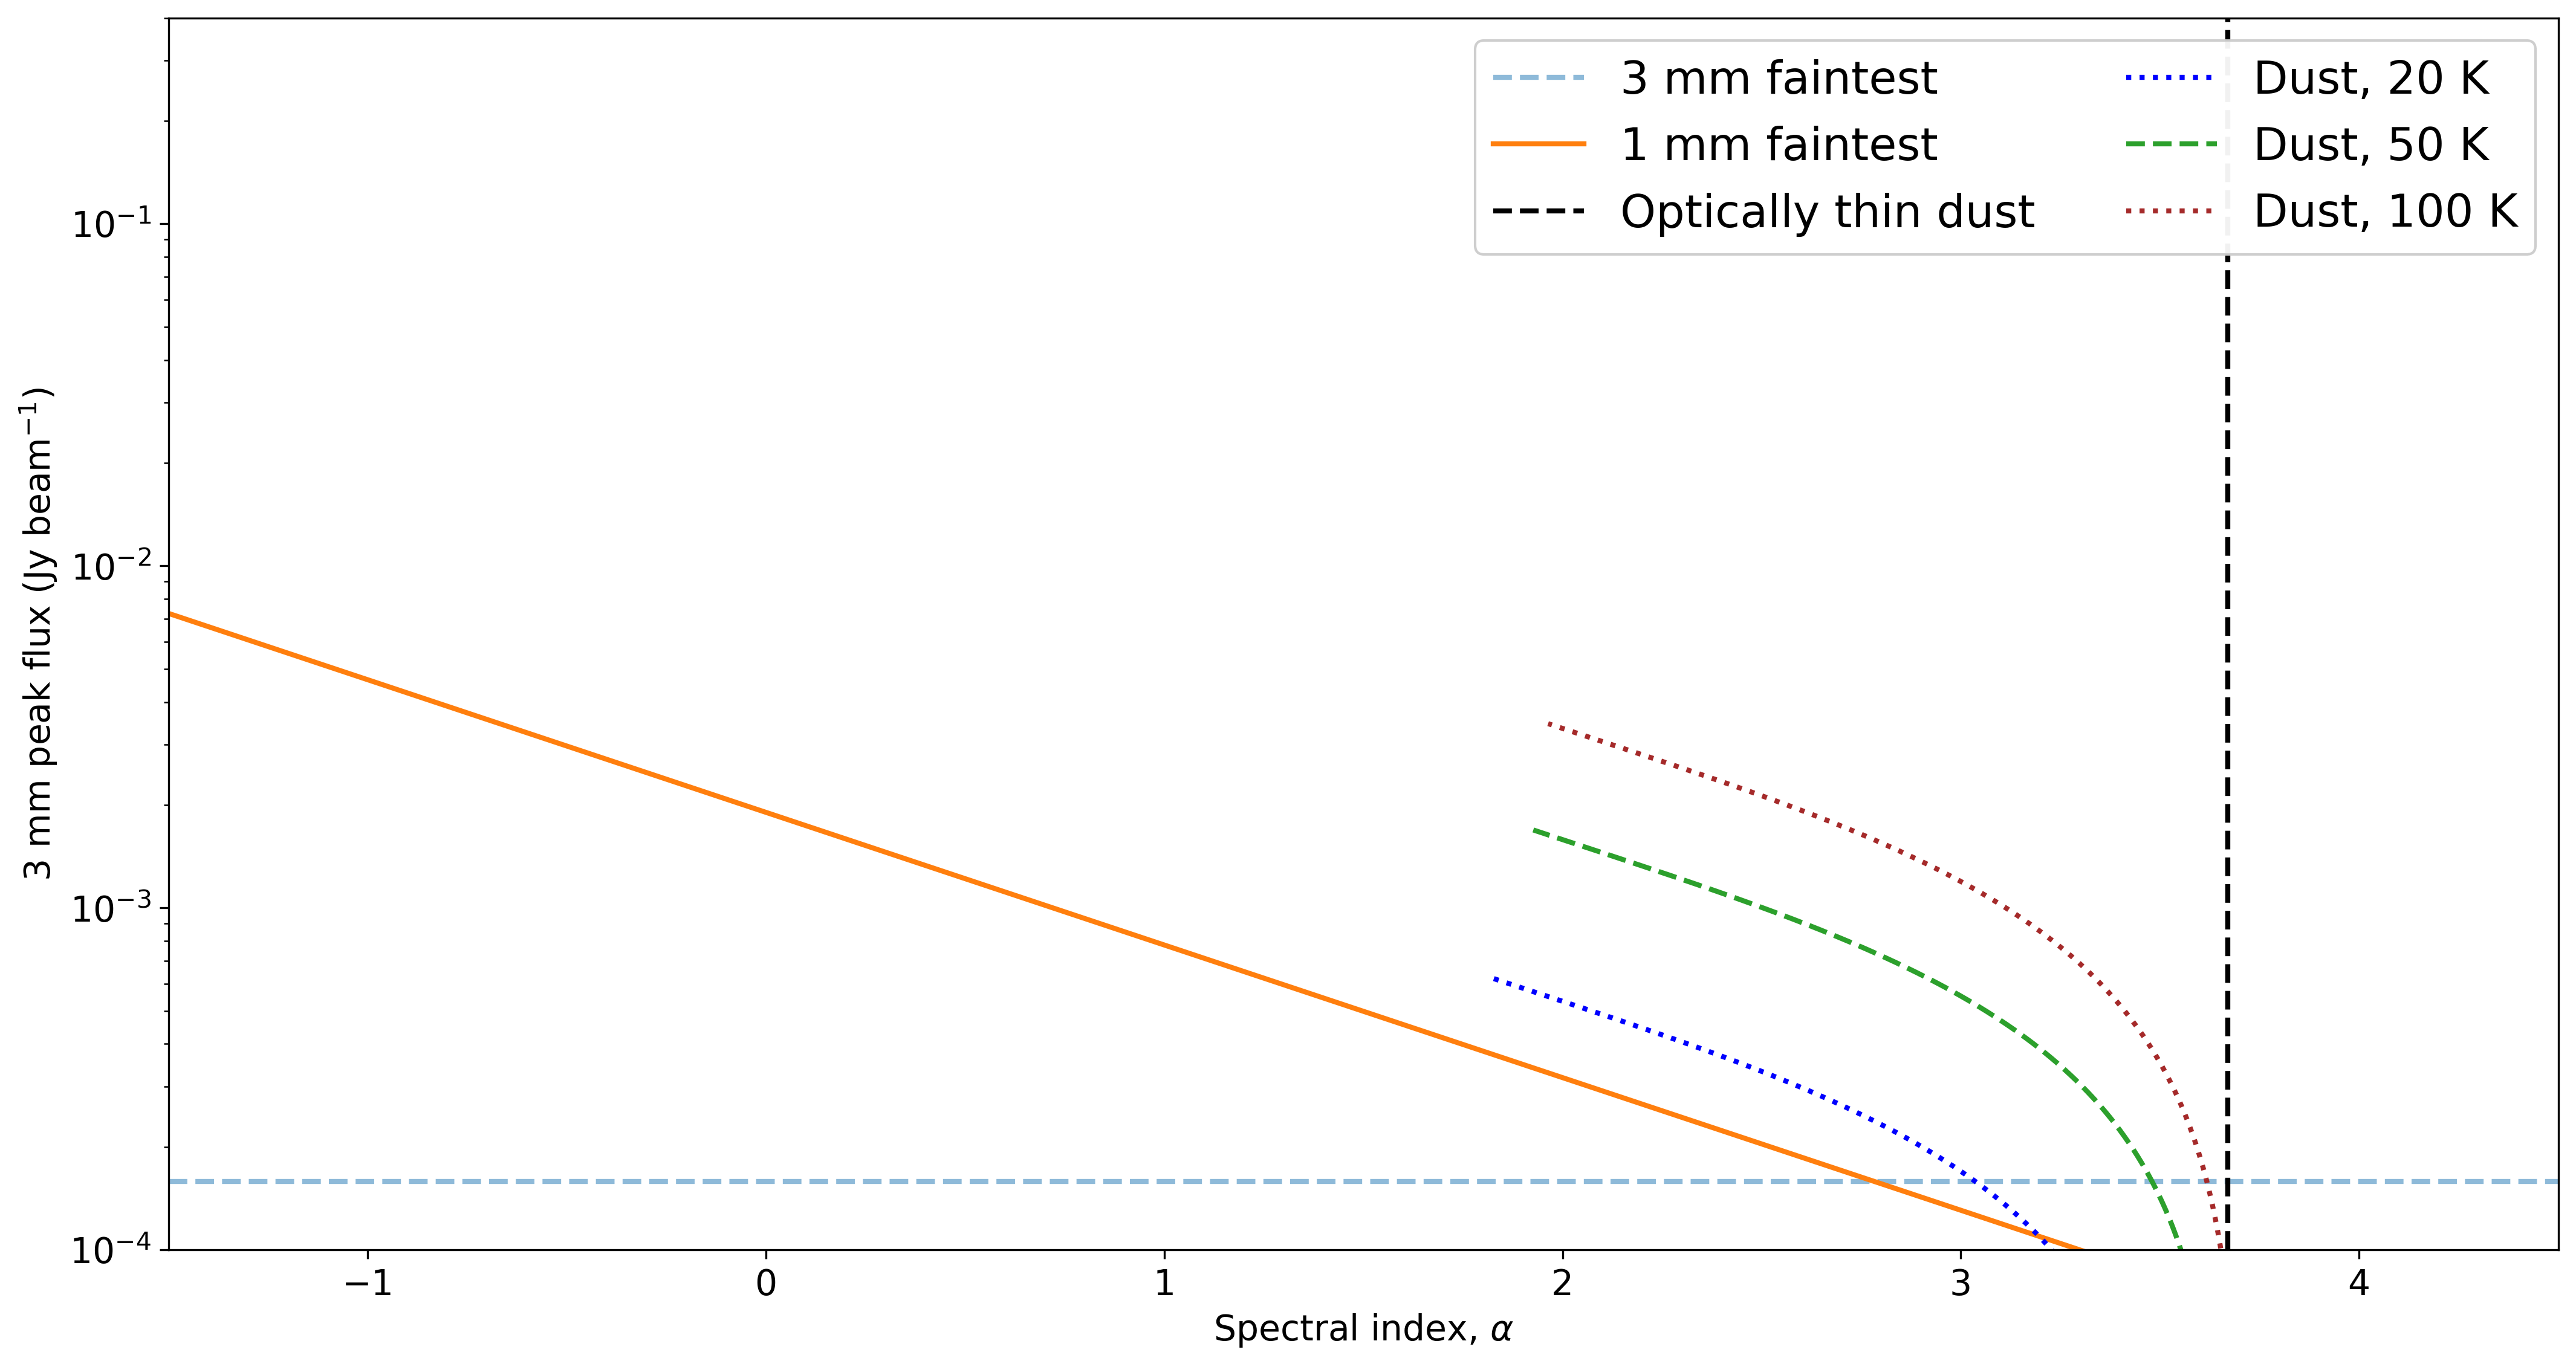
Dust cores (some thick)
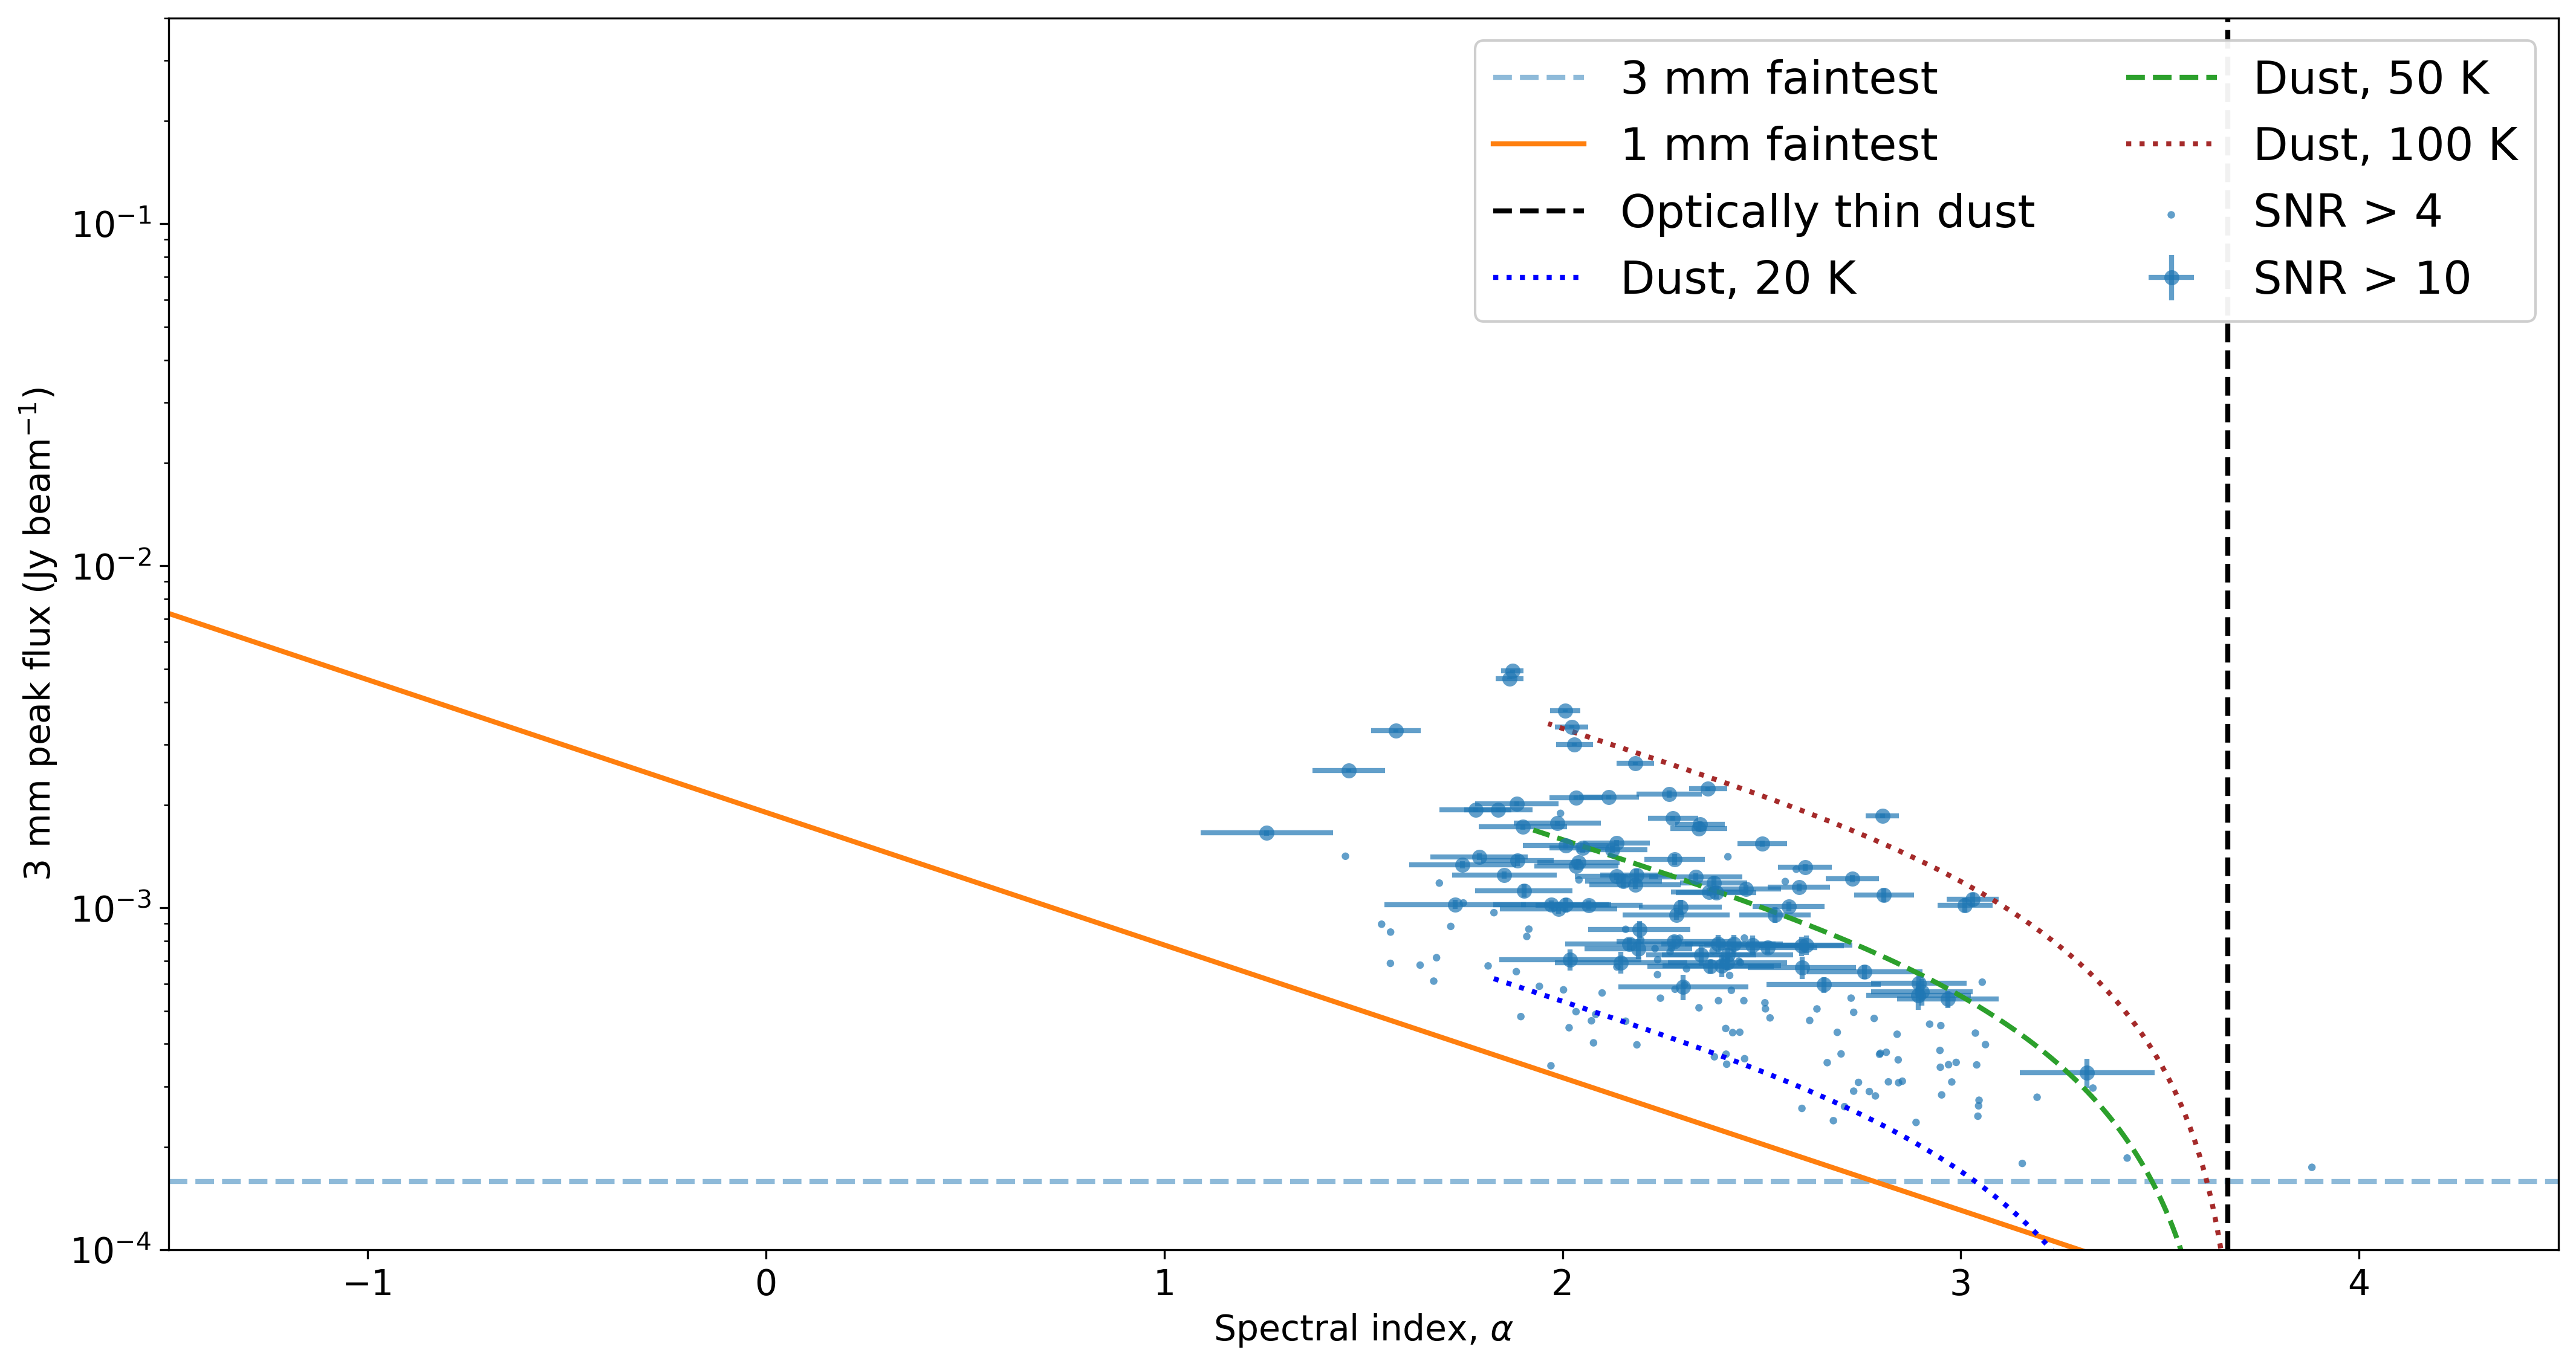
...and HII regions
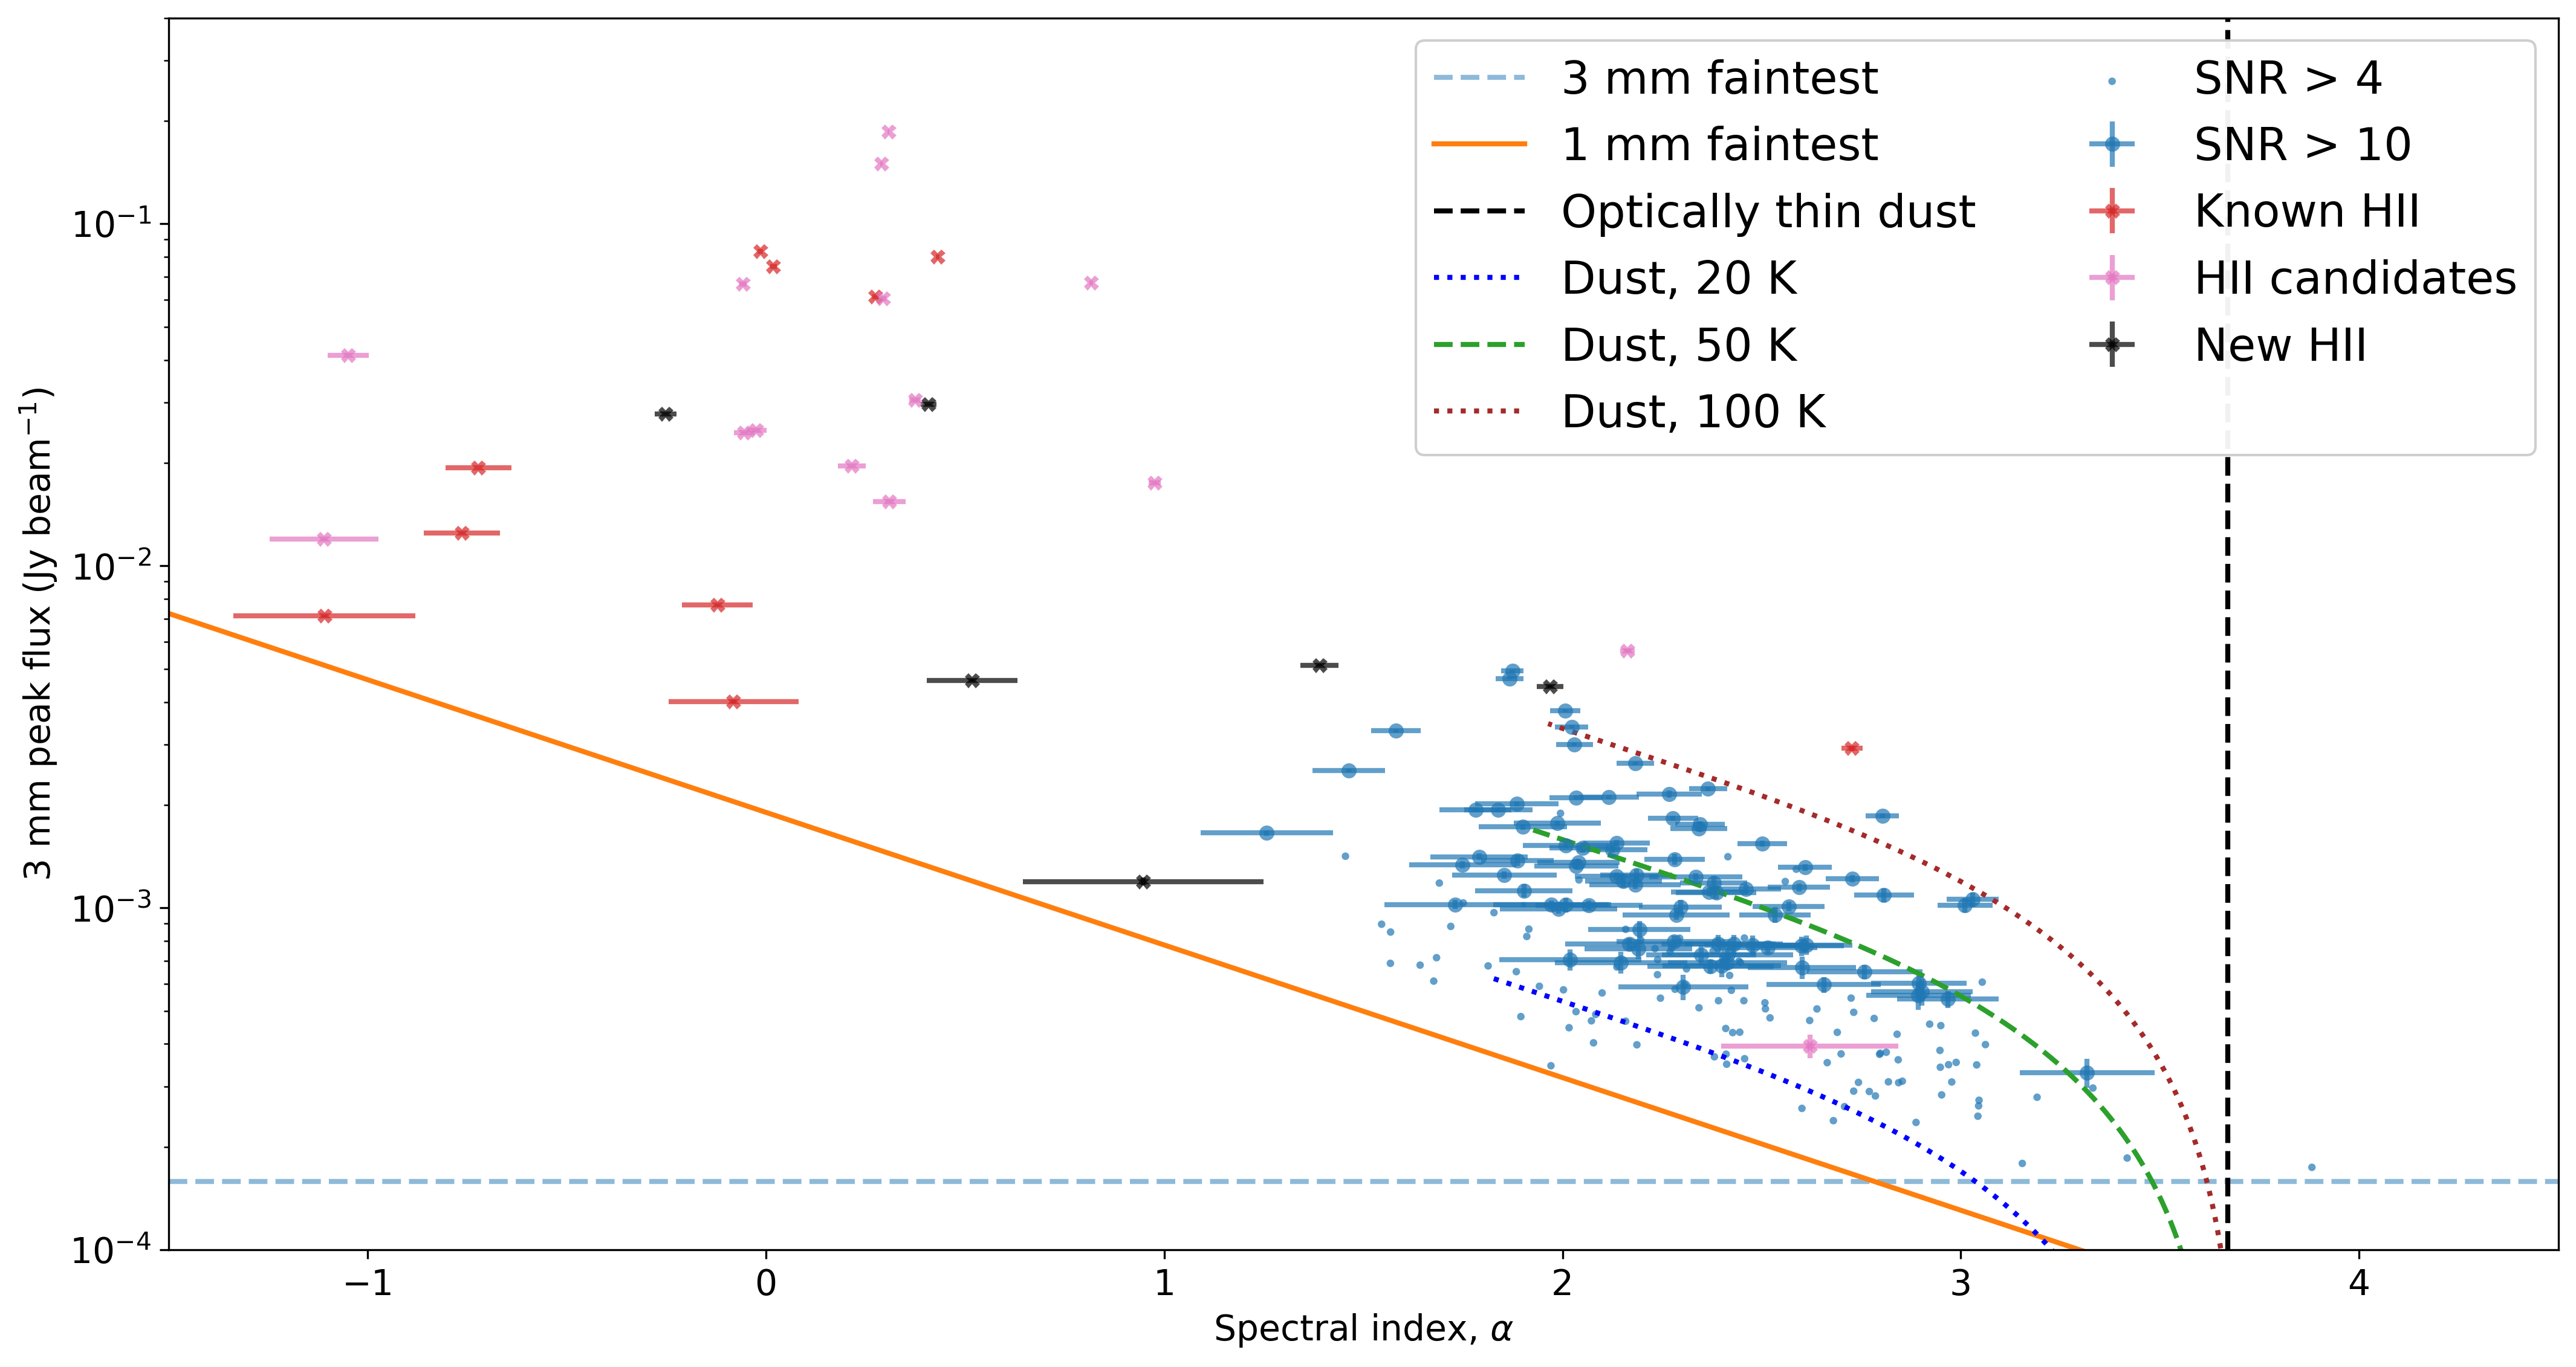
Upper limits at 1mm
Same diagram for 1 mm peak flux
Sensitivity floors at 1 mm
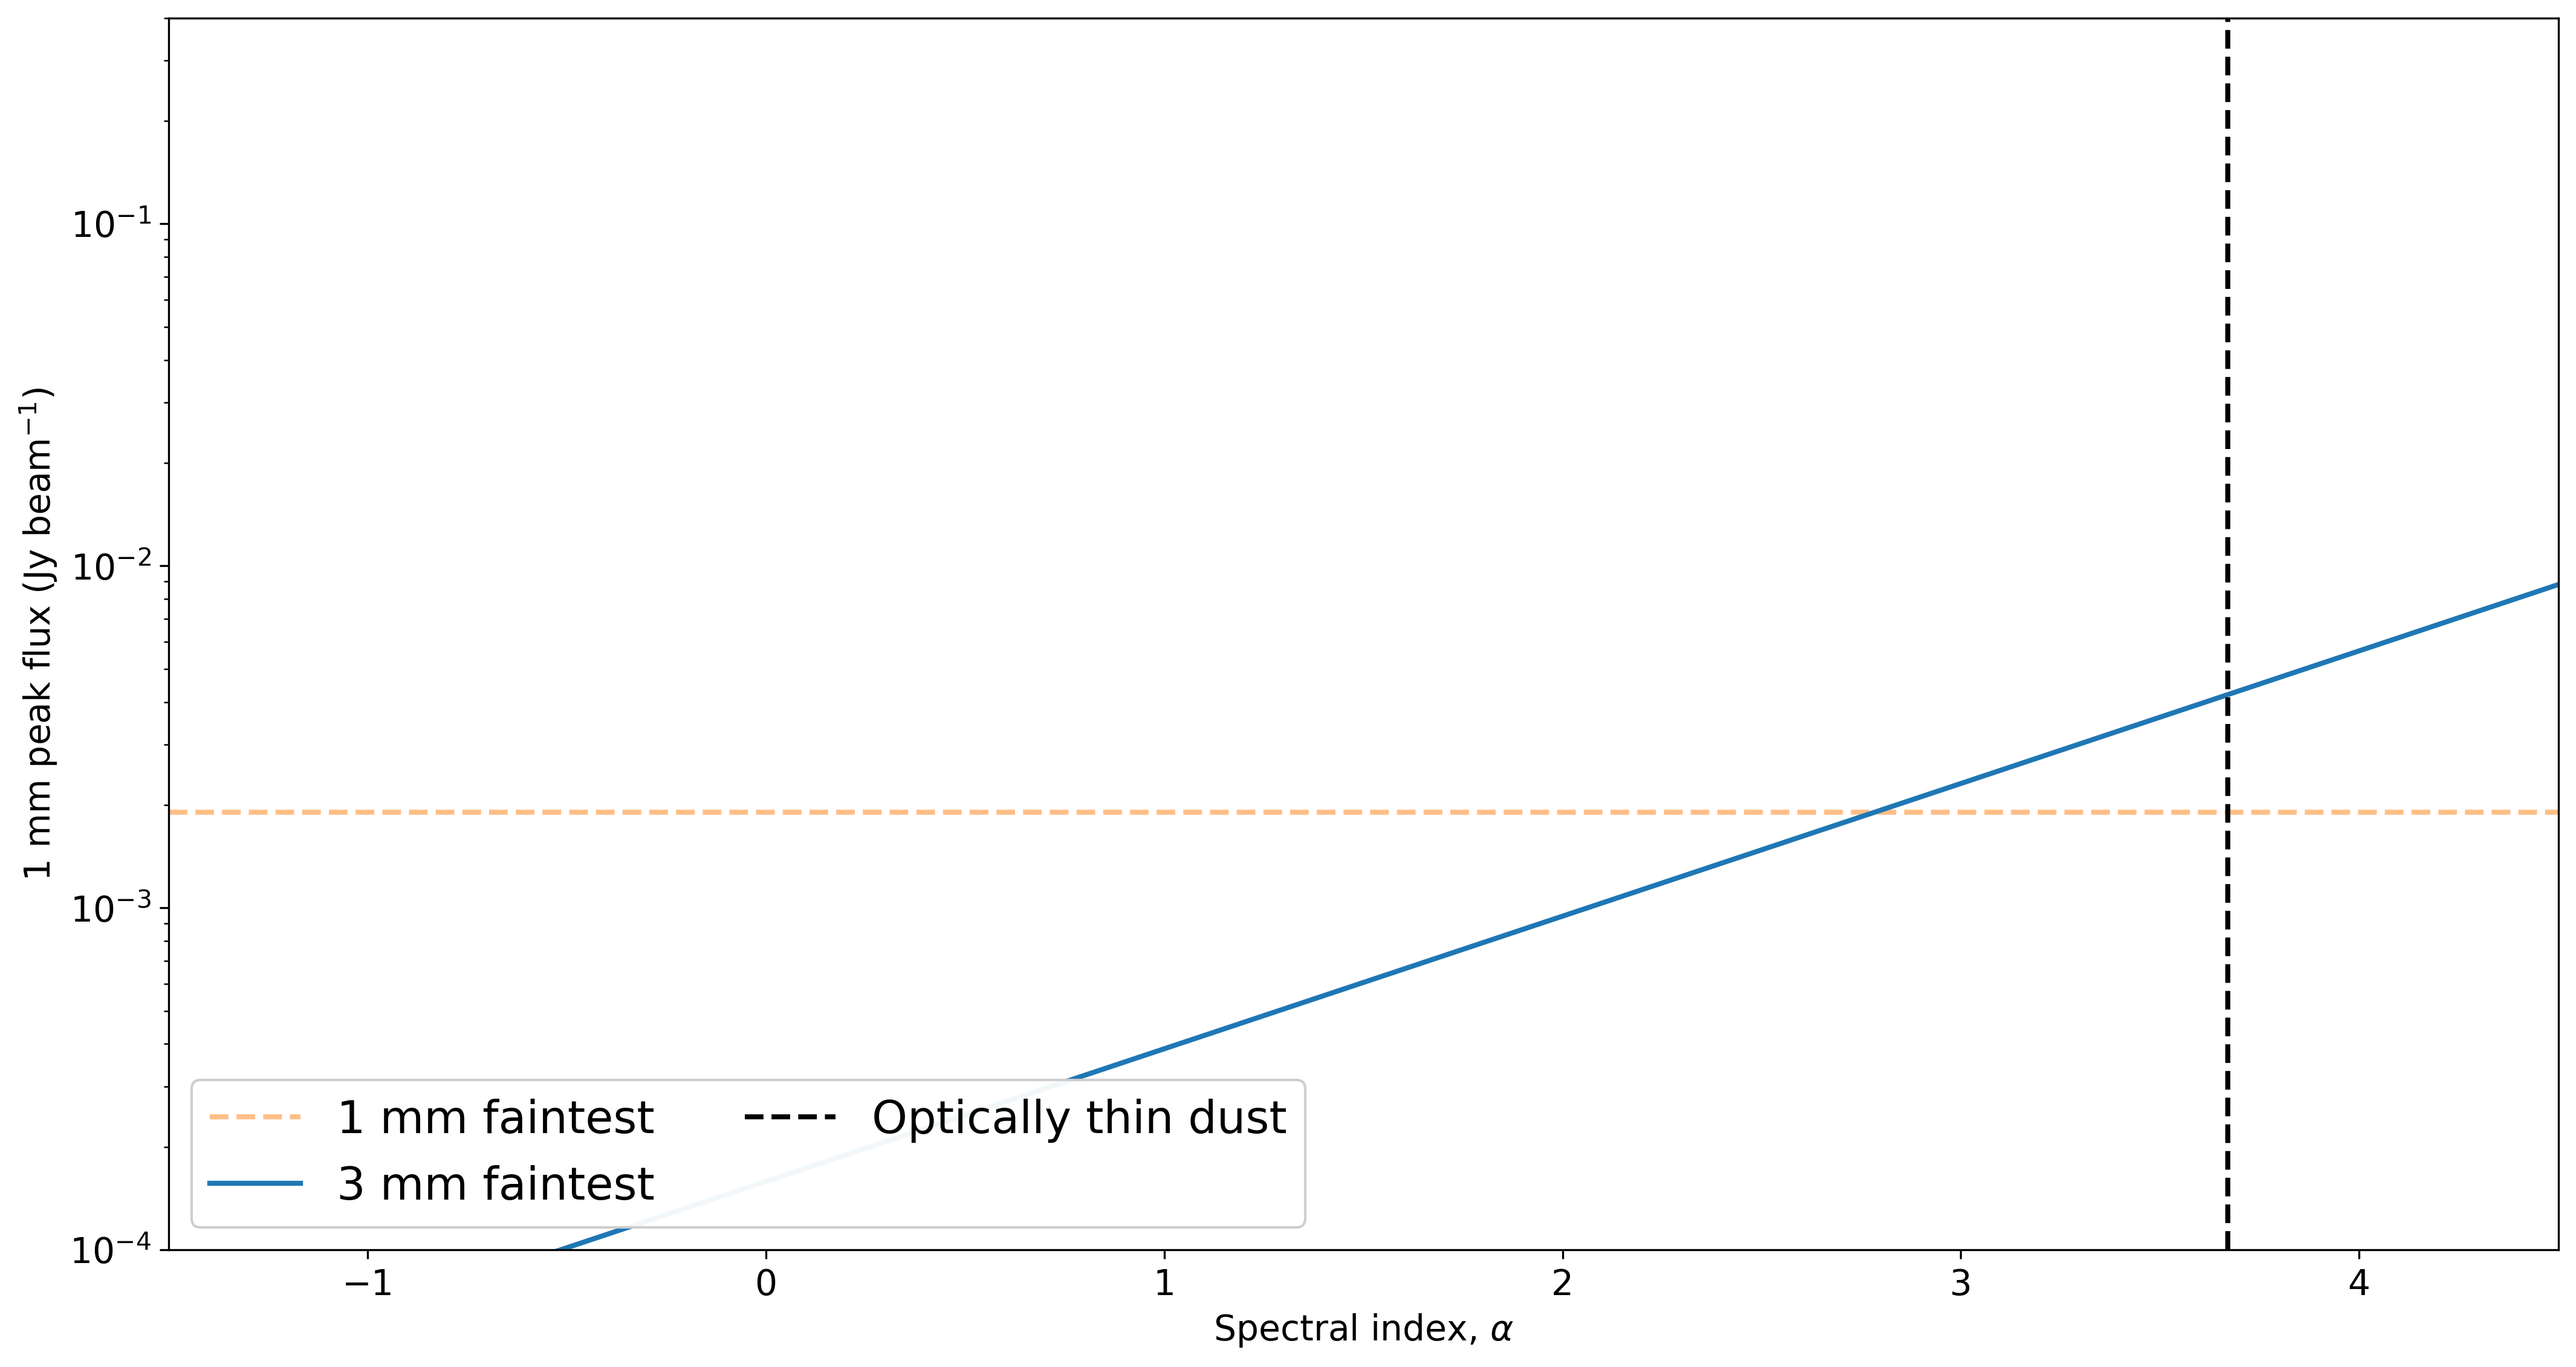
Dust tracks and the optically-thin limit
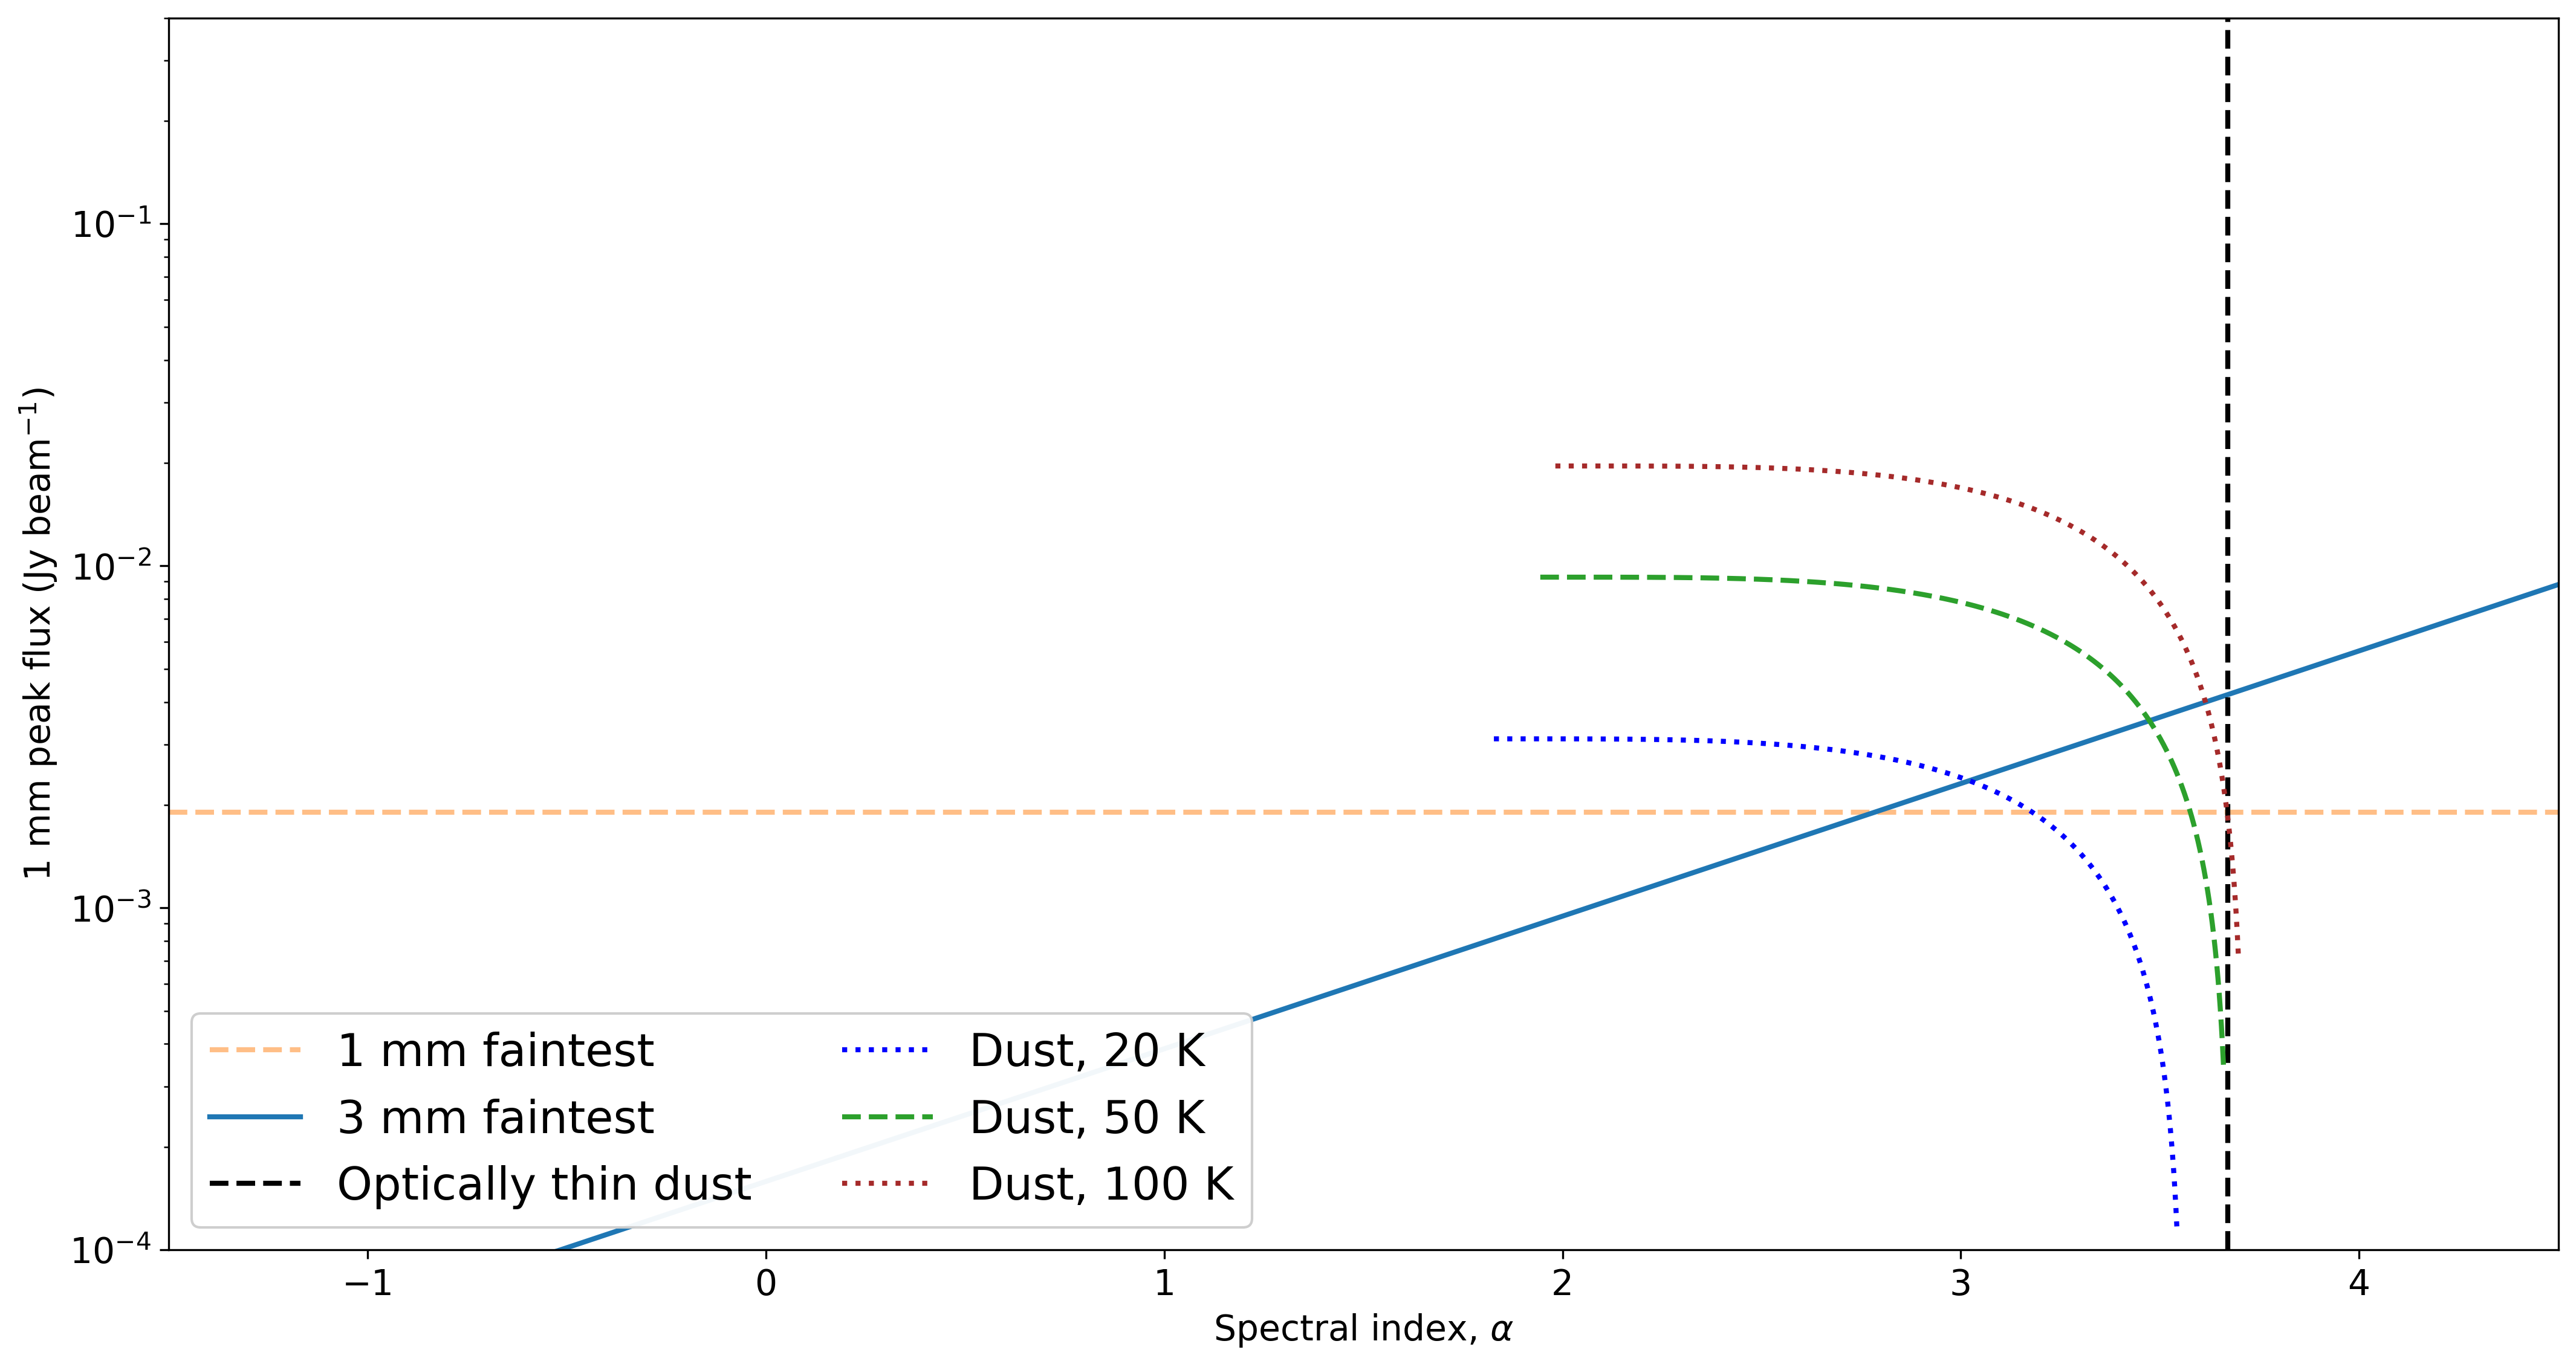
The 1 mm-detected cores
HII regions
3mm upper limits
The same diagnostic for the ALMA-IMF getsf cores, colored by protocluster (3 mm left, 1 mm right)
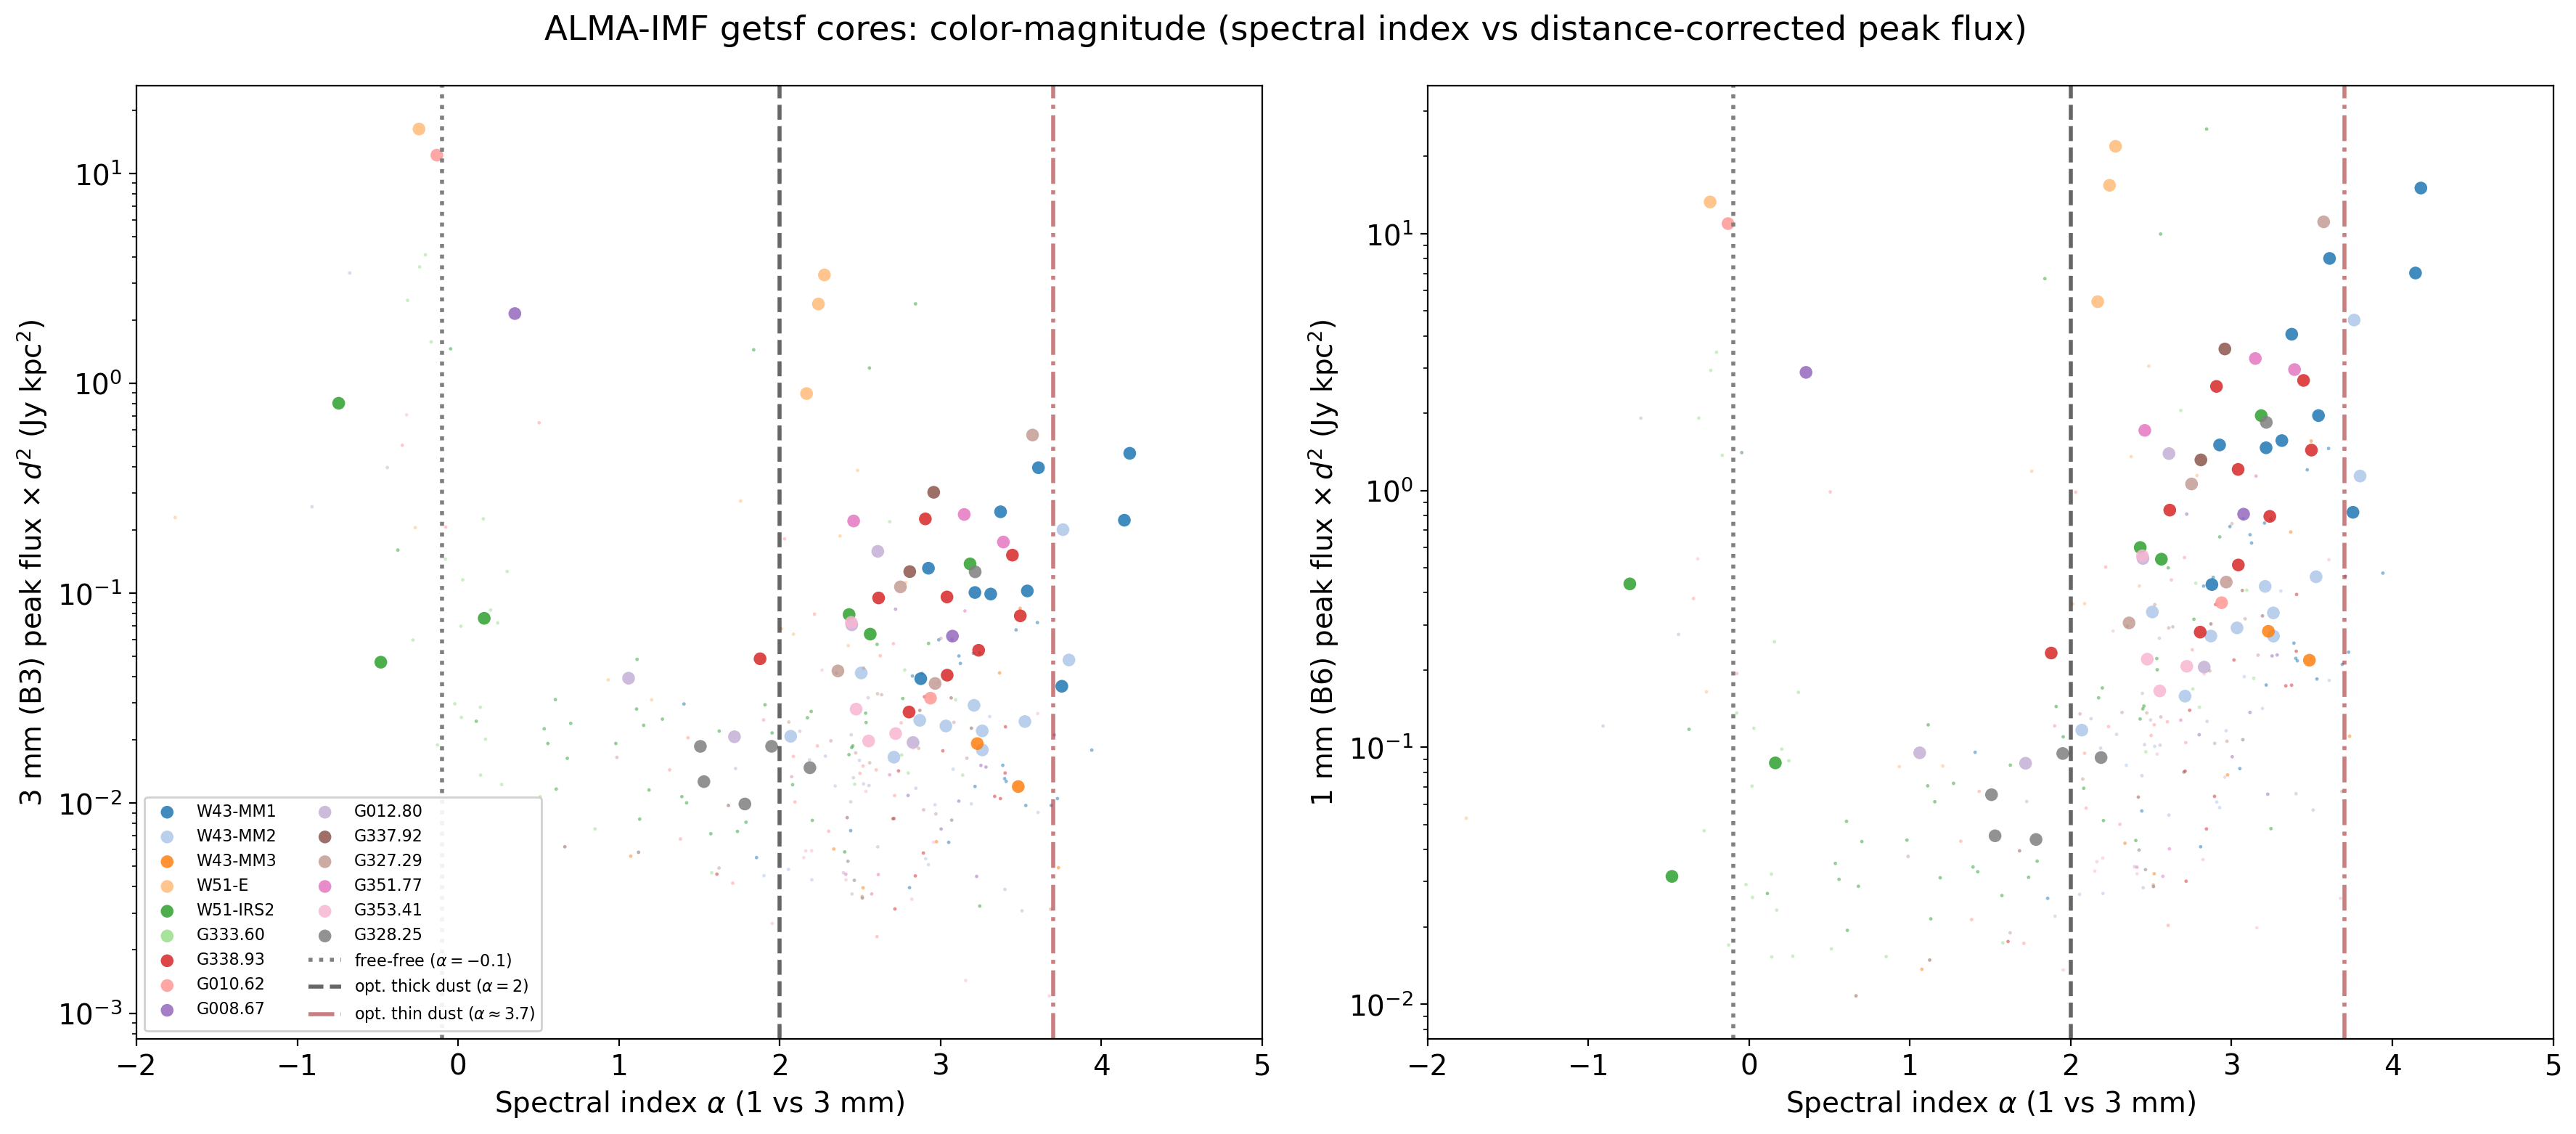
ALMA-IMF cores: spectral index (1 vs 3 mm) vs peak flux; vertical lines mark free-free (α=−0.1), optically-thick (α=2) and optically-thin (α=3.7) dust
Multi dataset CMD
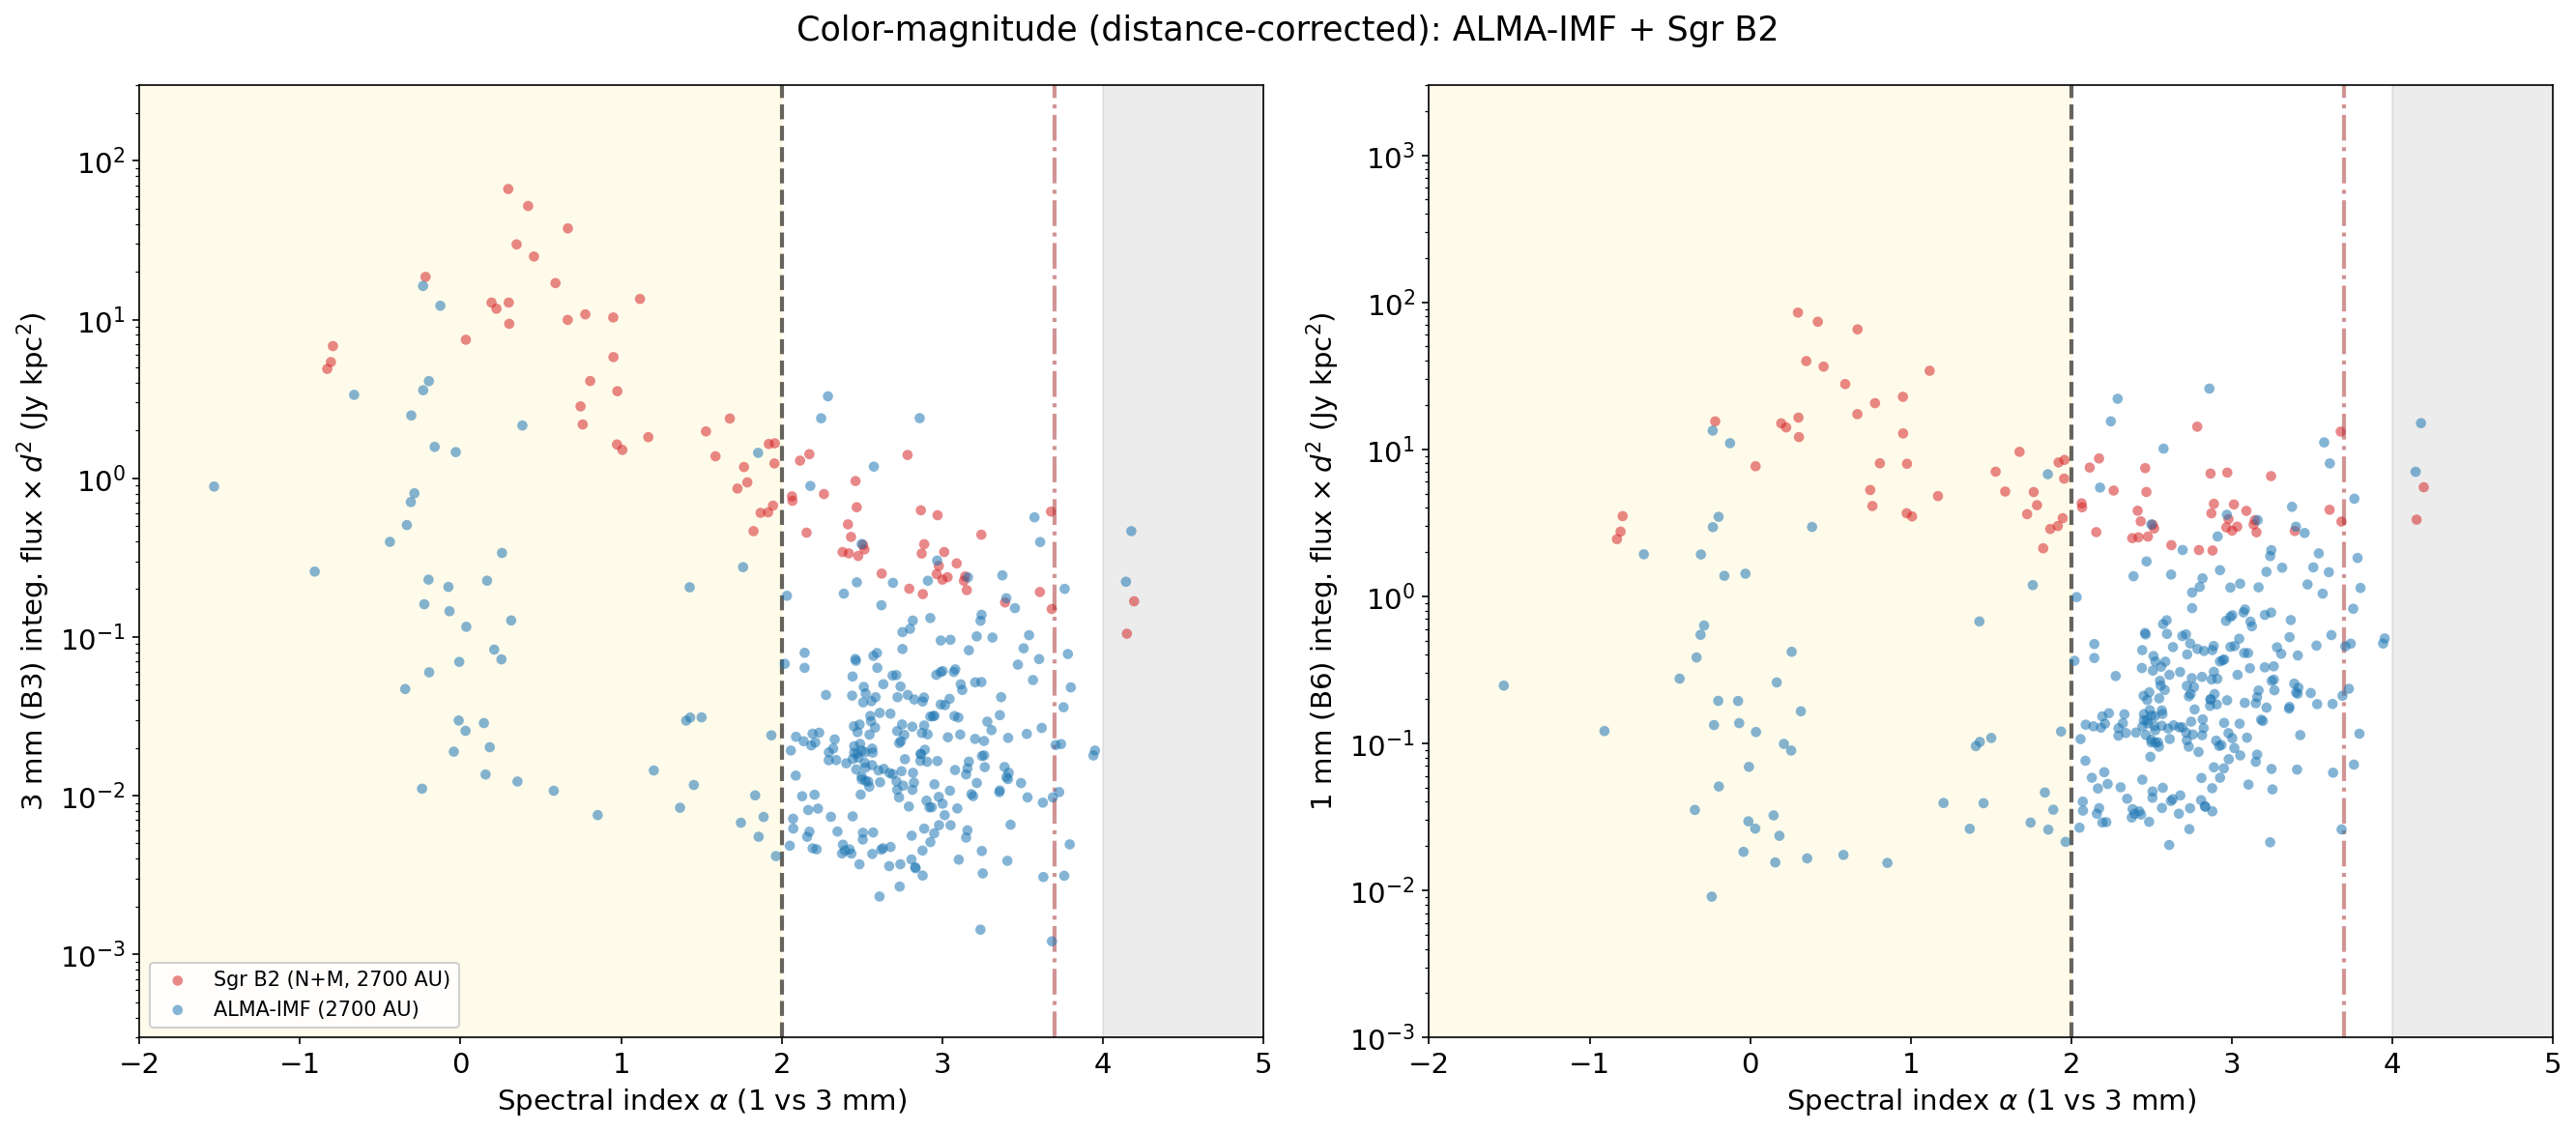
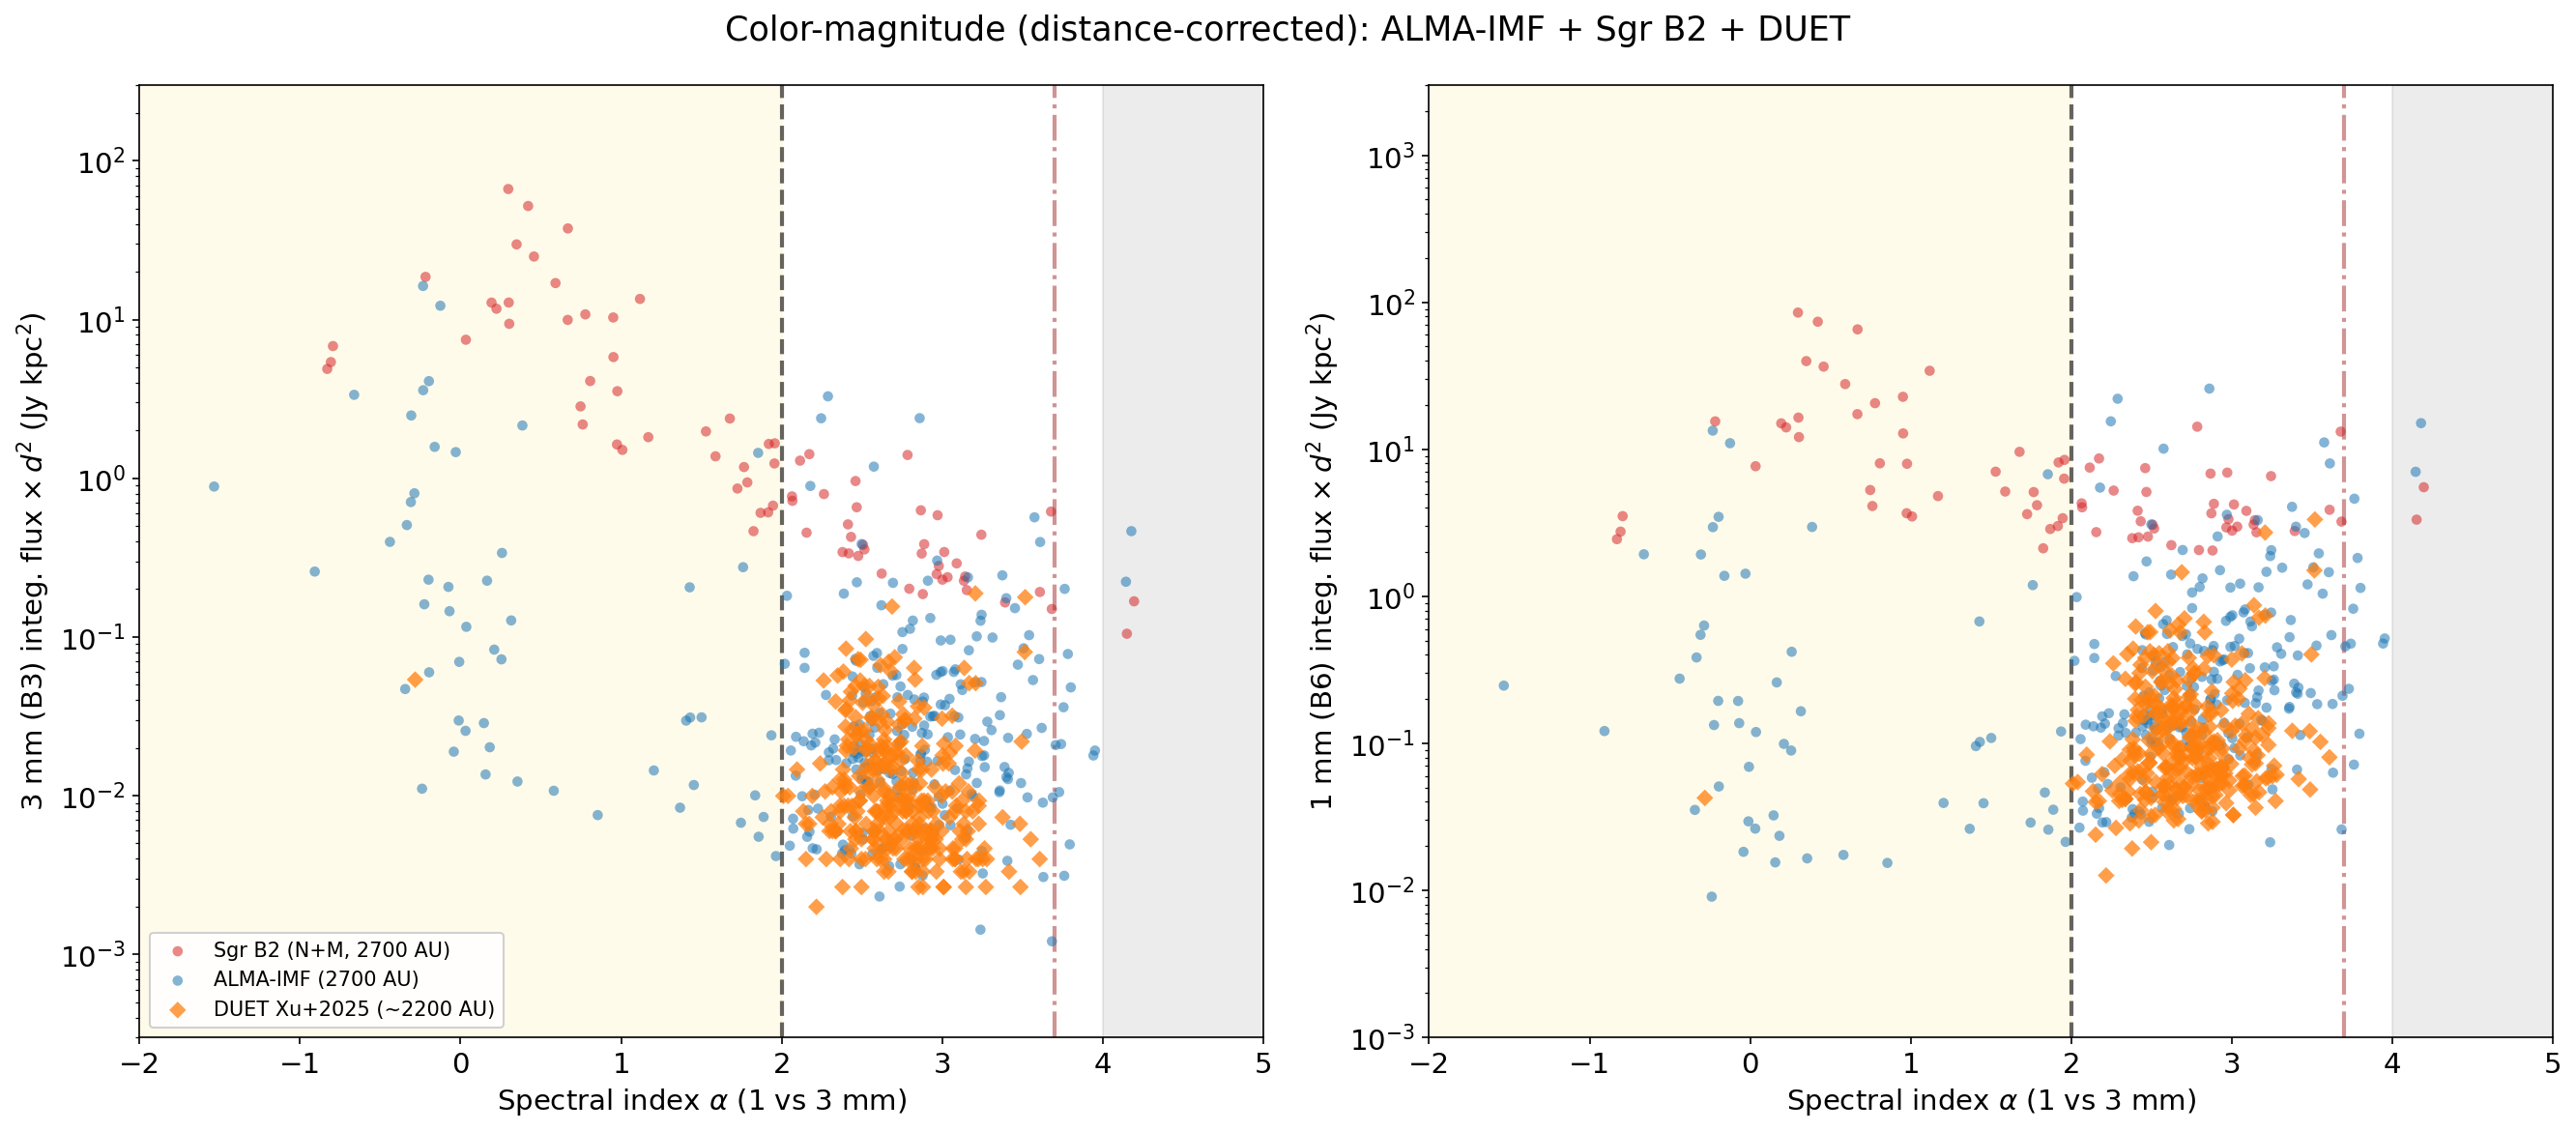
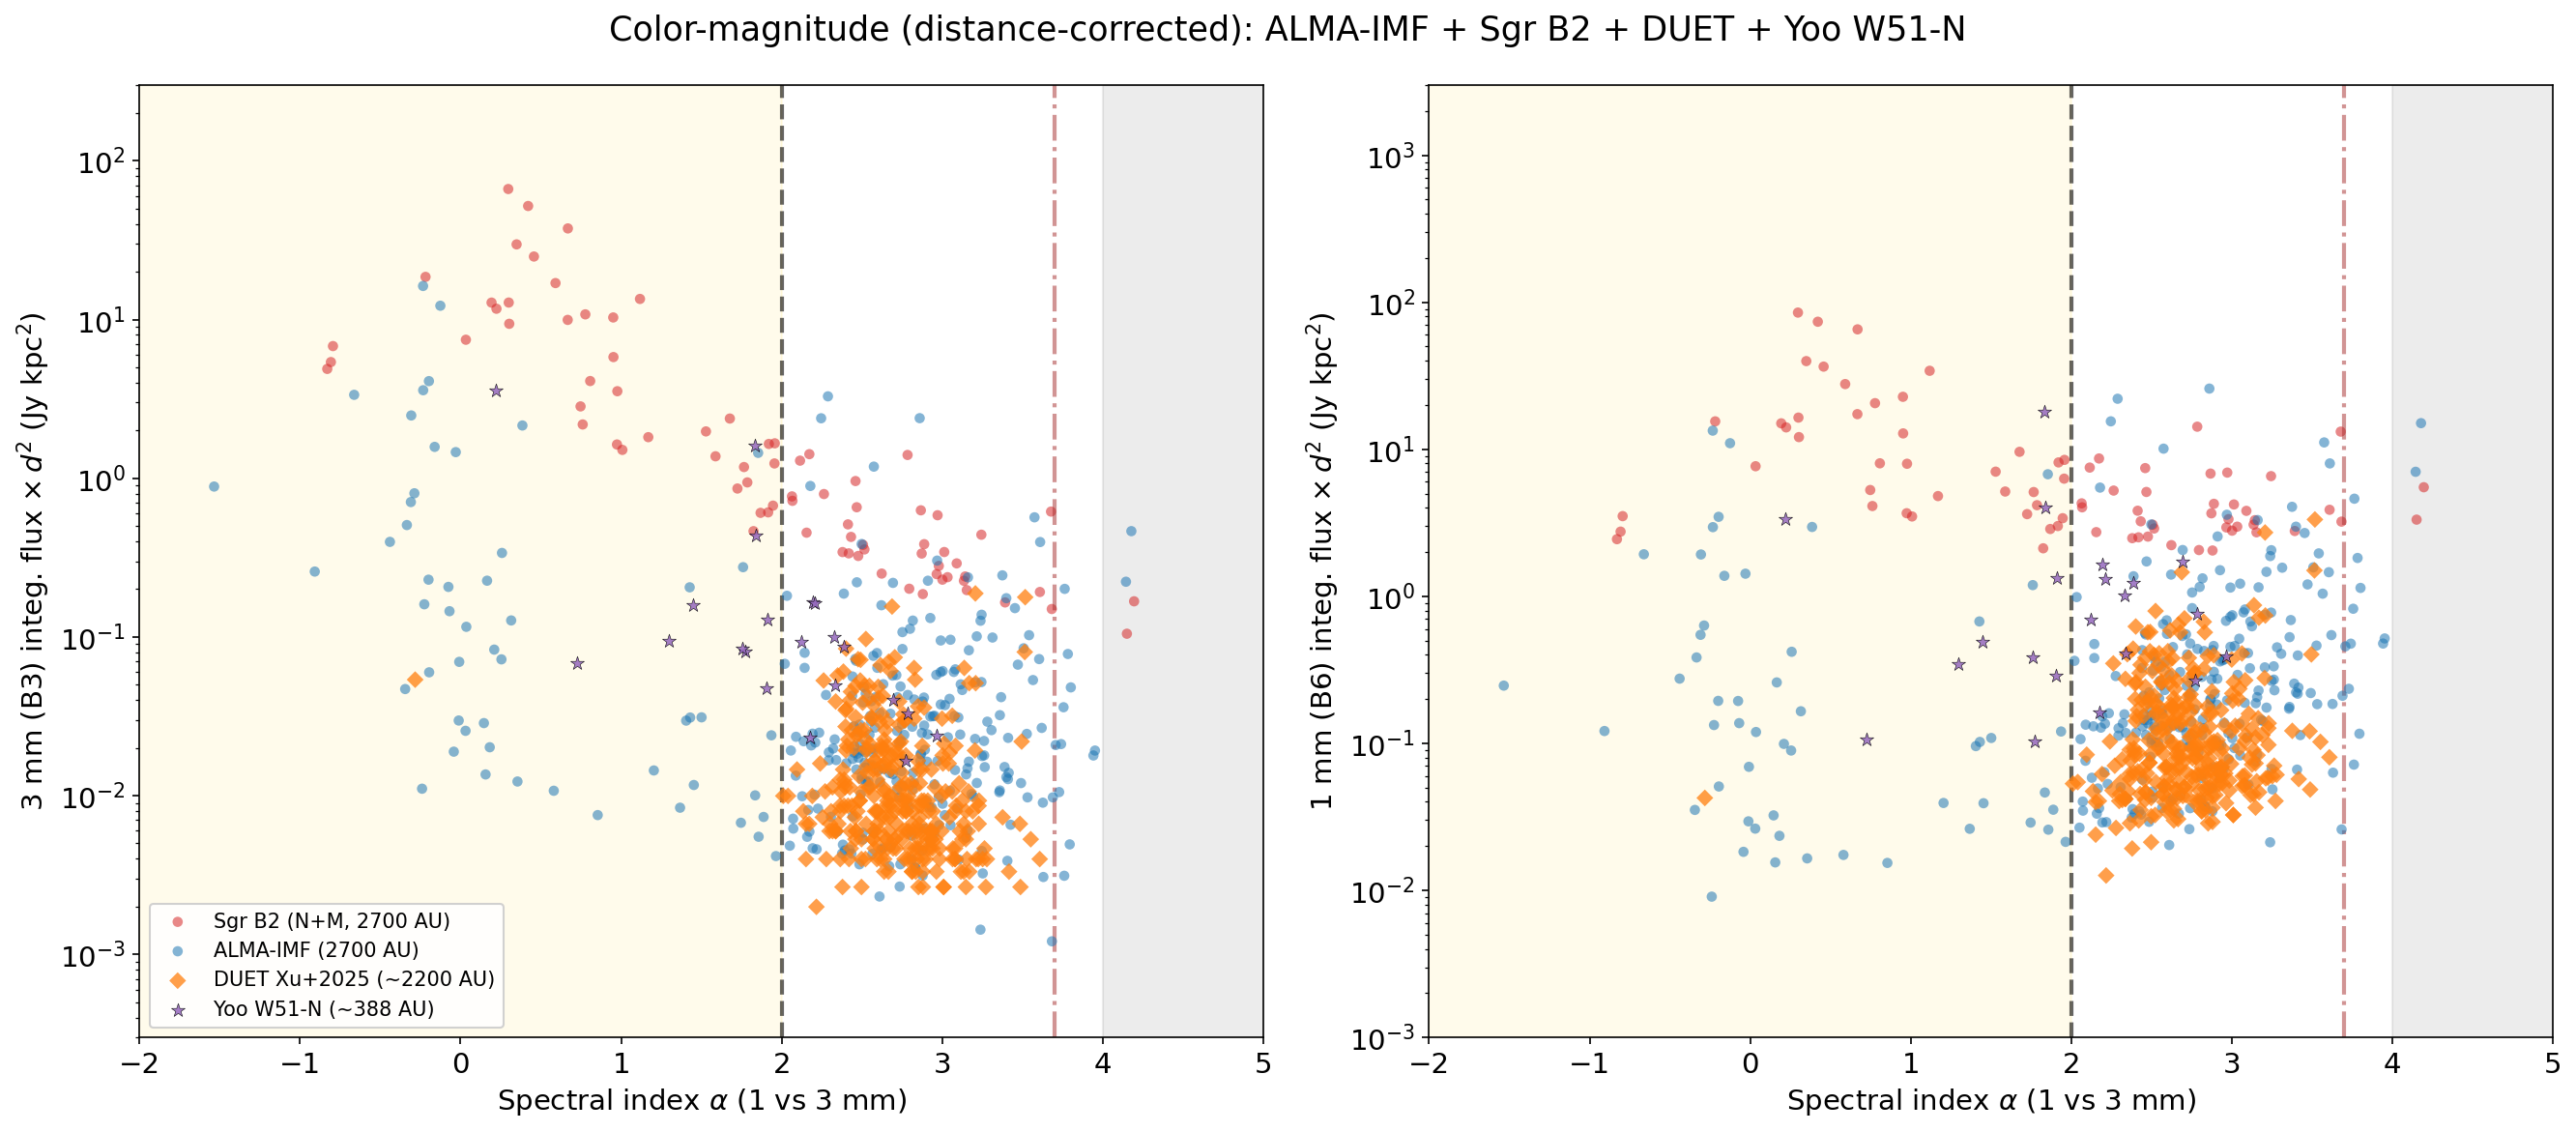

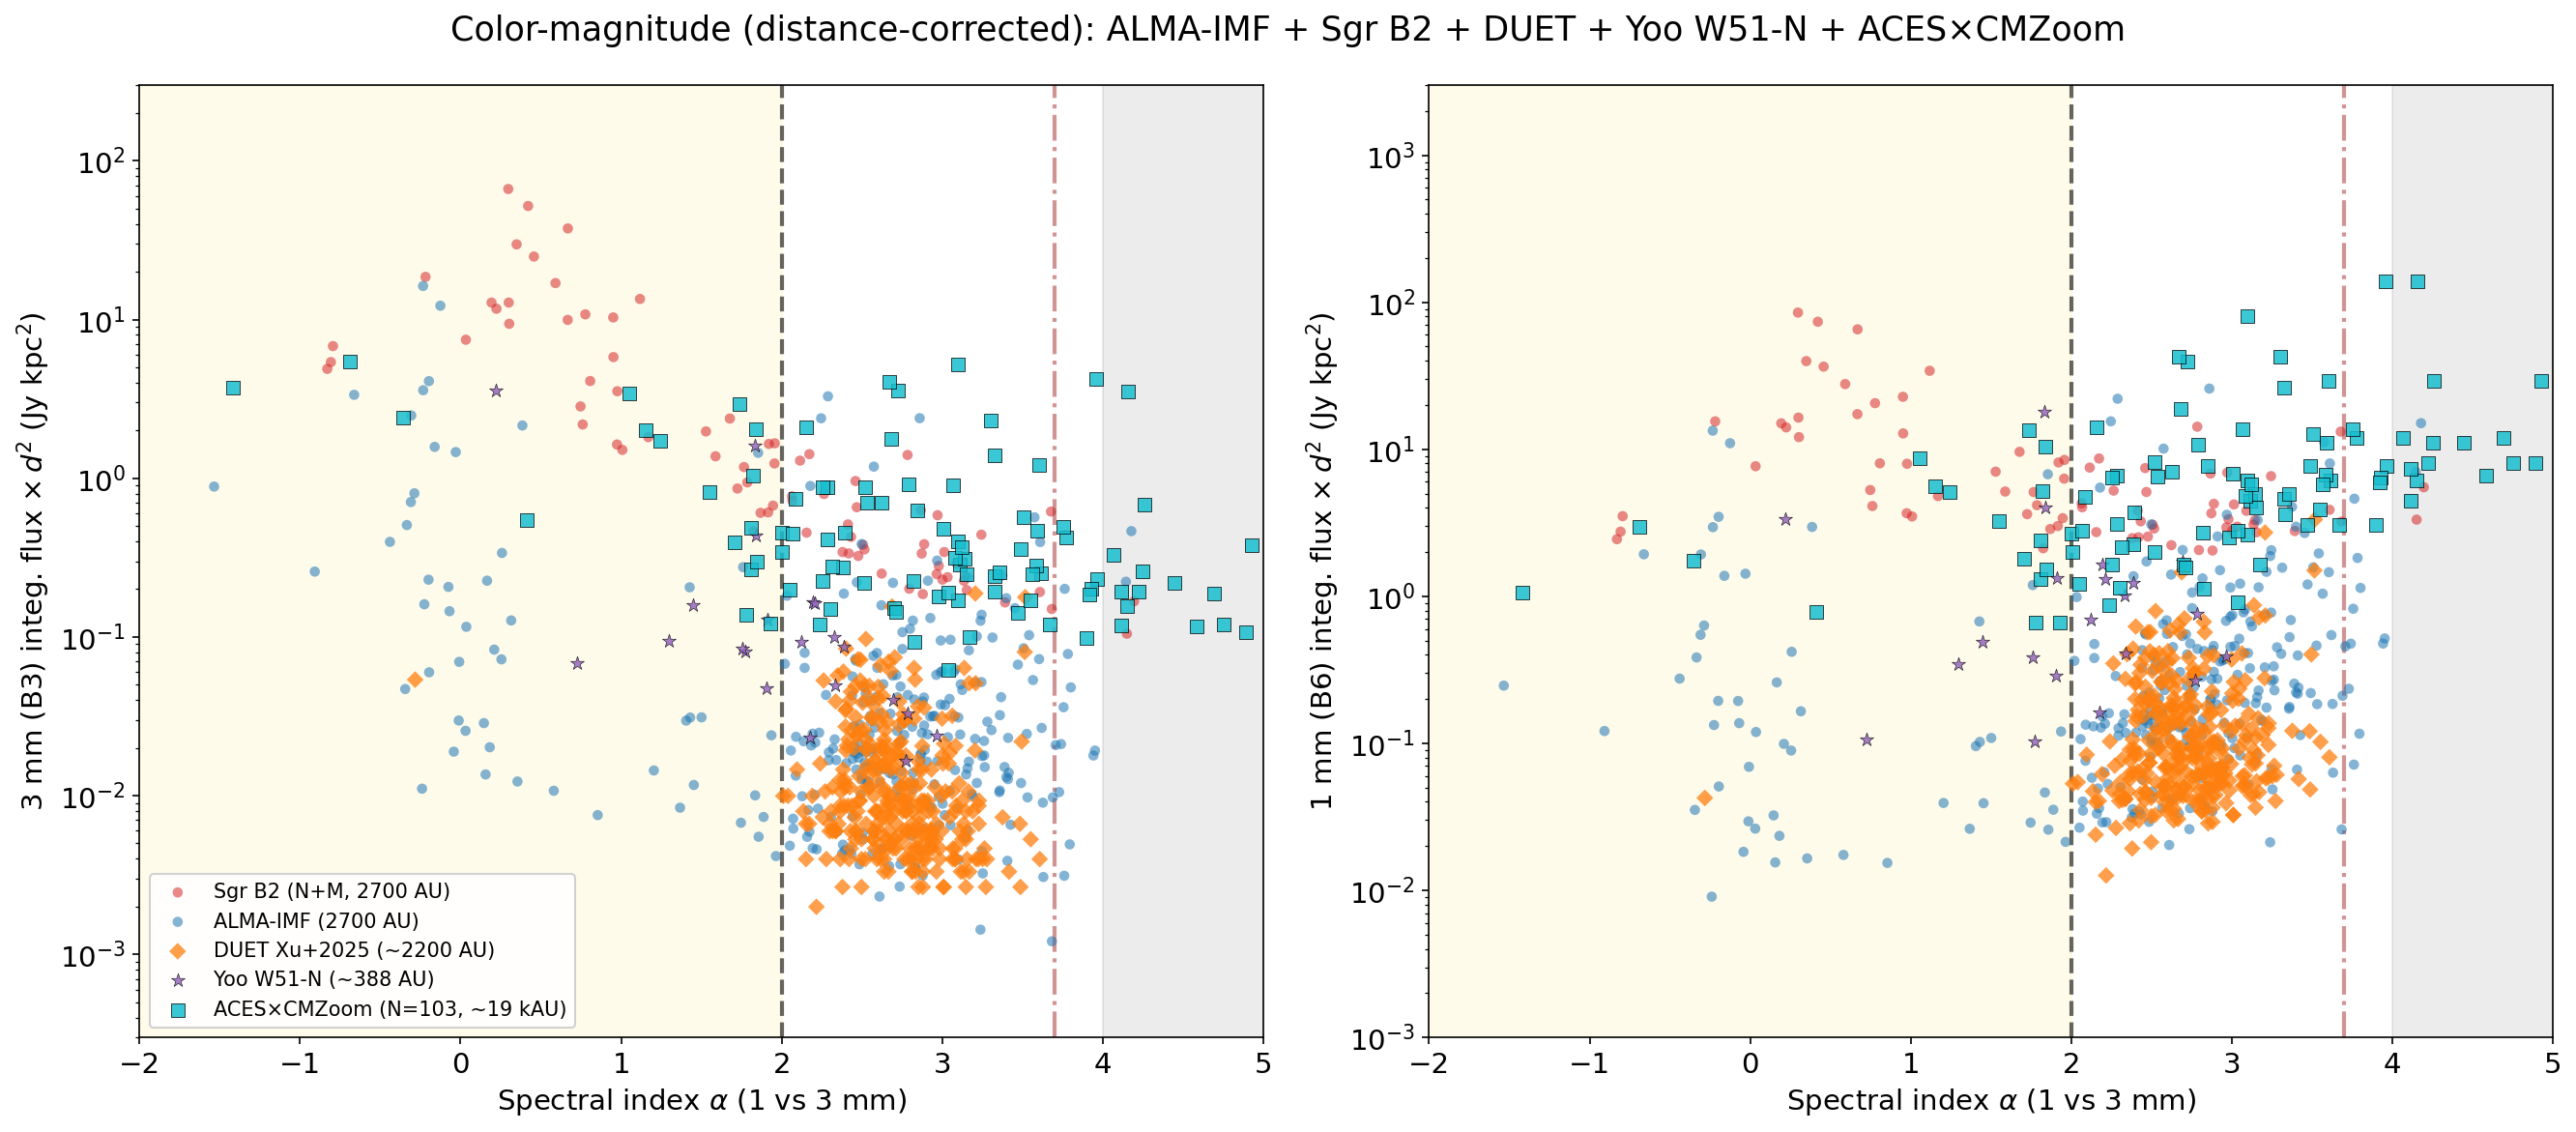
Budaiev, Yoo, Ginsburg (in prep)
Most stars form in dense regions
Lada & Lada 2003:
5-10% in bound clusters
in our Galaxy
5-10% in bound clusters
in our Galaxy
→
→
→
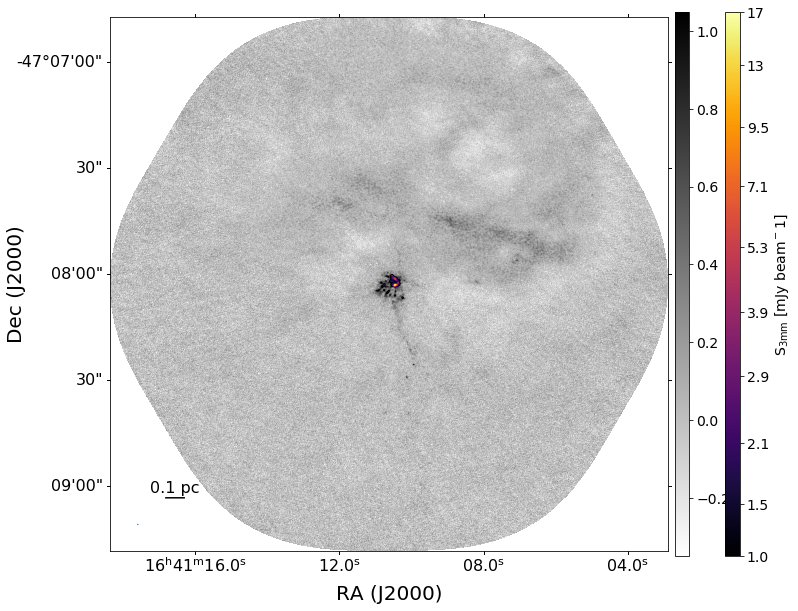
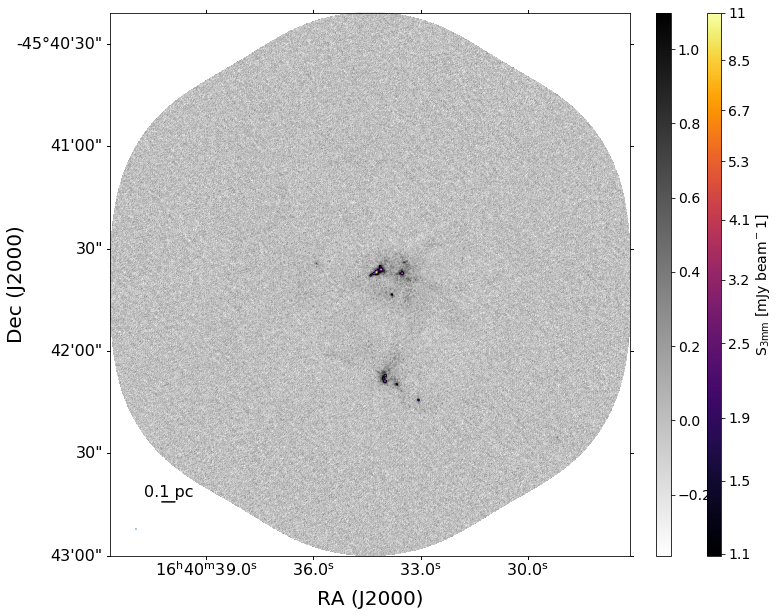
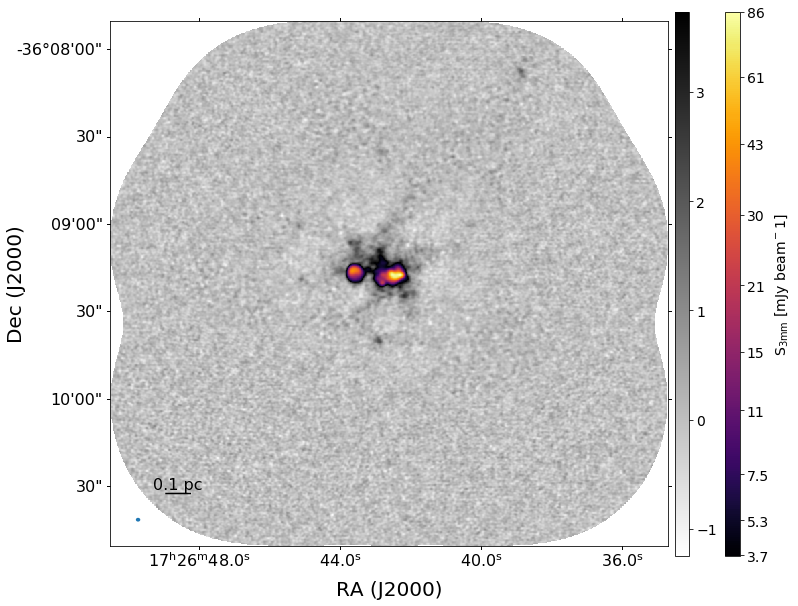
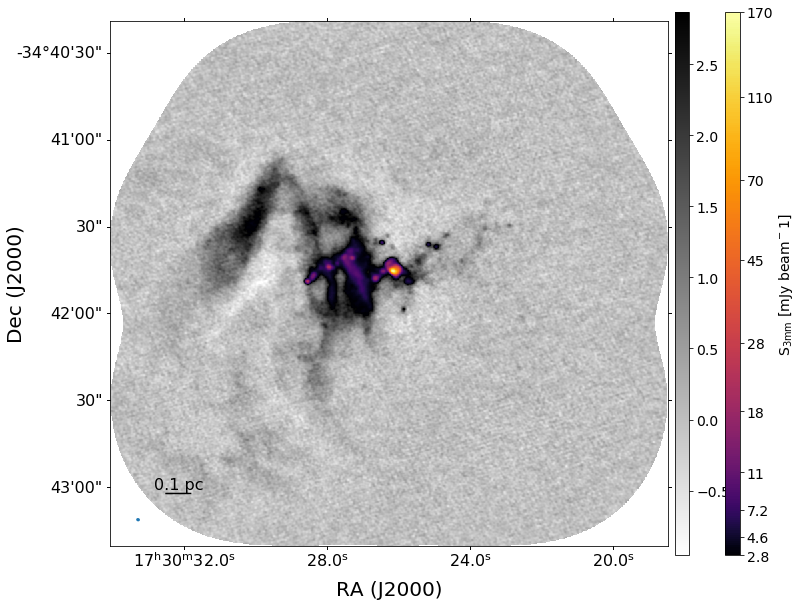
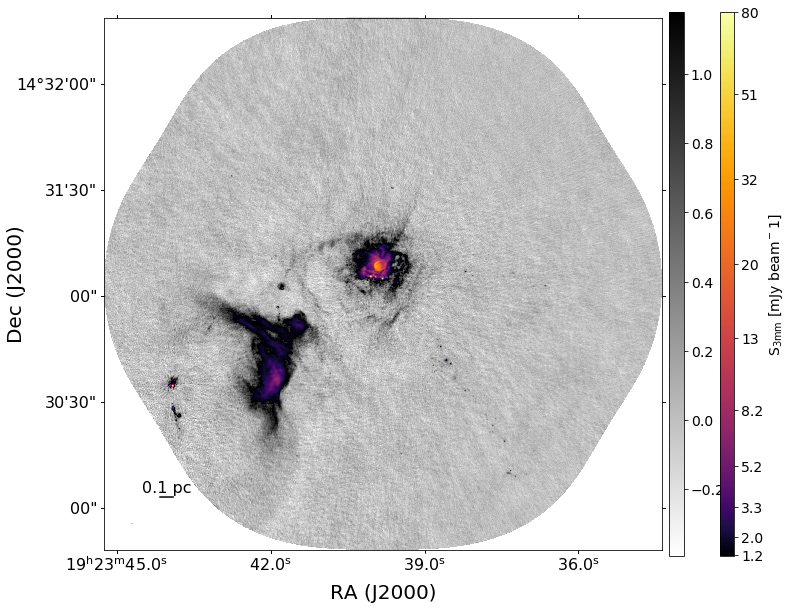
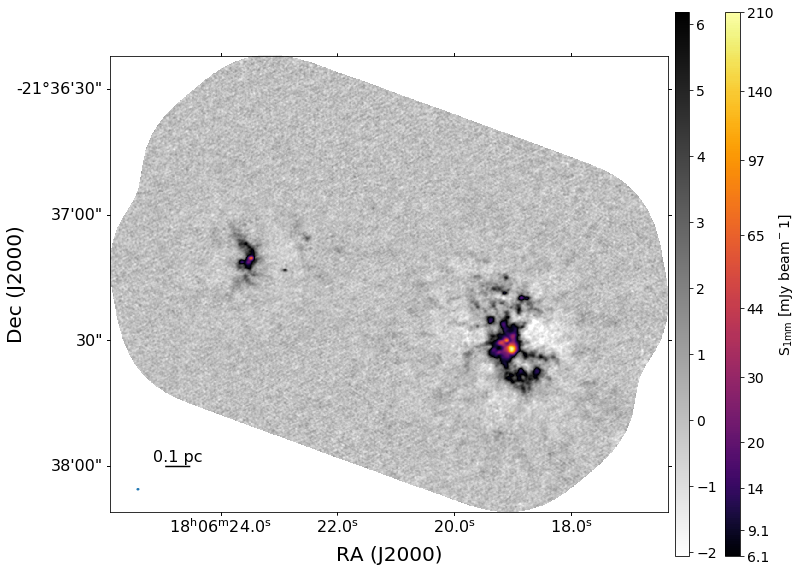
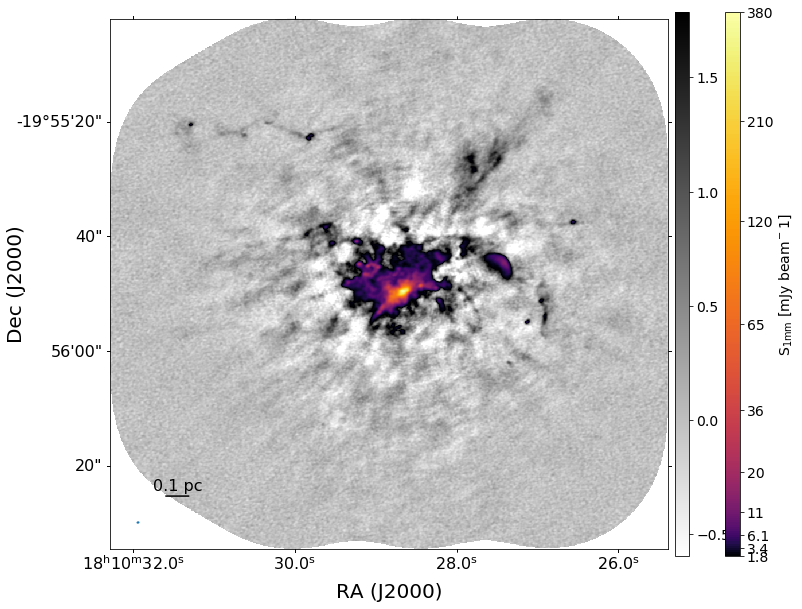
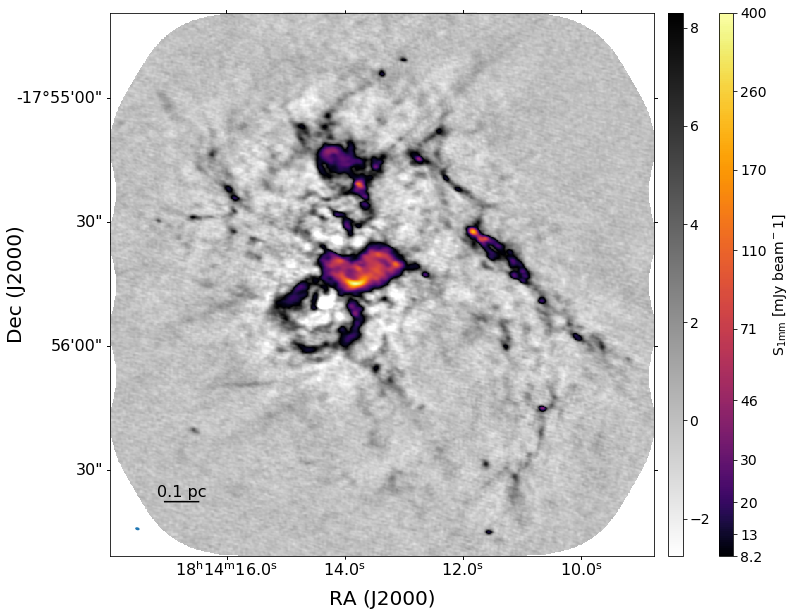
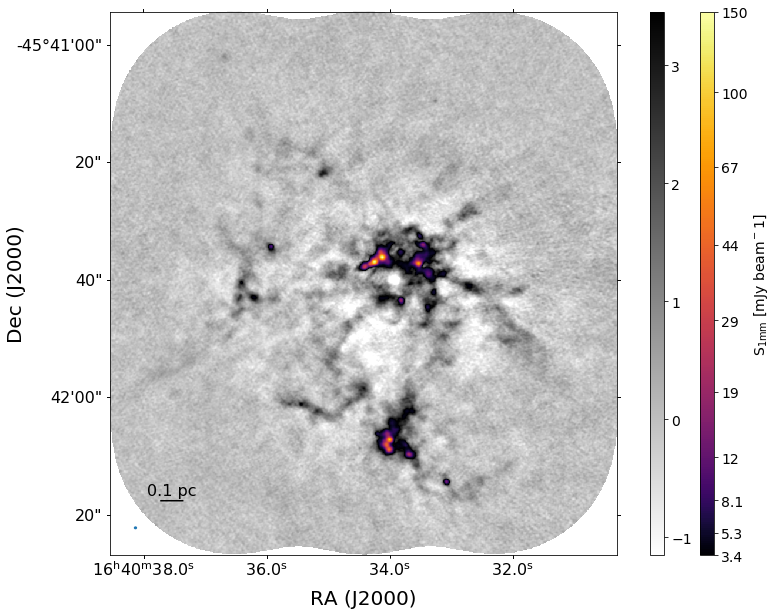
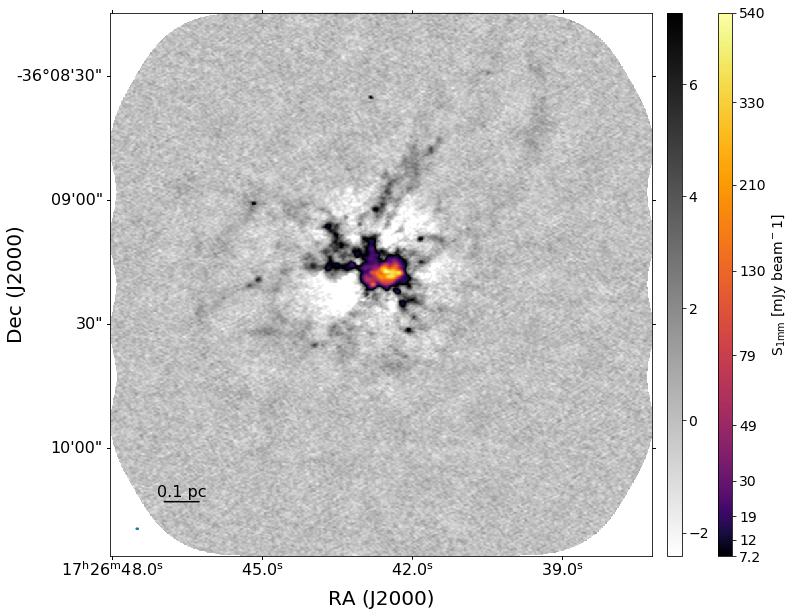
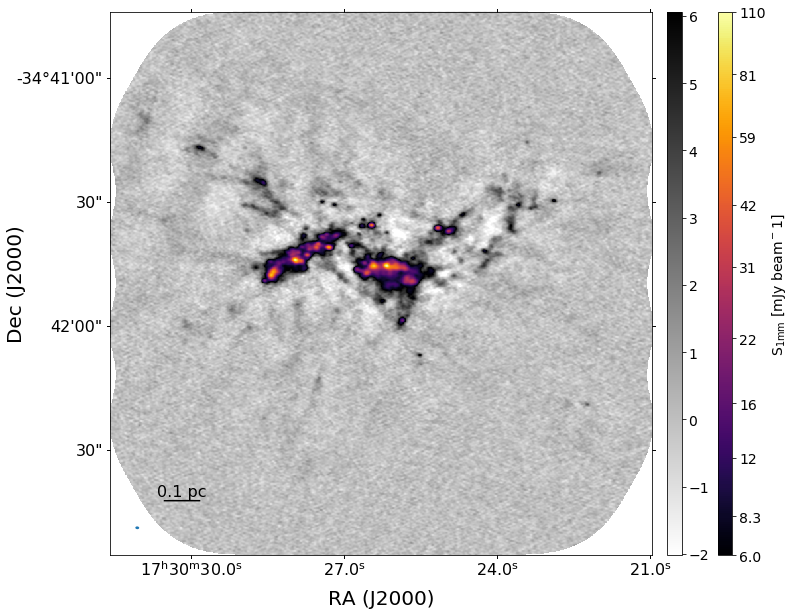
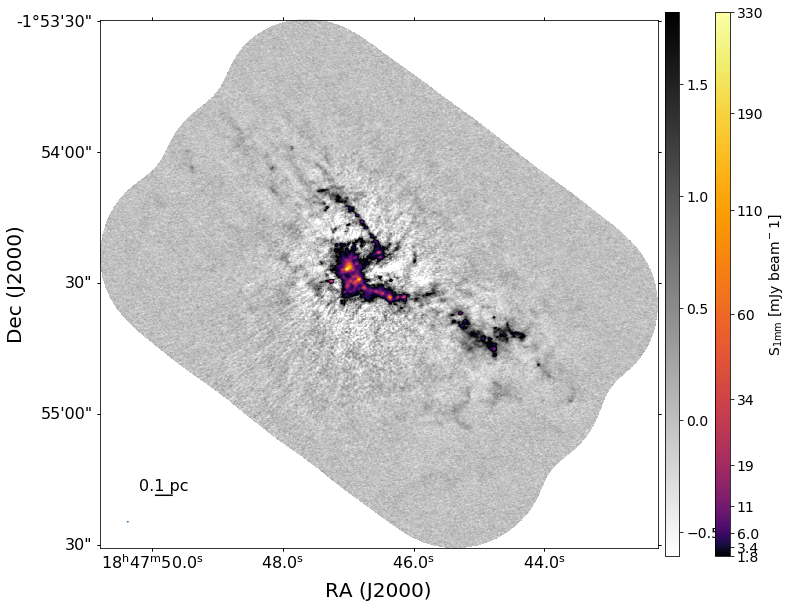
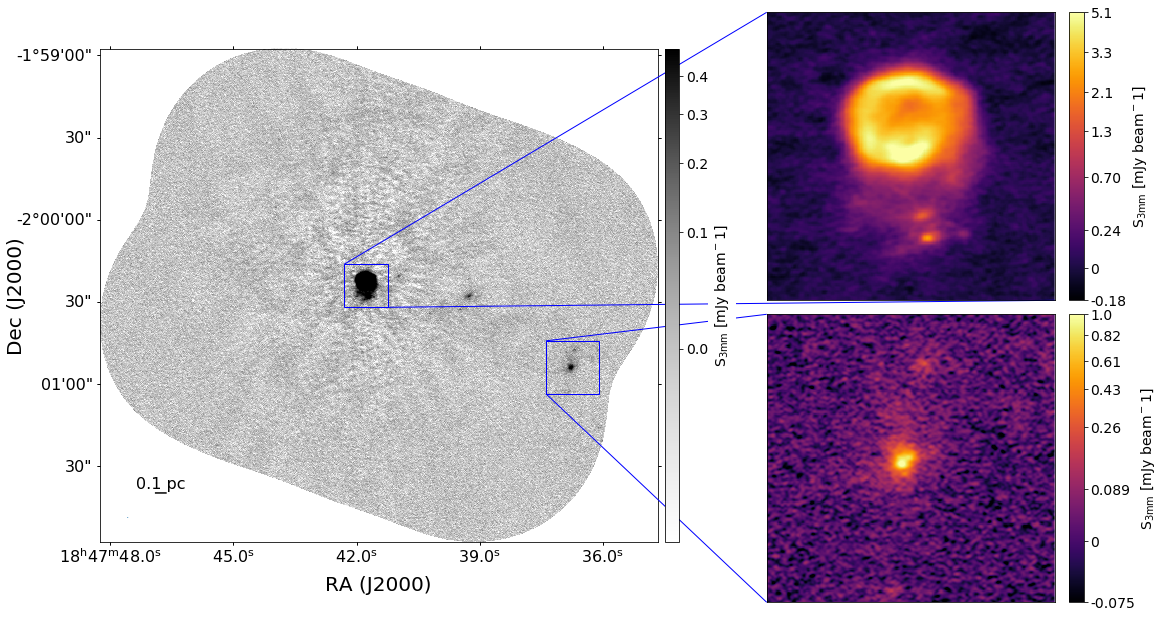
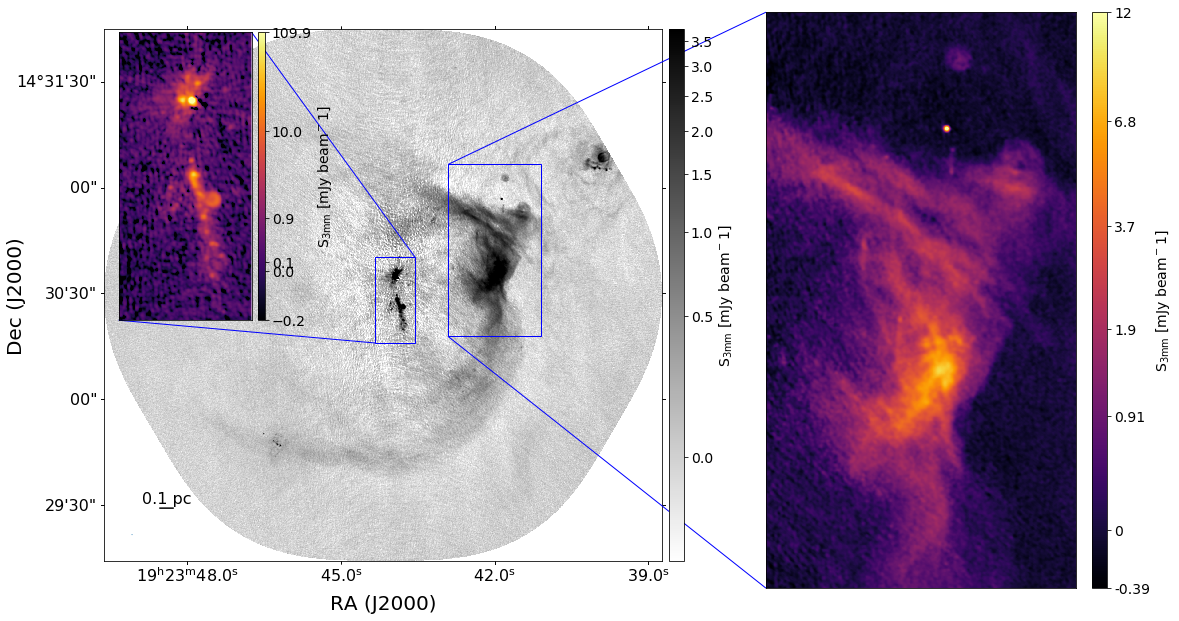
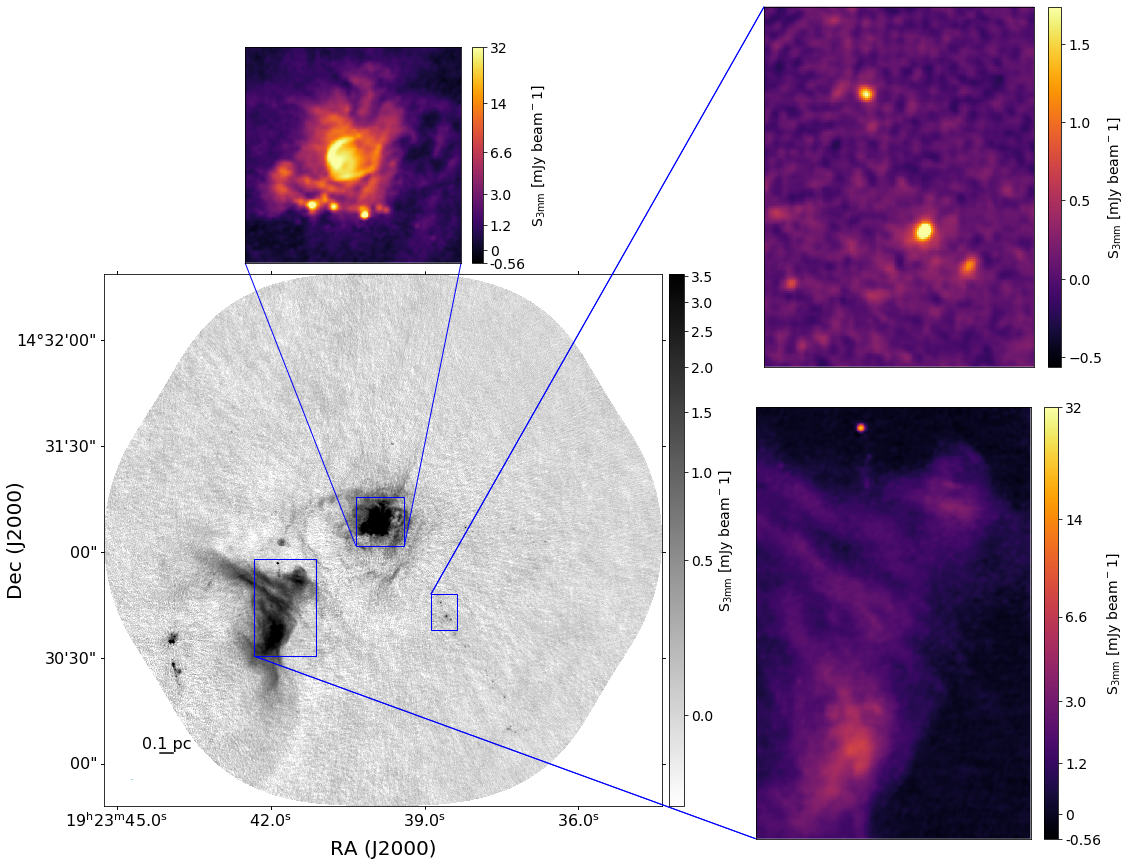
Massive star clusters are not isolated
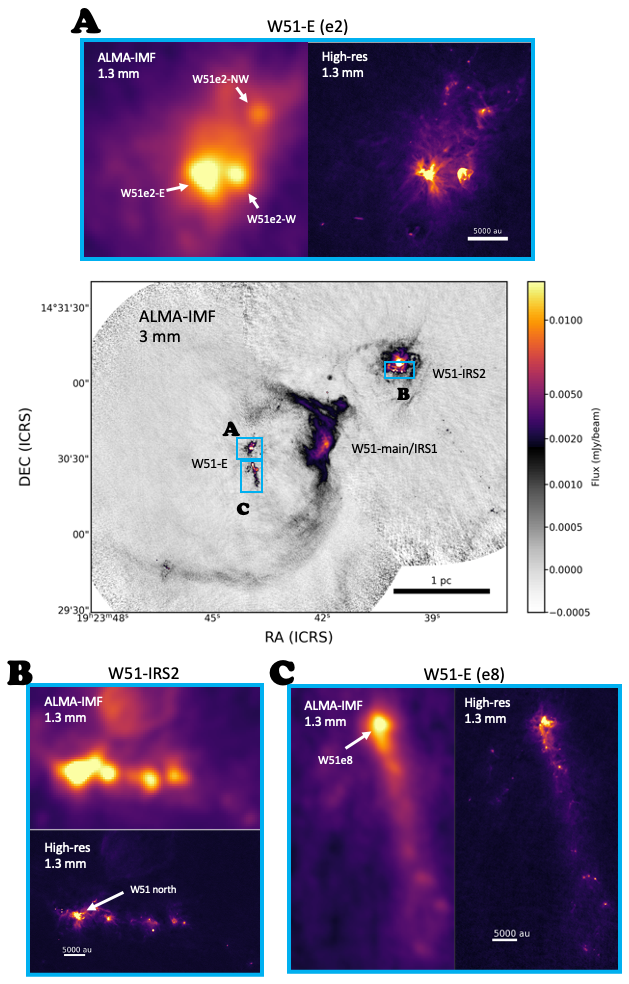
IRS 2
Main
Massive star clusters are not isolated
Massive star clusters are not isolated
forming cluster [ALMA] alongside the giant HII region
Cores fragment.
Massive stars cook their neighbors in hot cores.

Hot Cores
Hot cores are chemically rich sites of high-mass star formation.
Bounded at ~100 K
Bounded at ~100 K
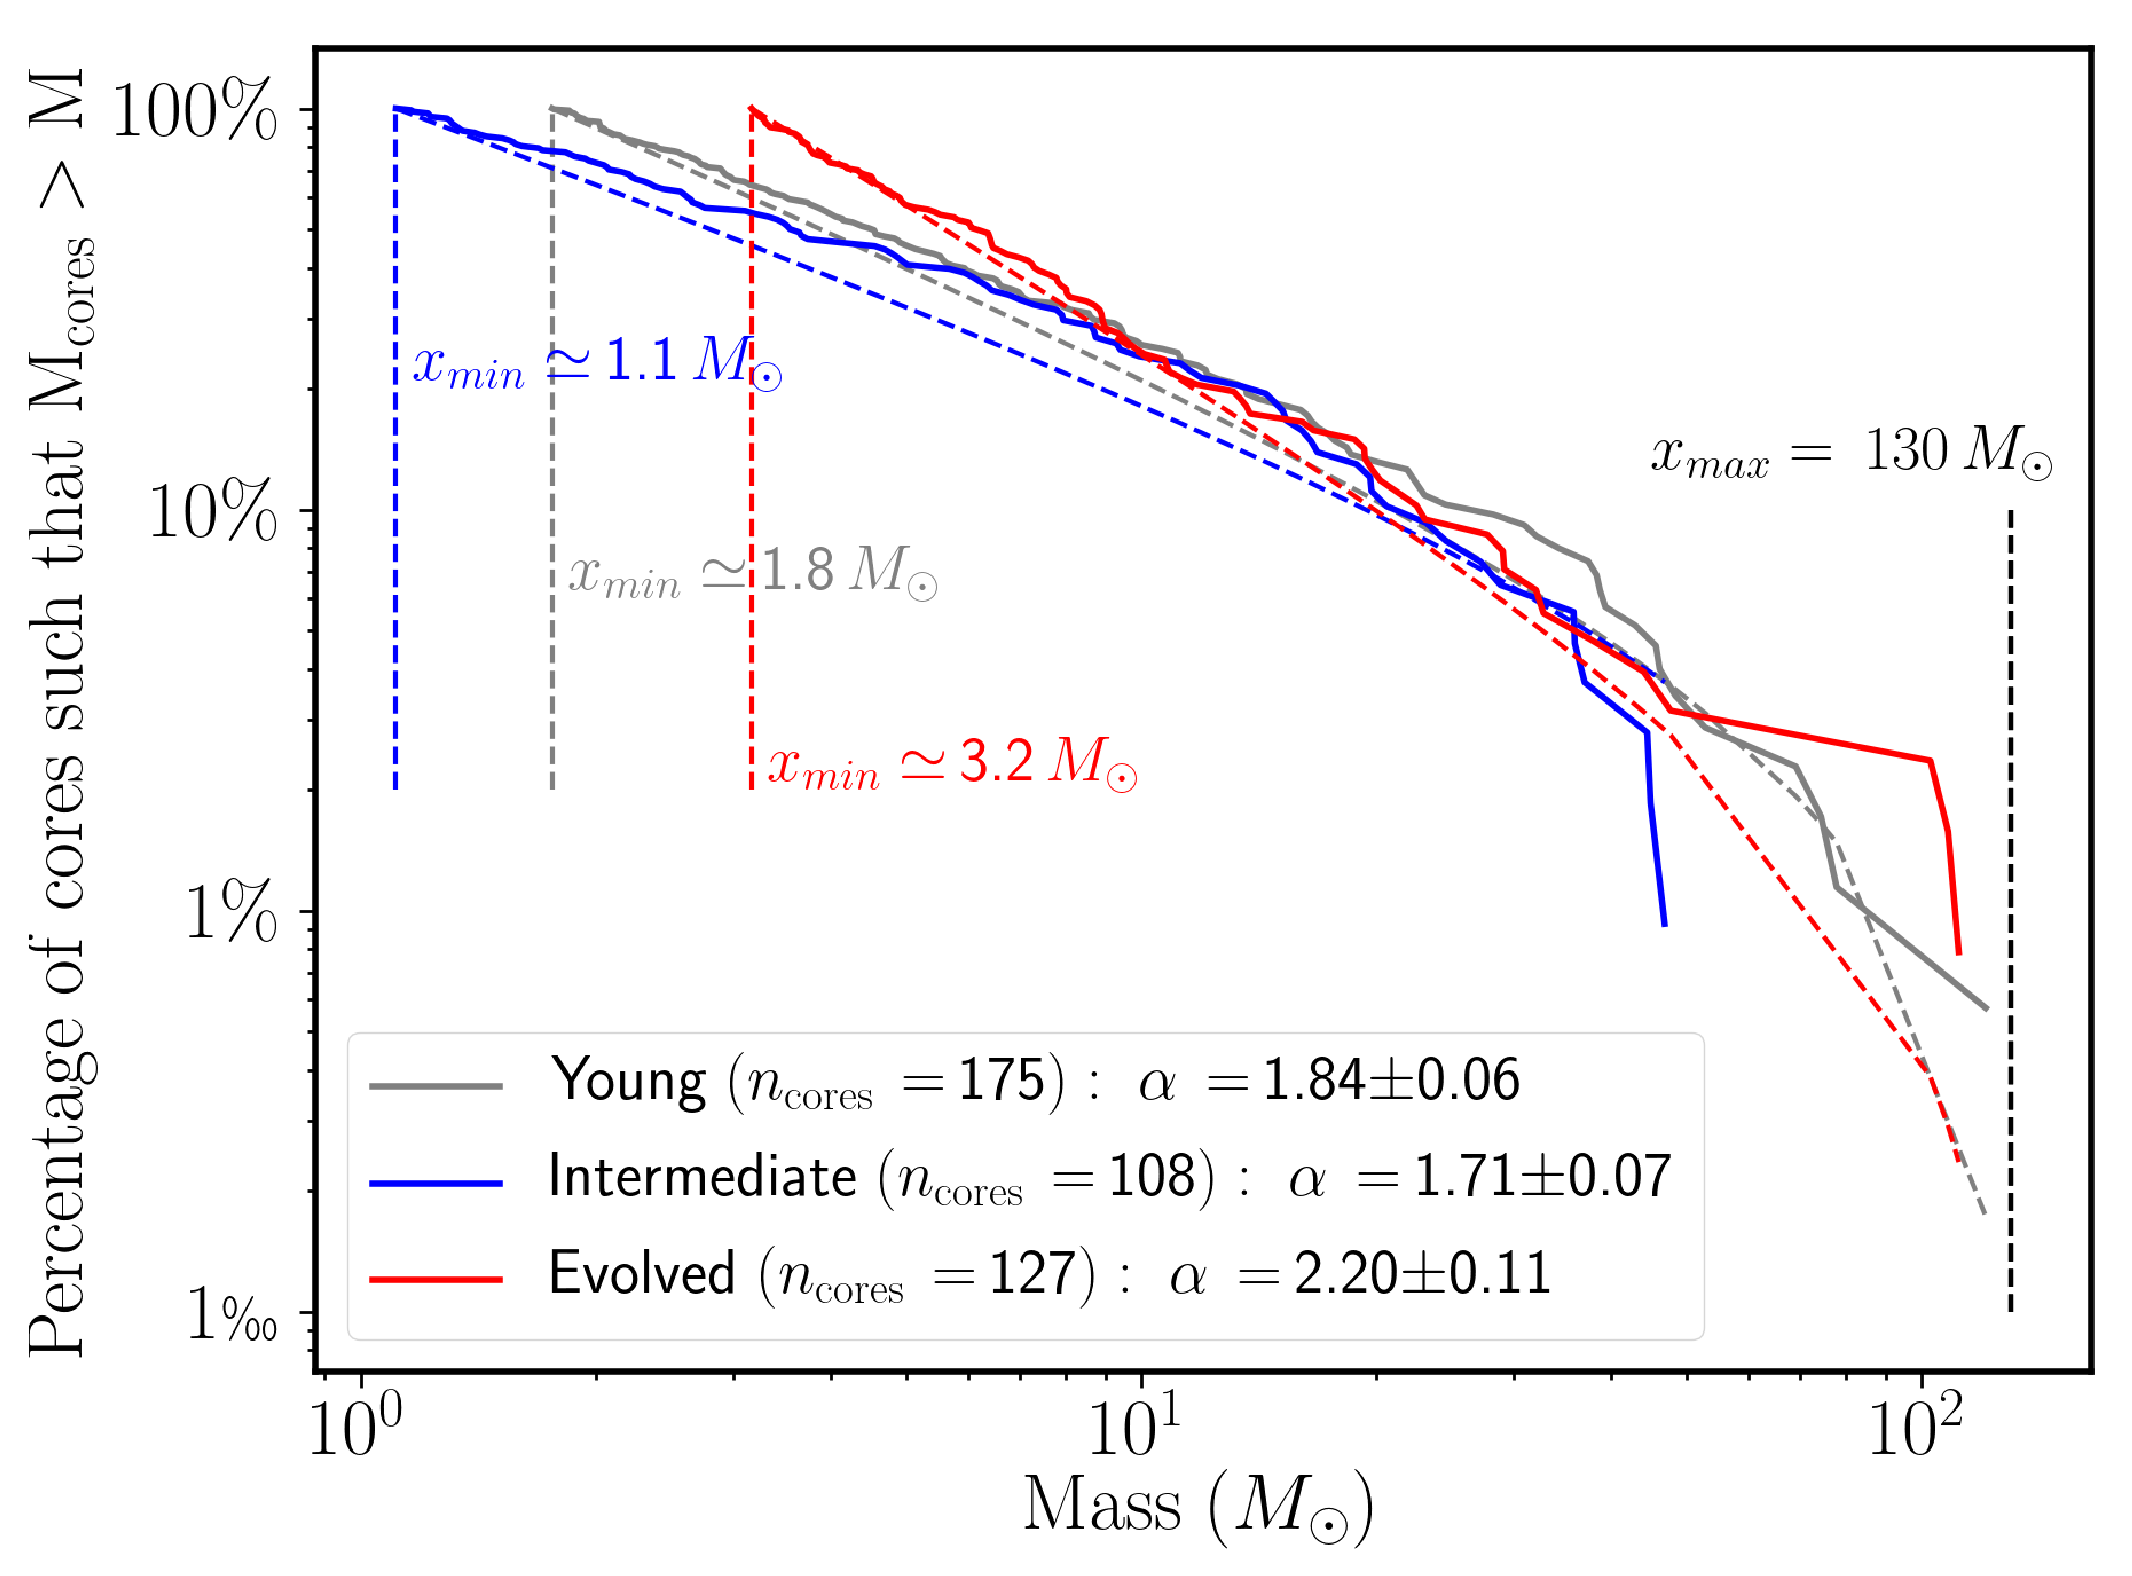
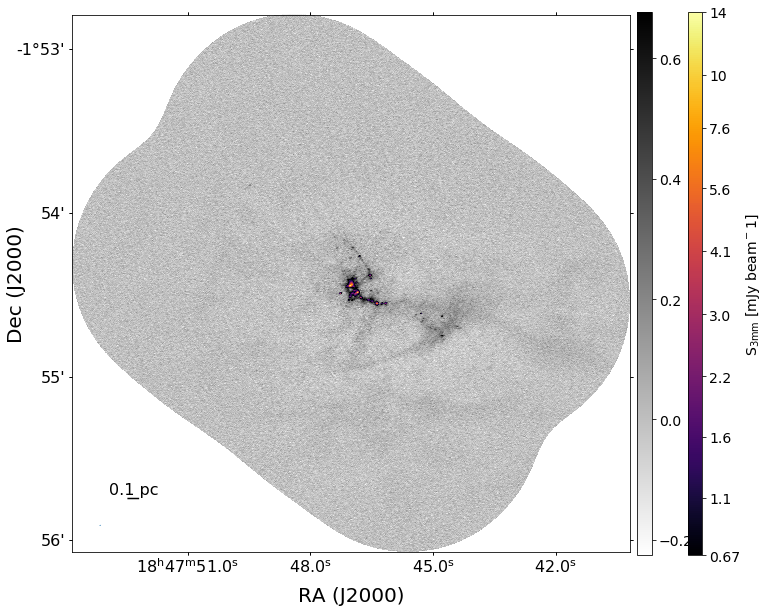
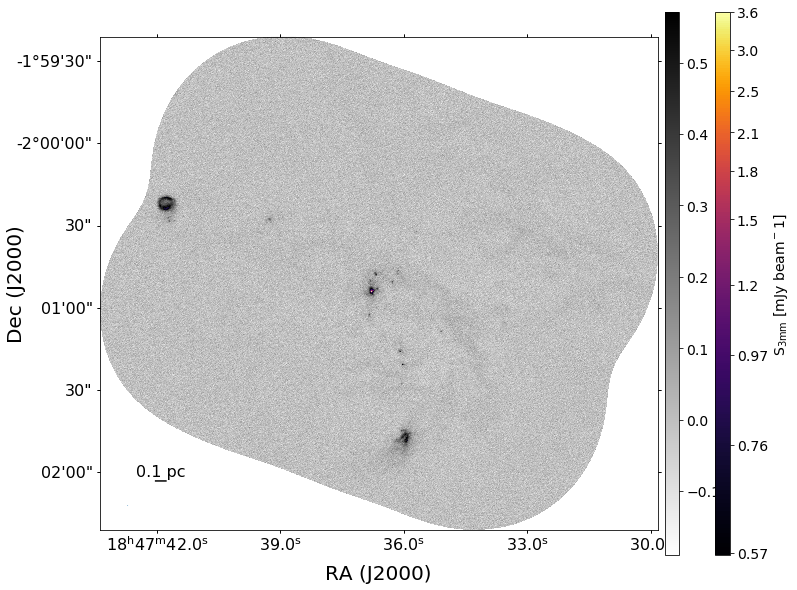
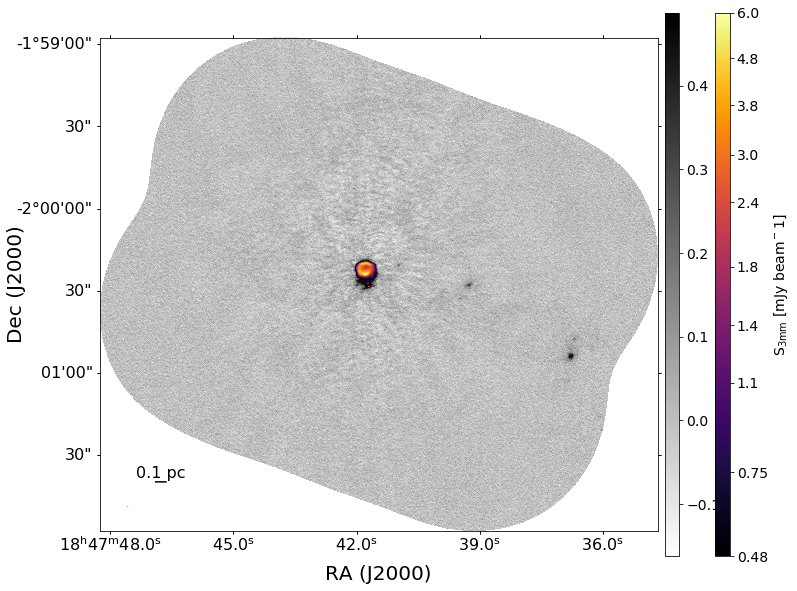
Our program: Cores → YSOs
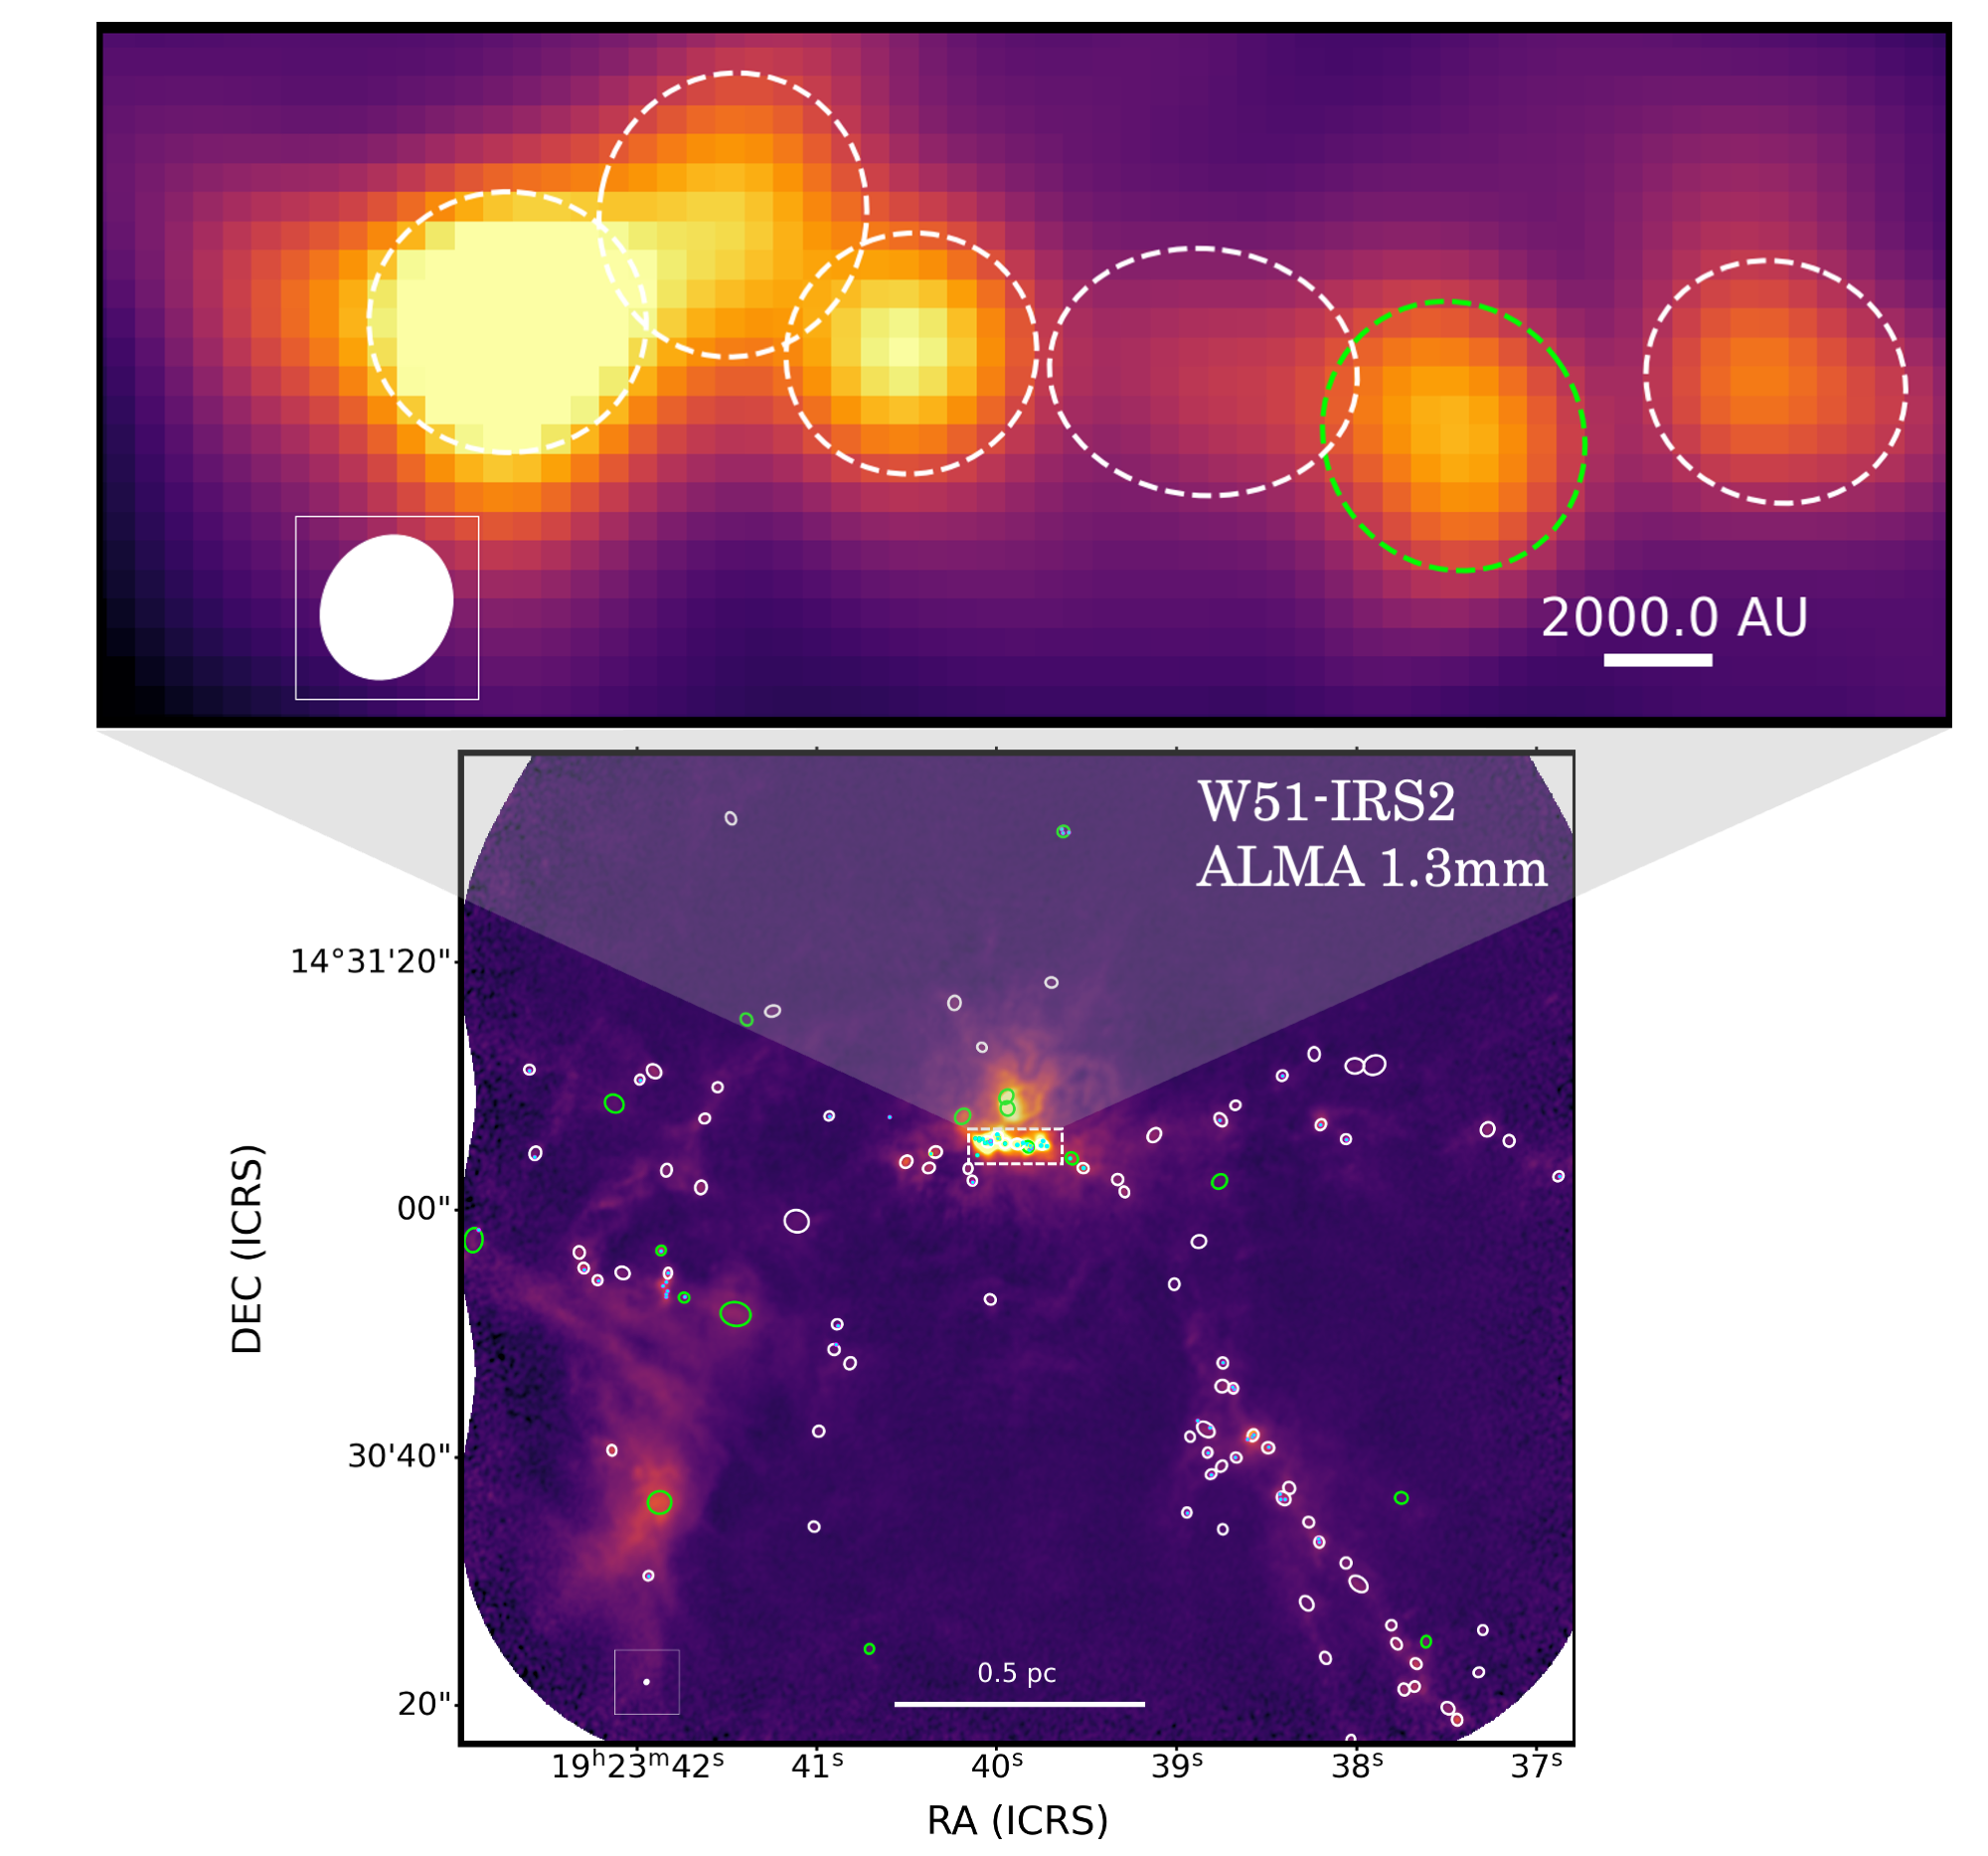
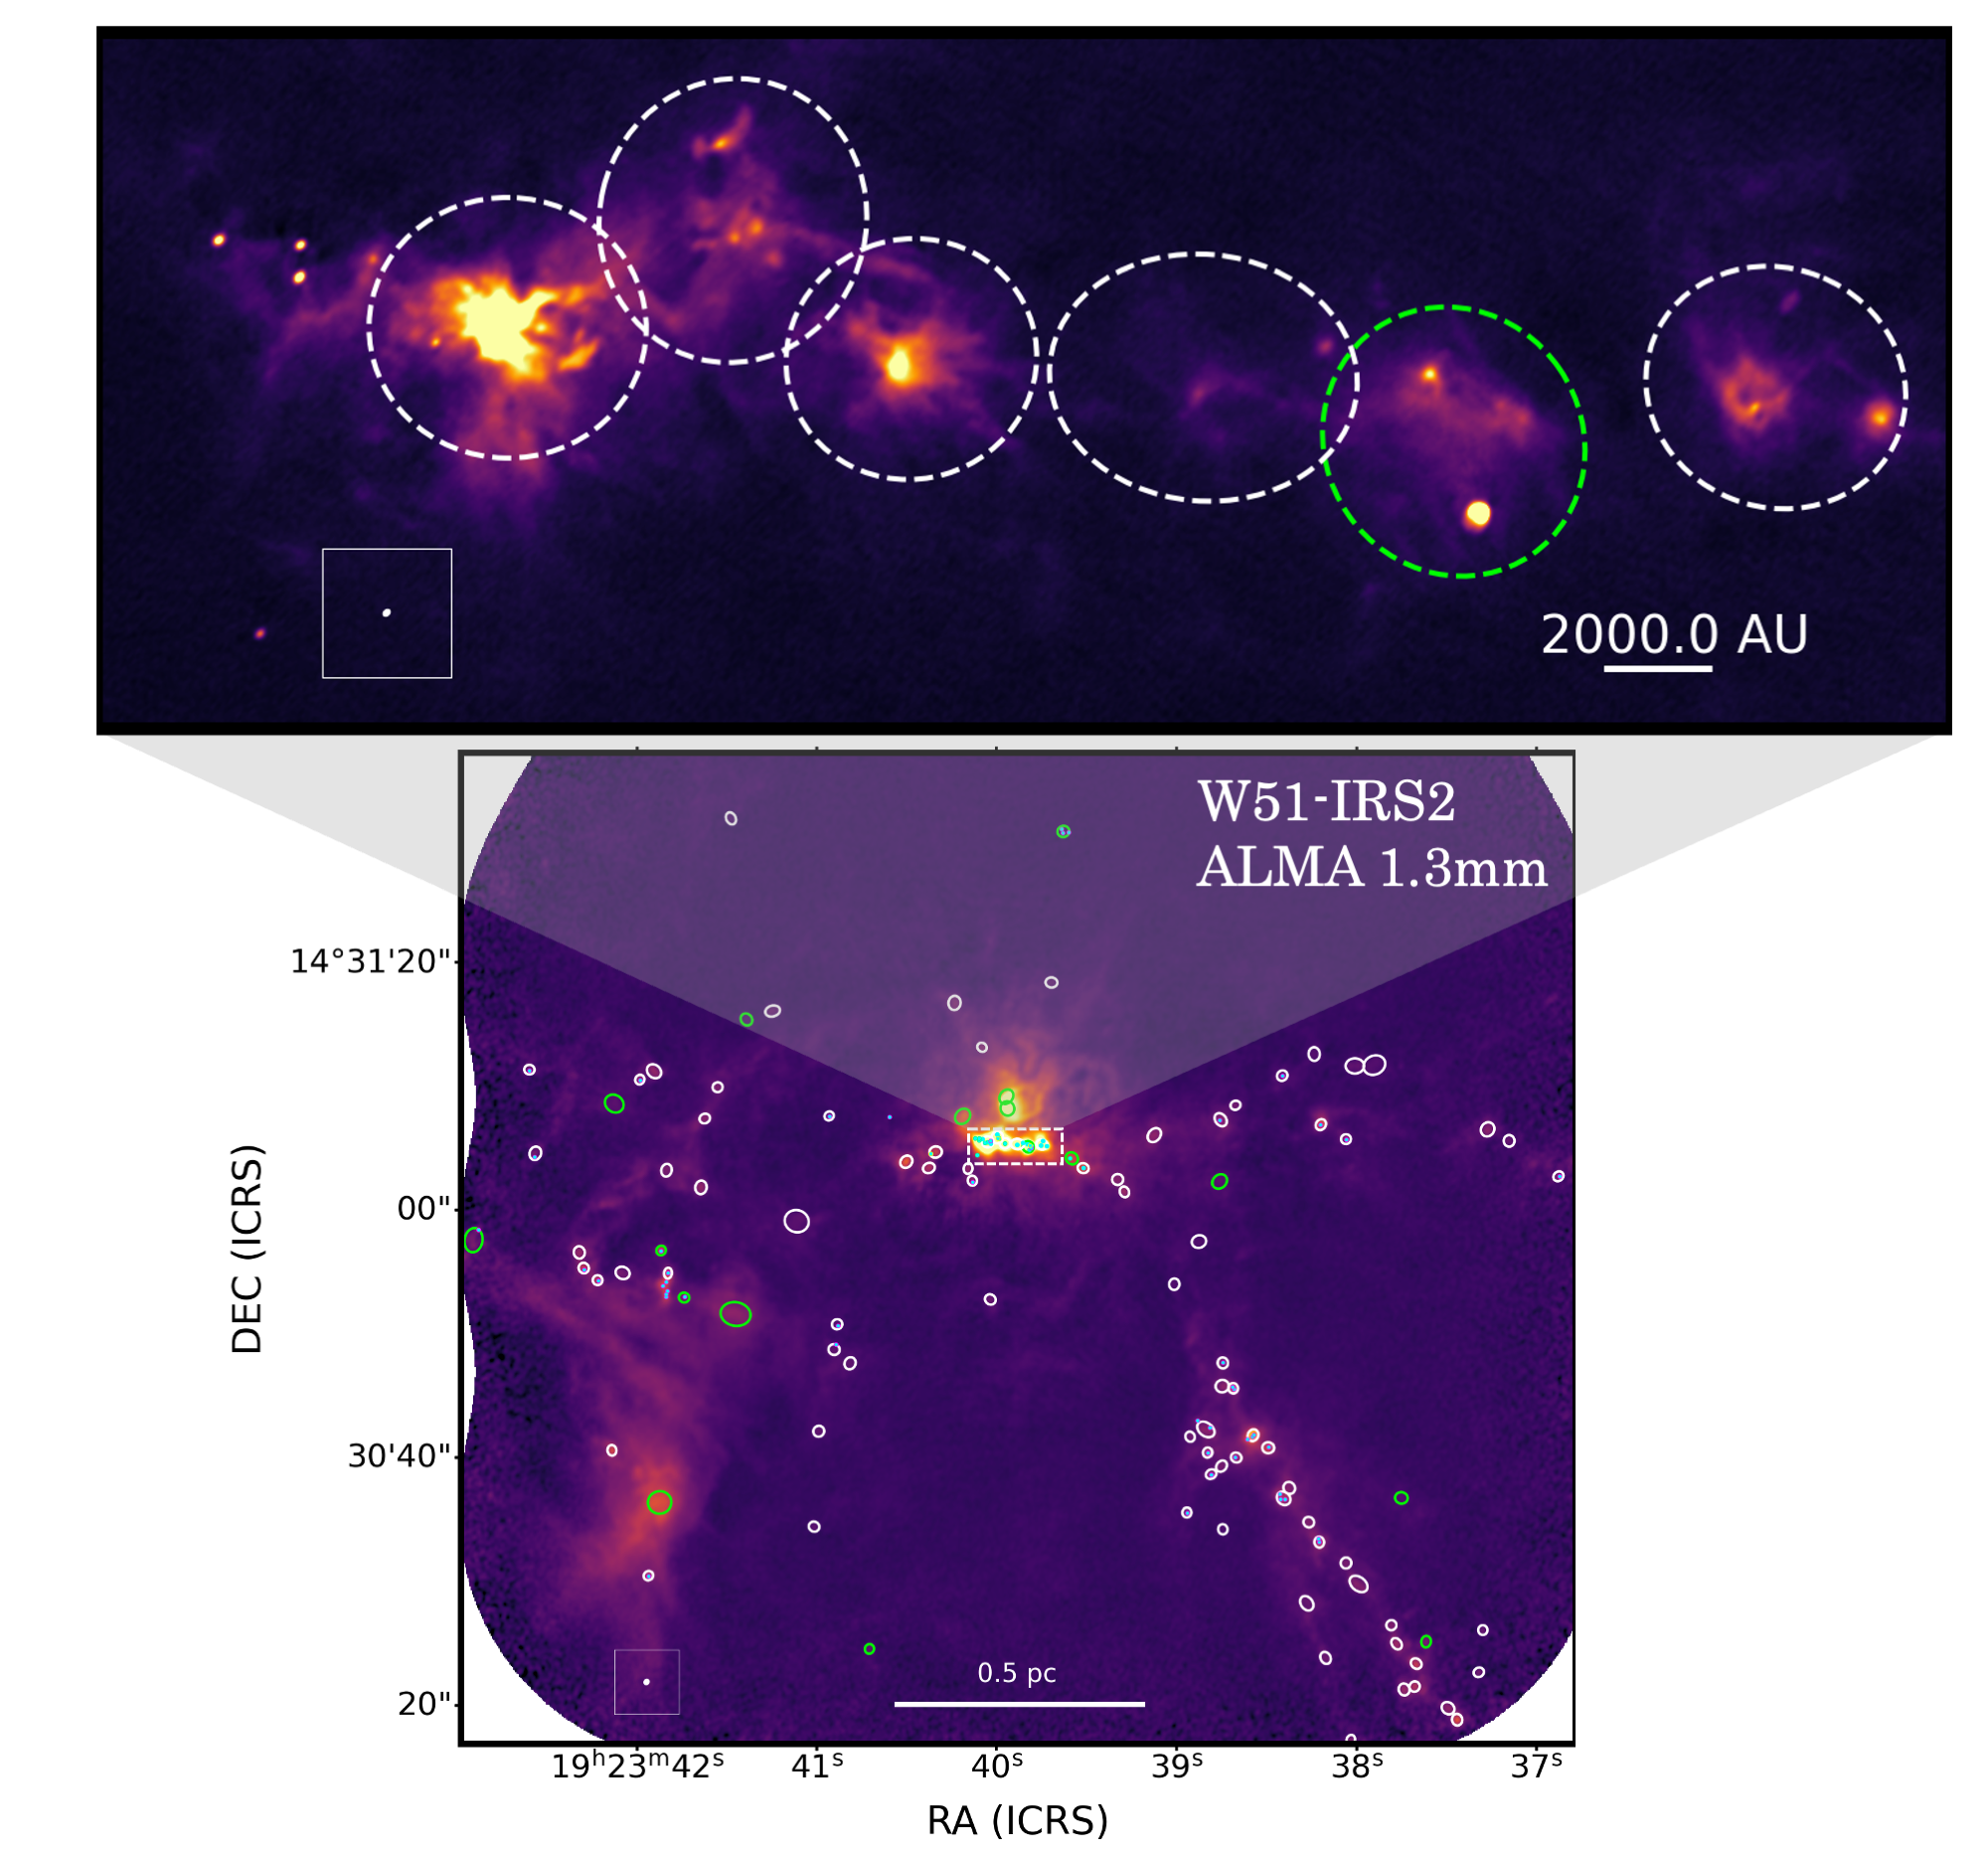
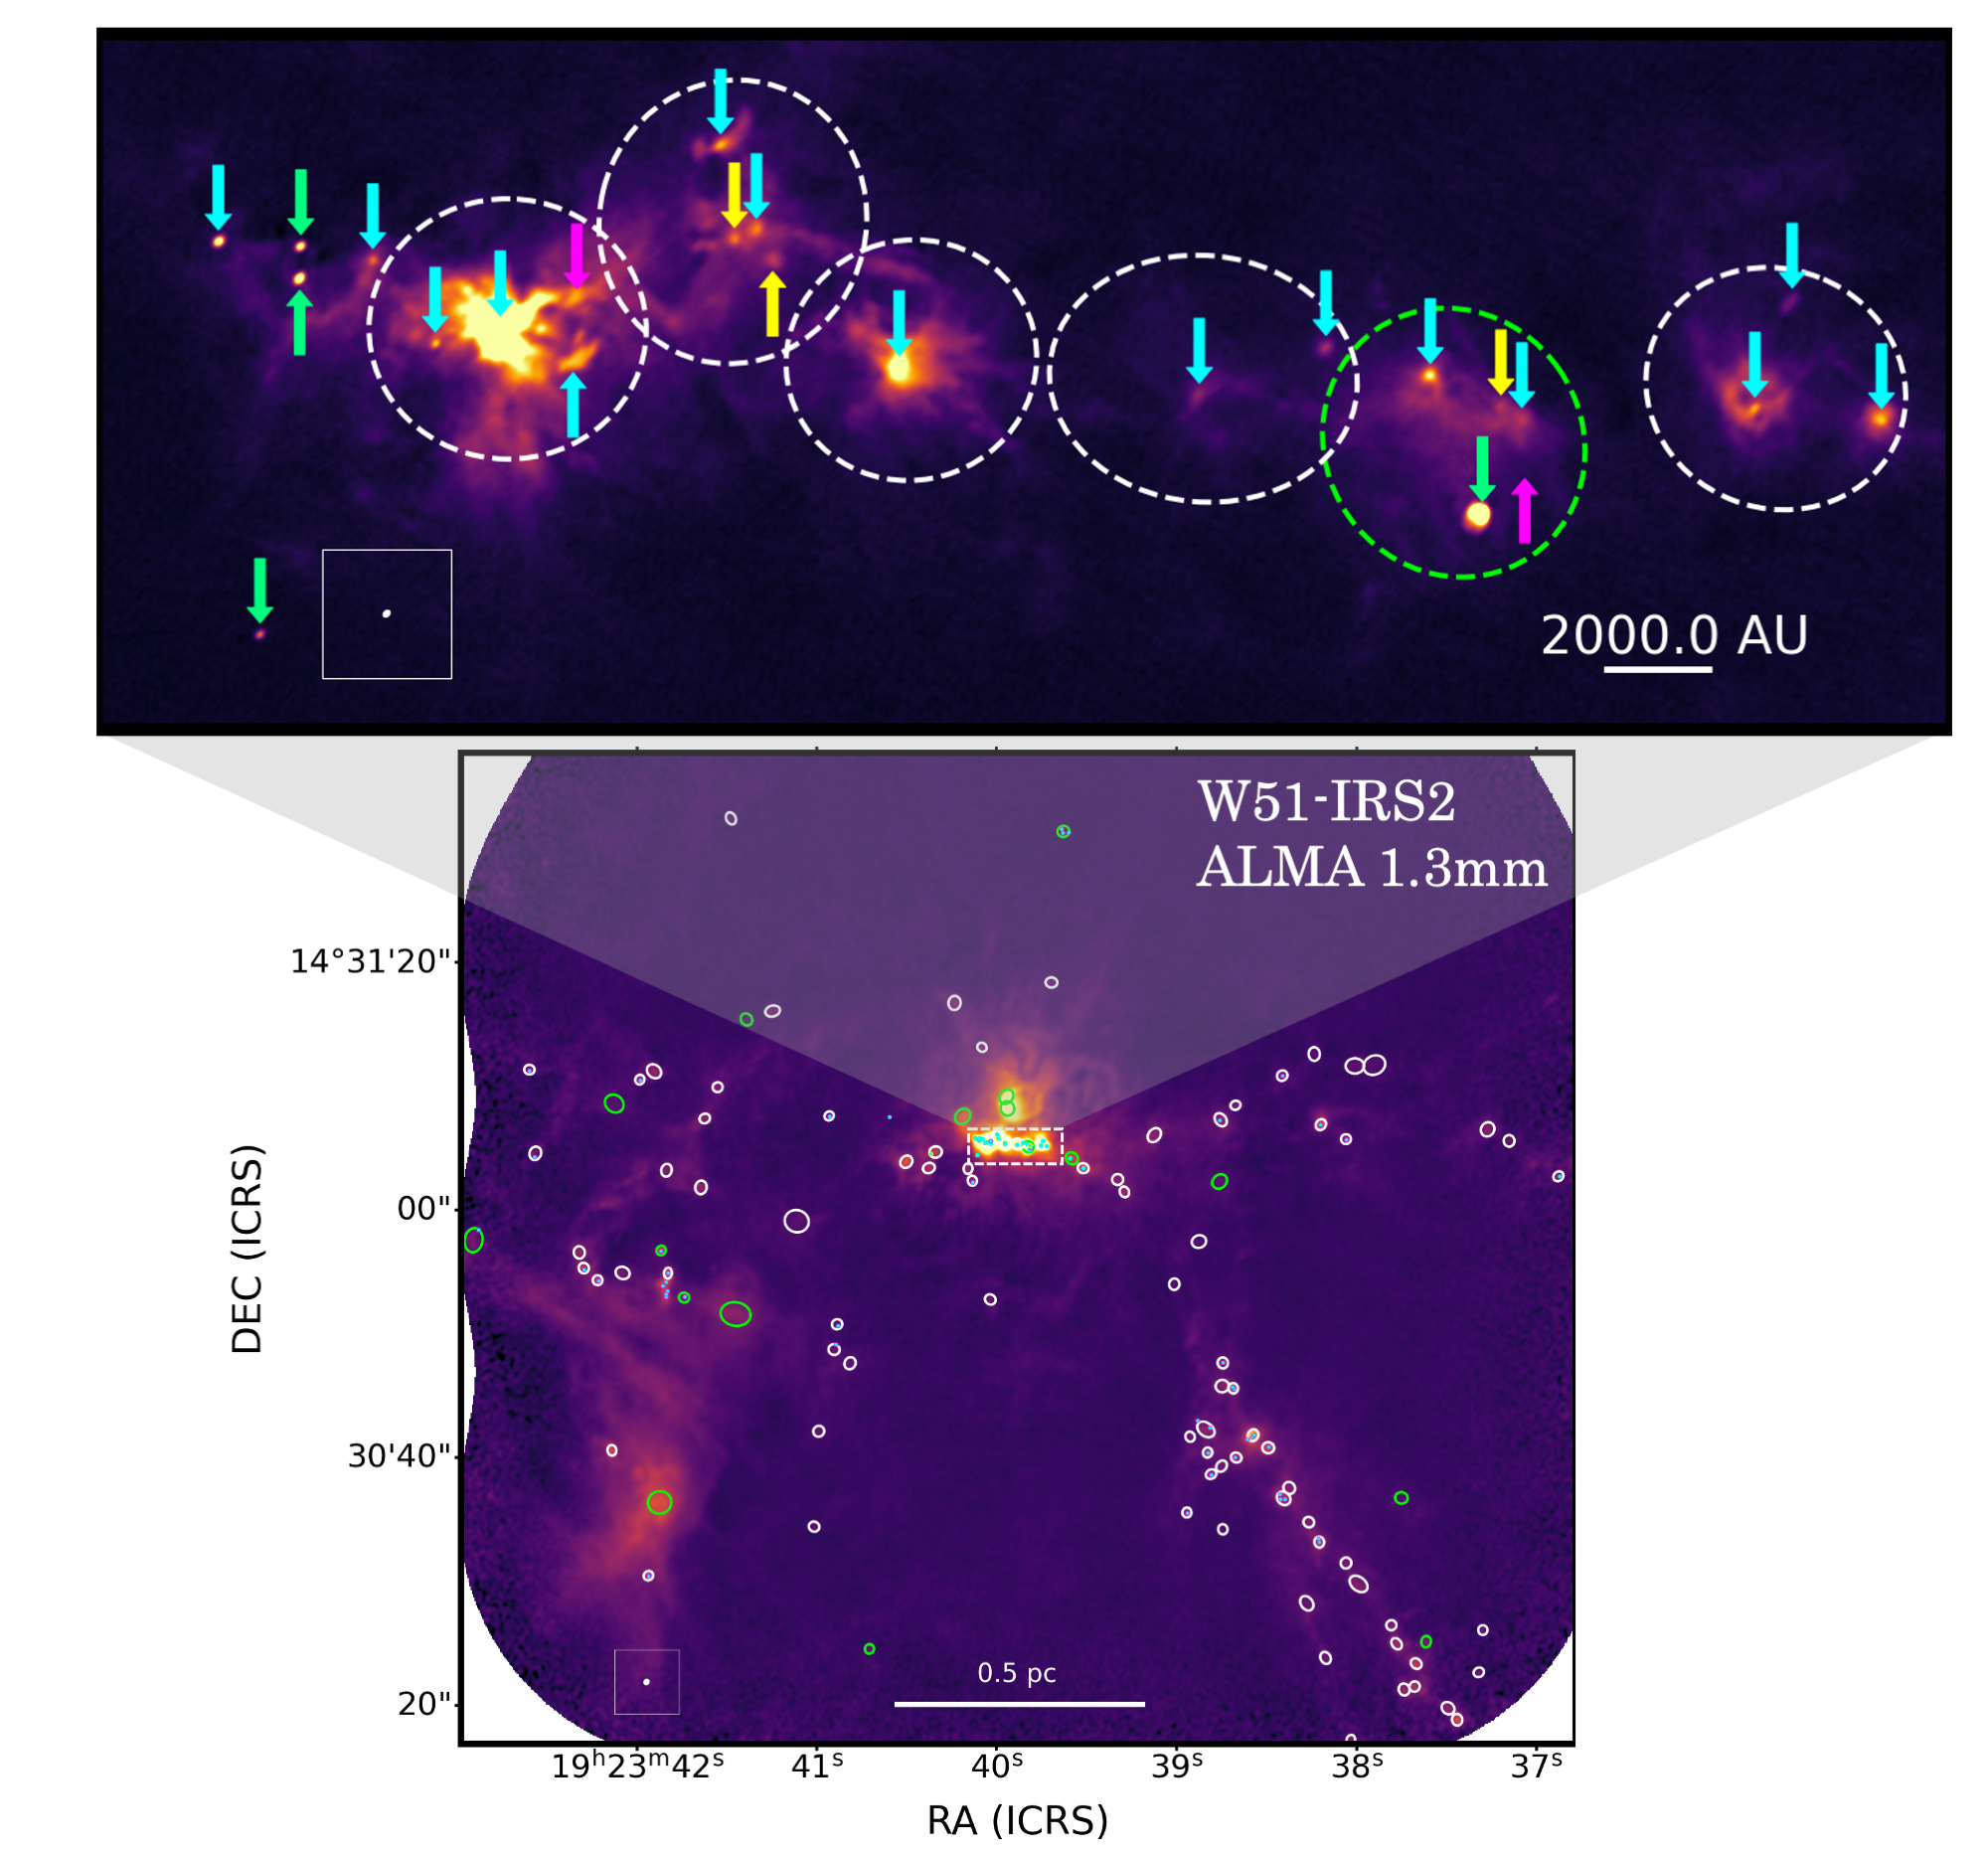

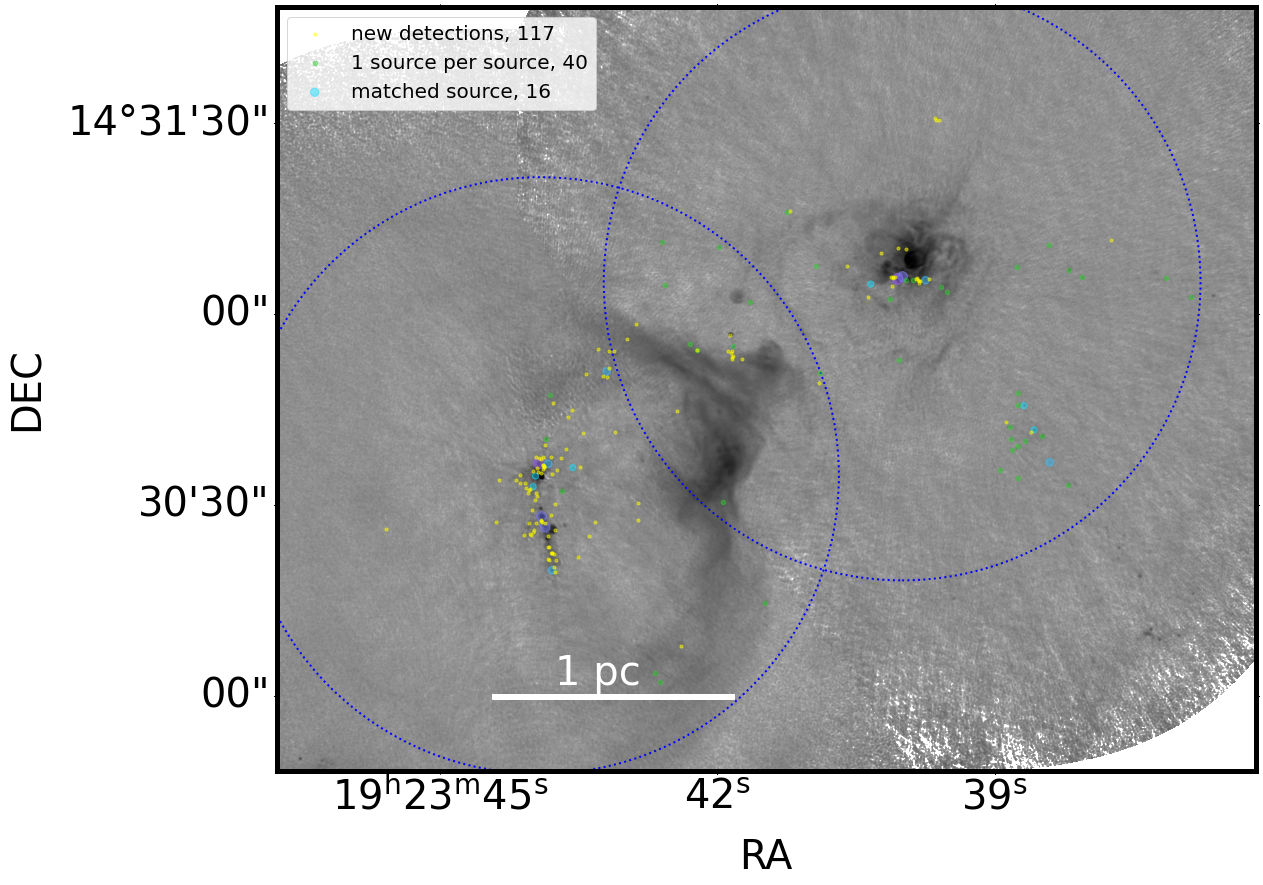
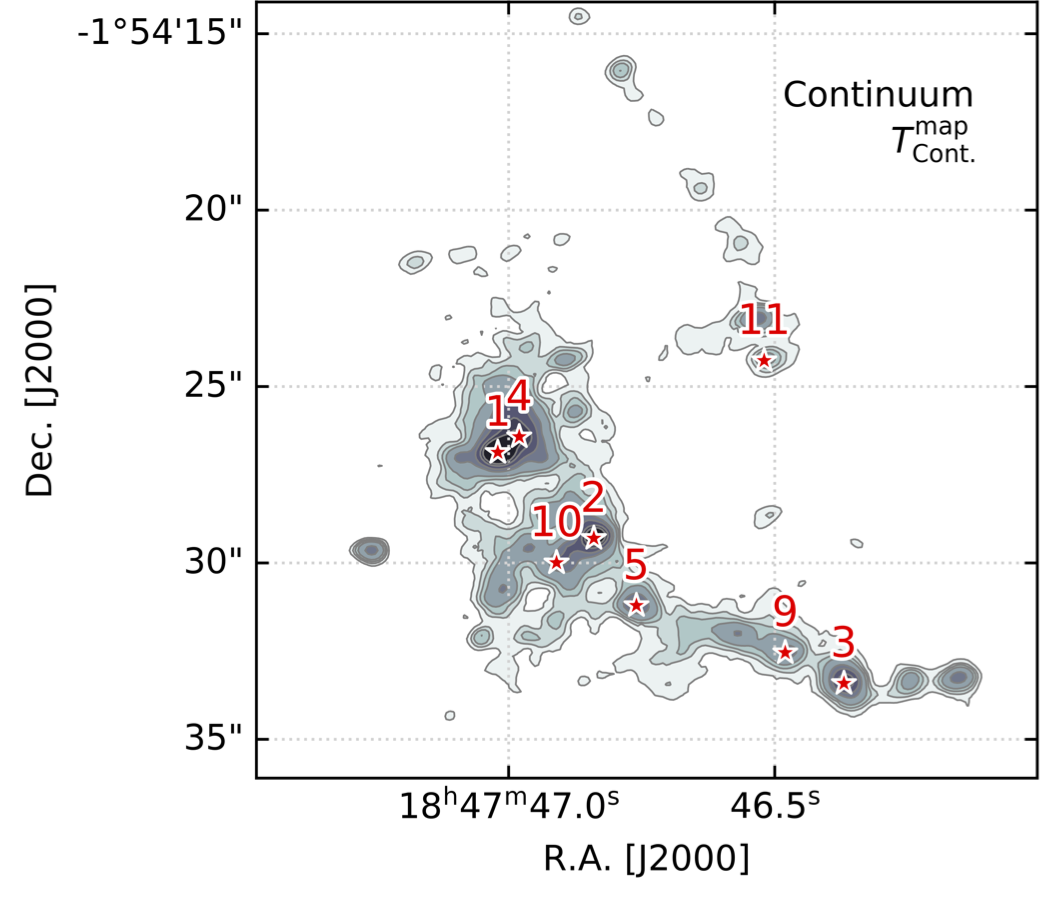
(no YSO, 1 YSO, >1 YSO) = (25%, 30%, 45%) W51-E, (53%, 39%, 8%) IRS2
Taehwa Yoo+: fragmentation
toward W51
toward W51
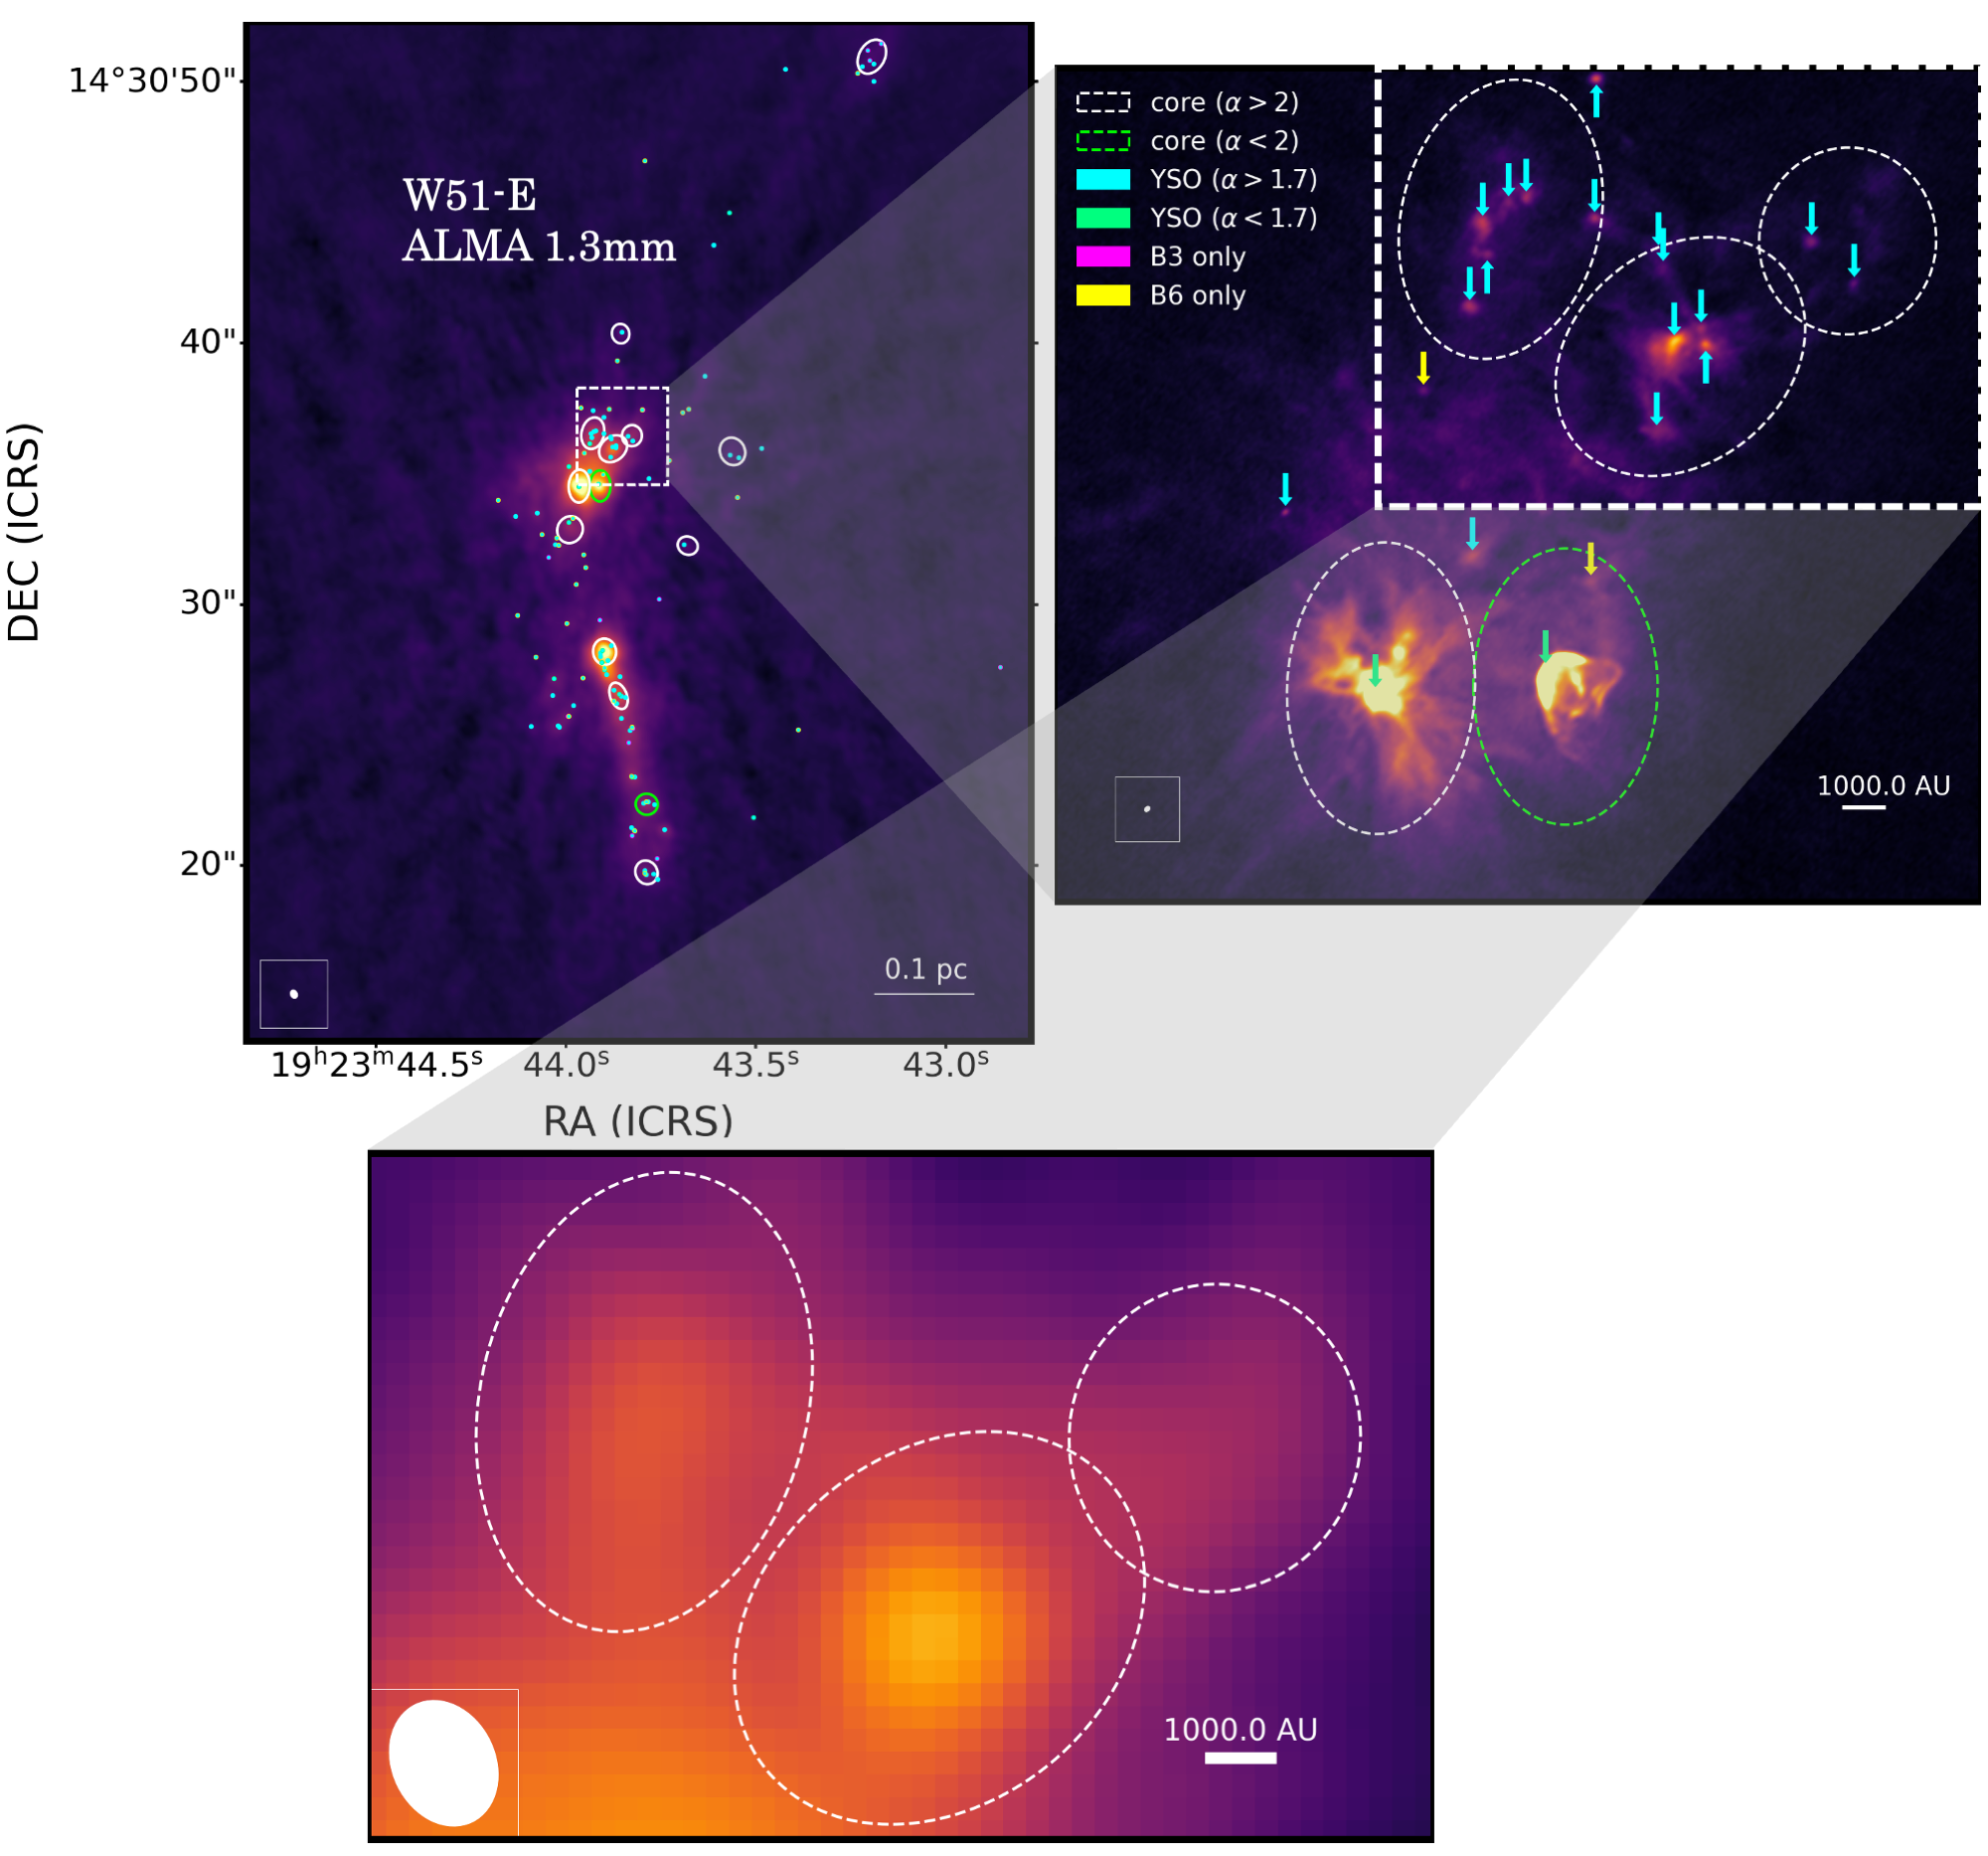

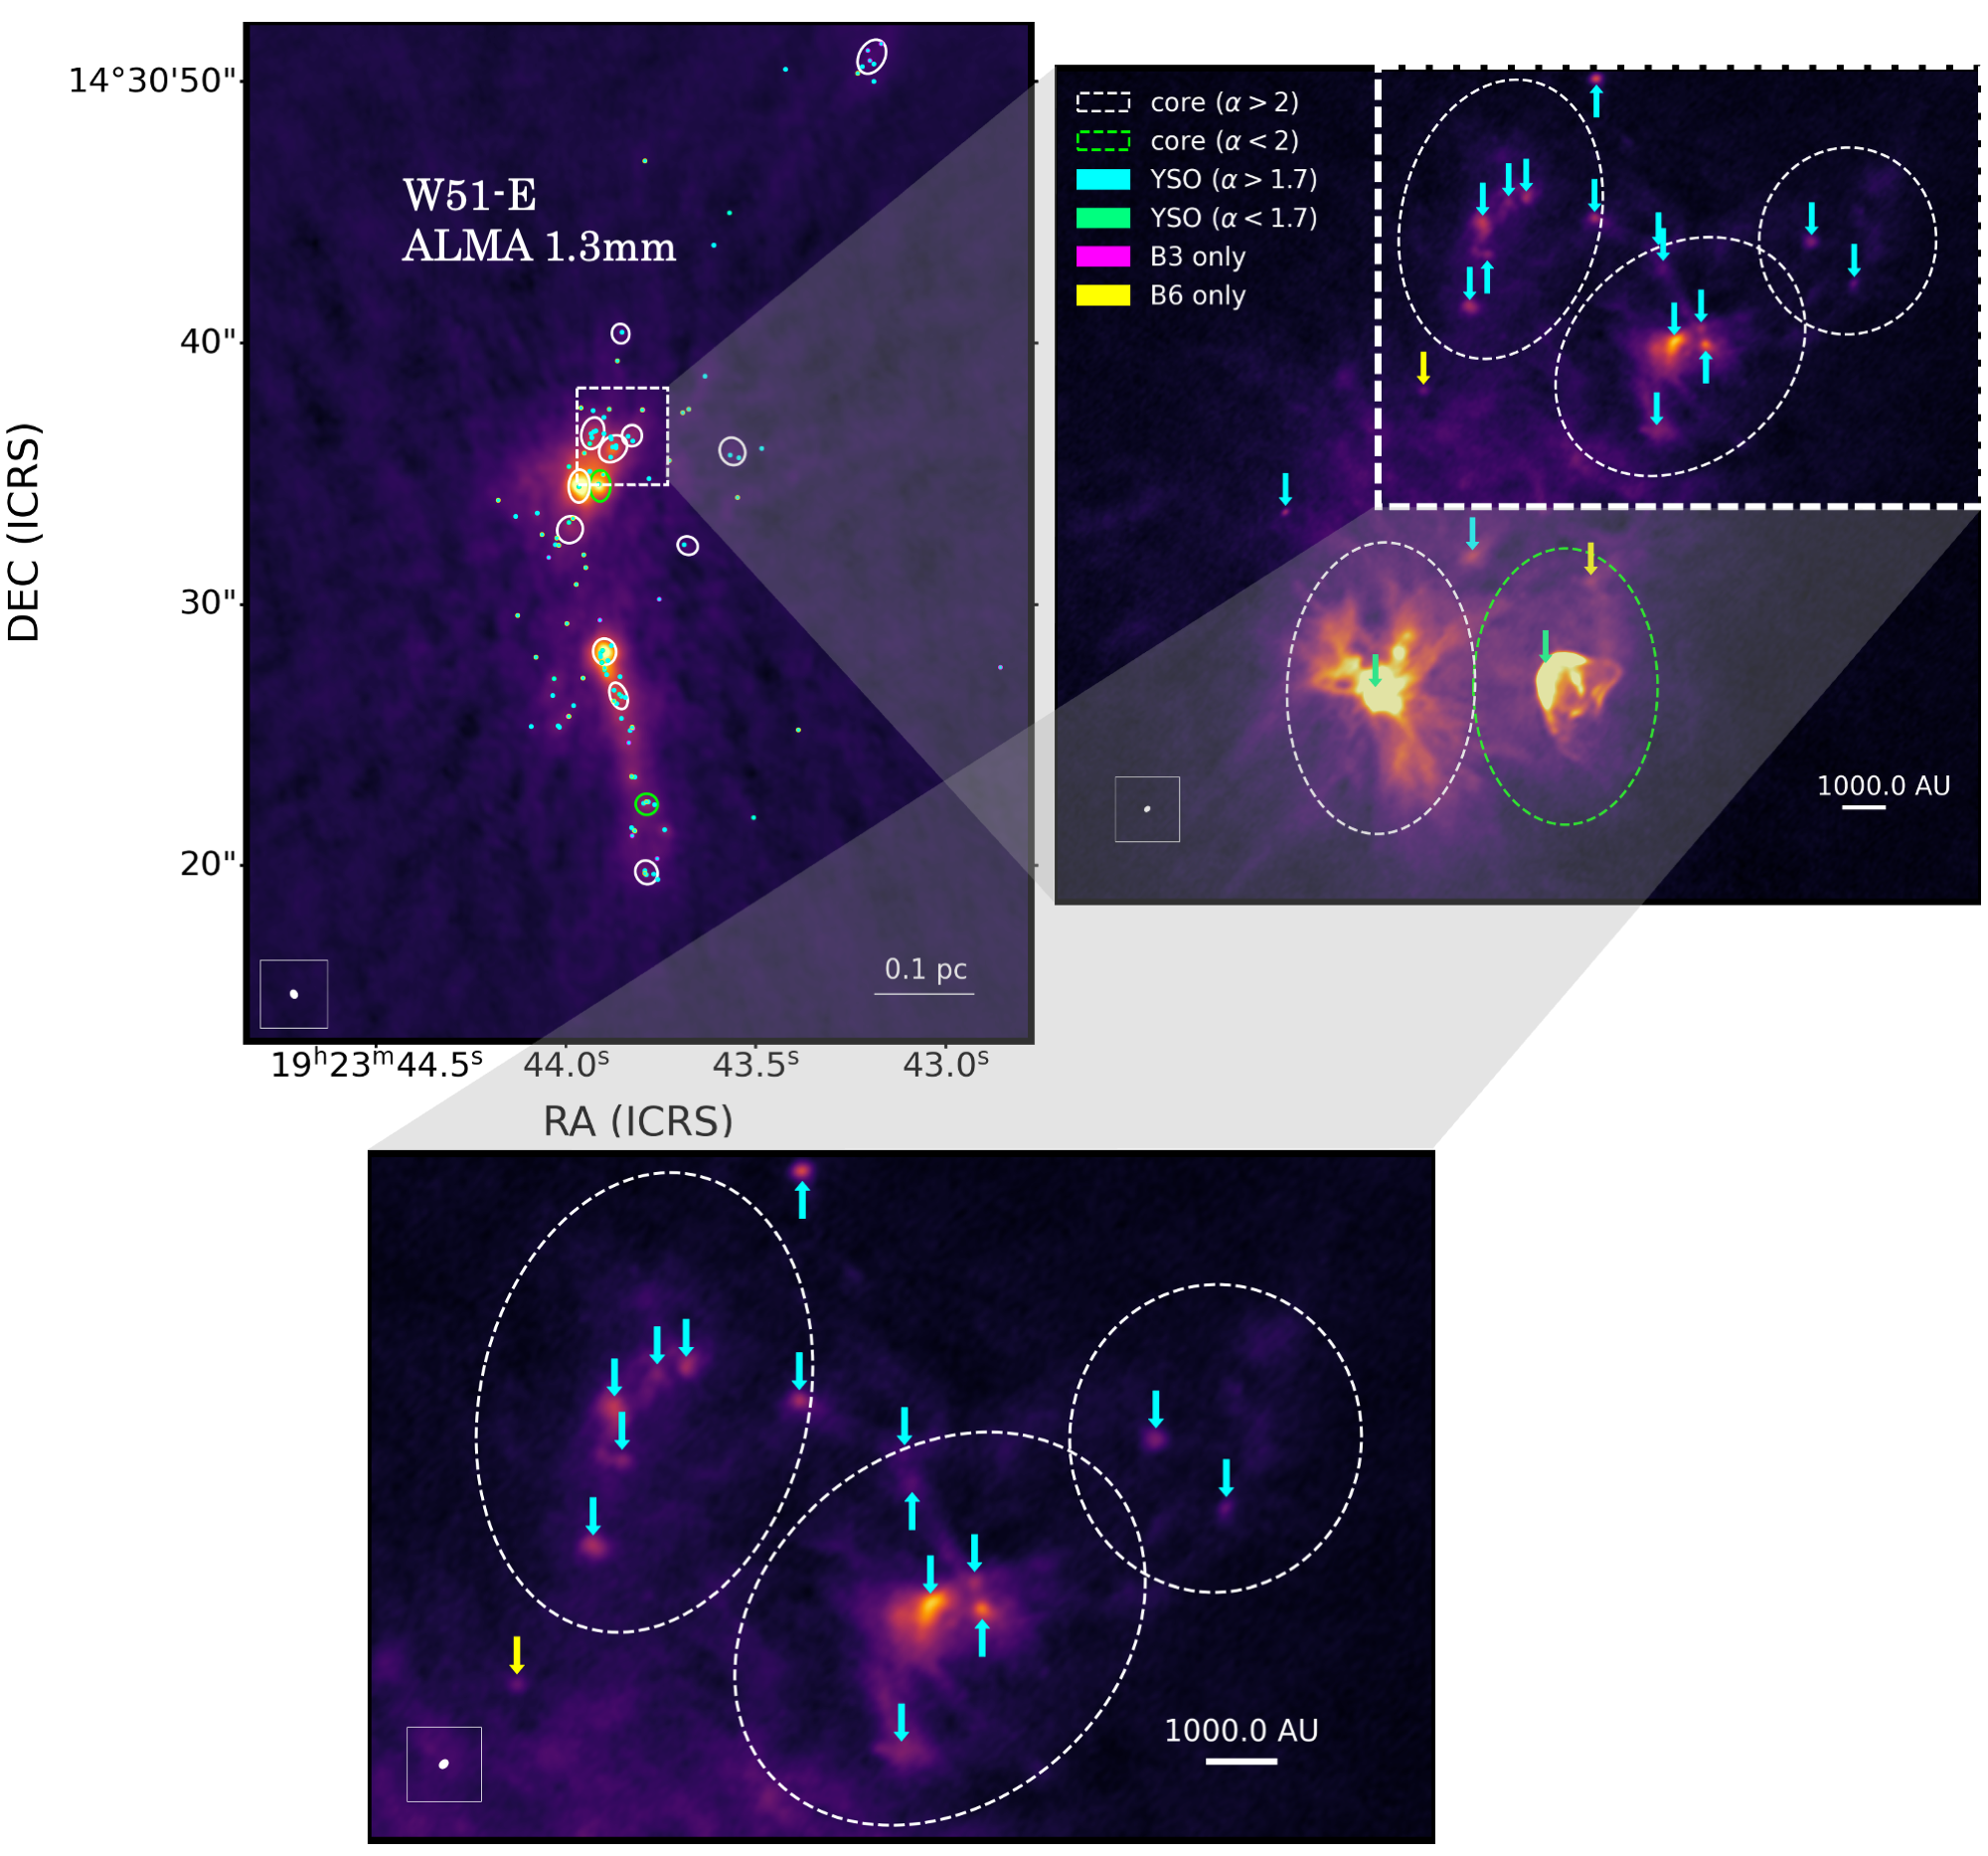
(no YSO, 1 YSO, >1 YSO) = (25%, 30%, 45%) W51-E, (53%, 39%, 8%) IRS2
Taehwa Yoo+: fragmentation
toward W51
toward W51
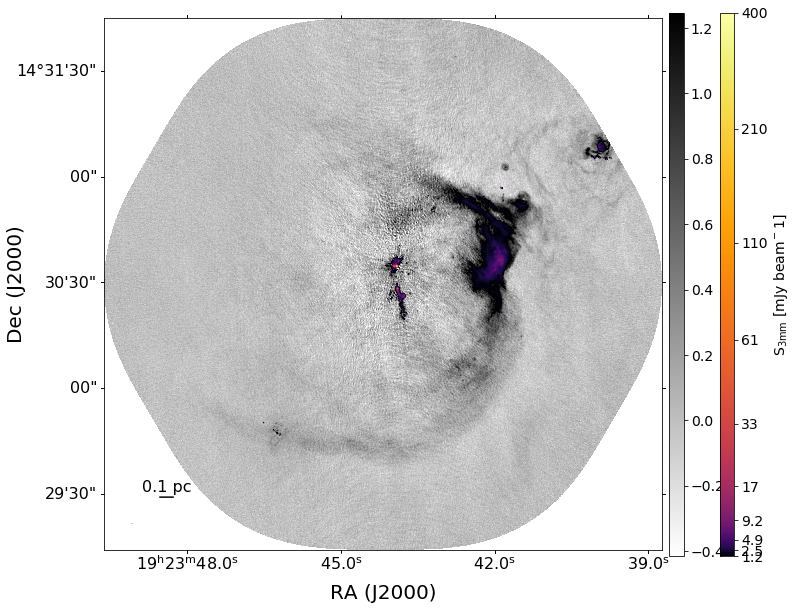
(no YSO, 1 YSO, >1 YSO) = 17%, 37%, 45% Sgr B2
("cores" are bigger)
Budaiev+ 2024: fragmentation in Sgr B2

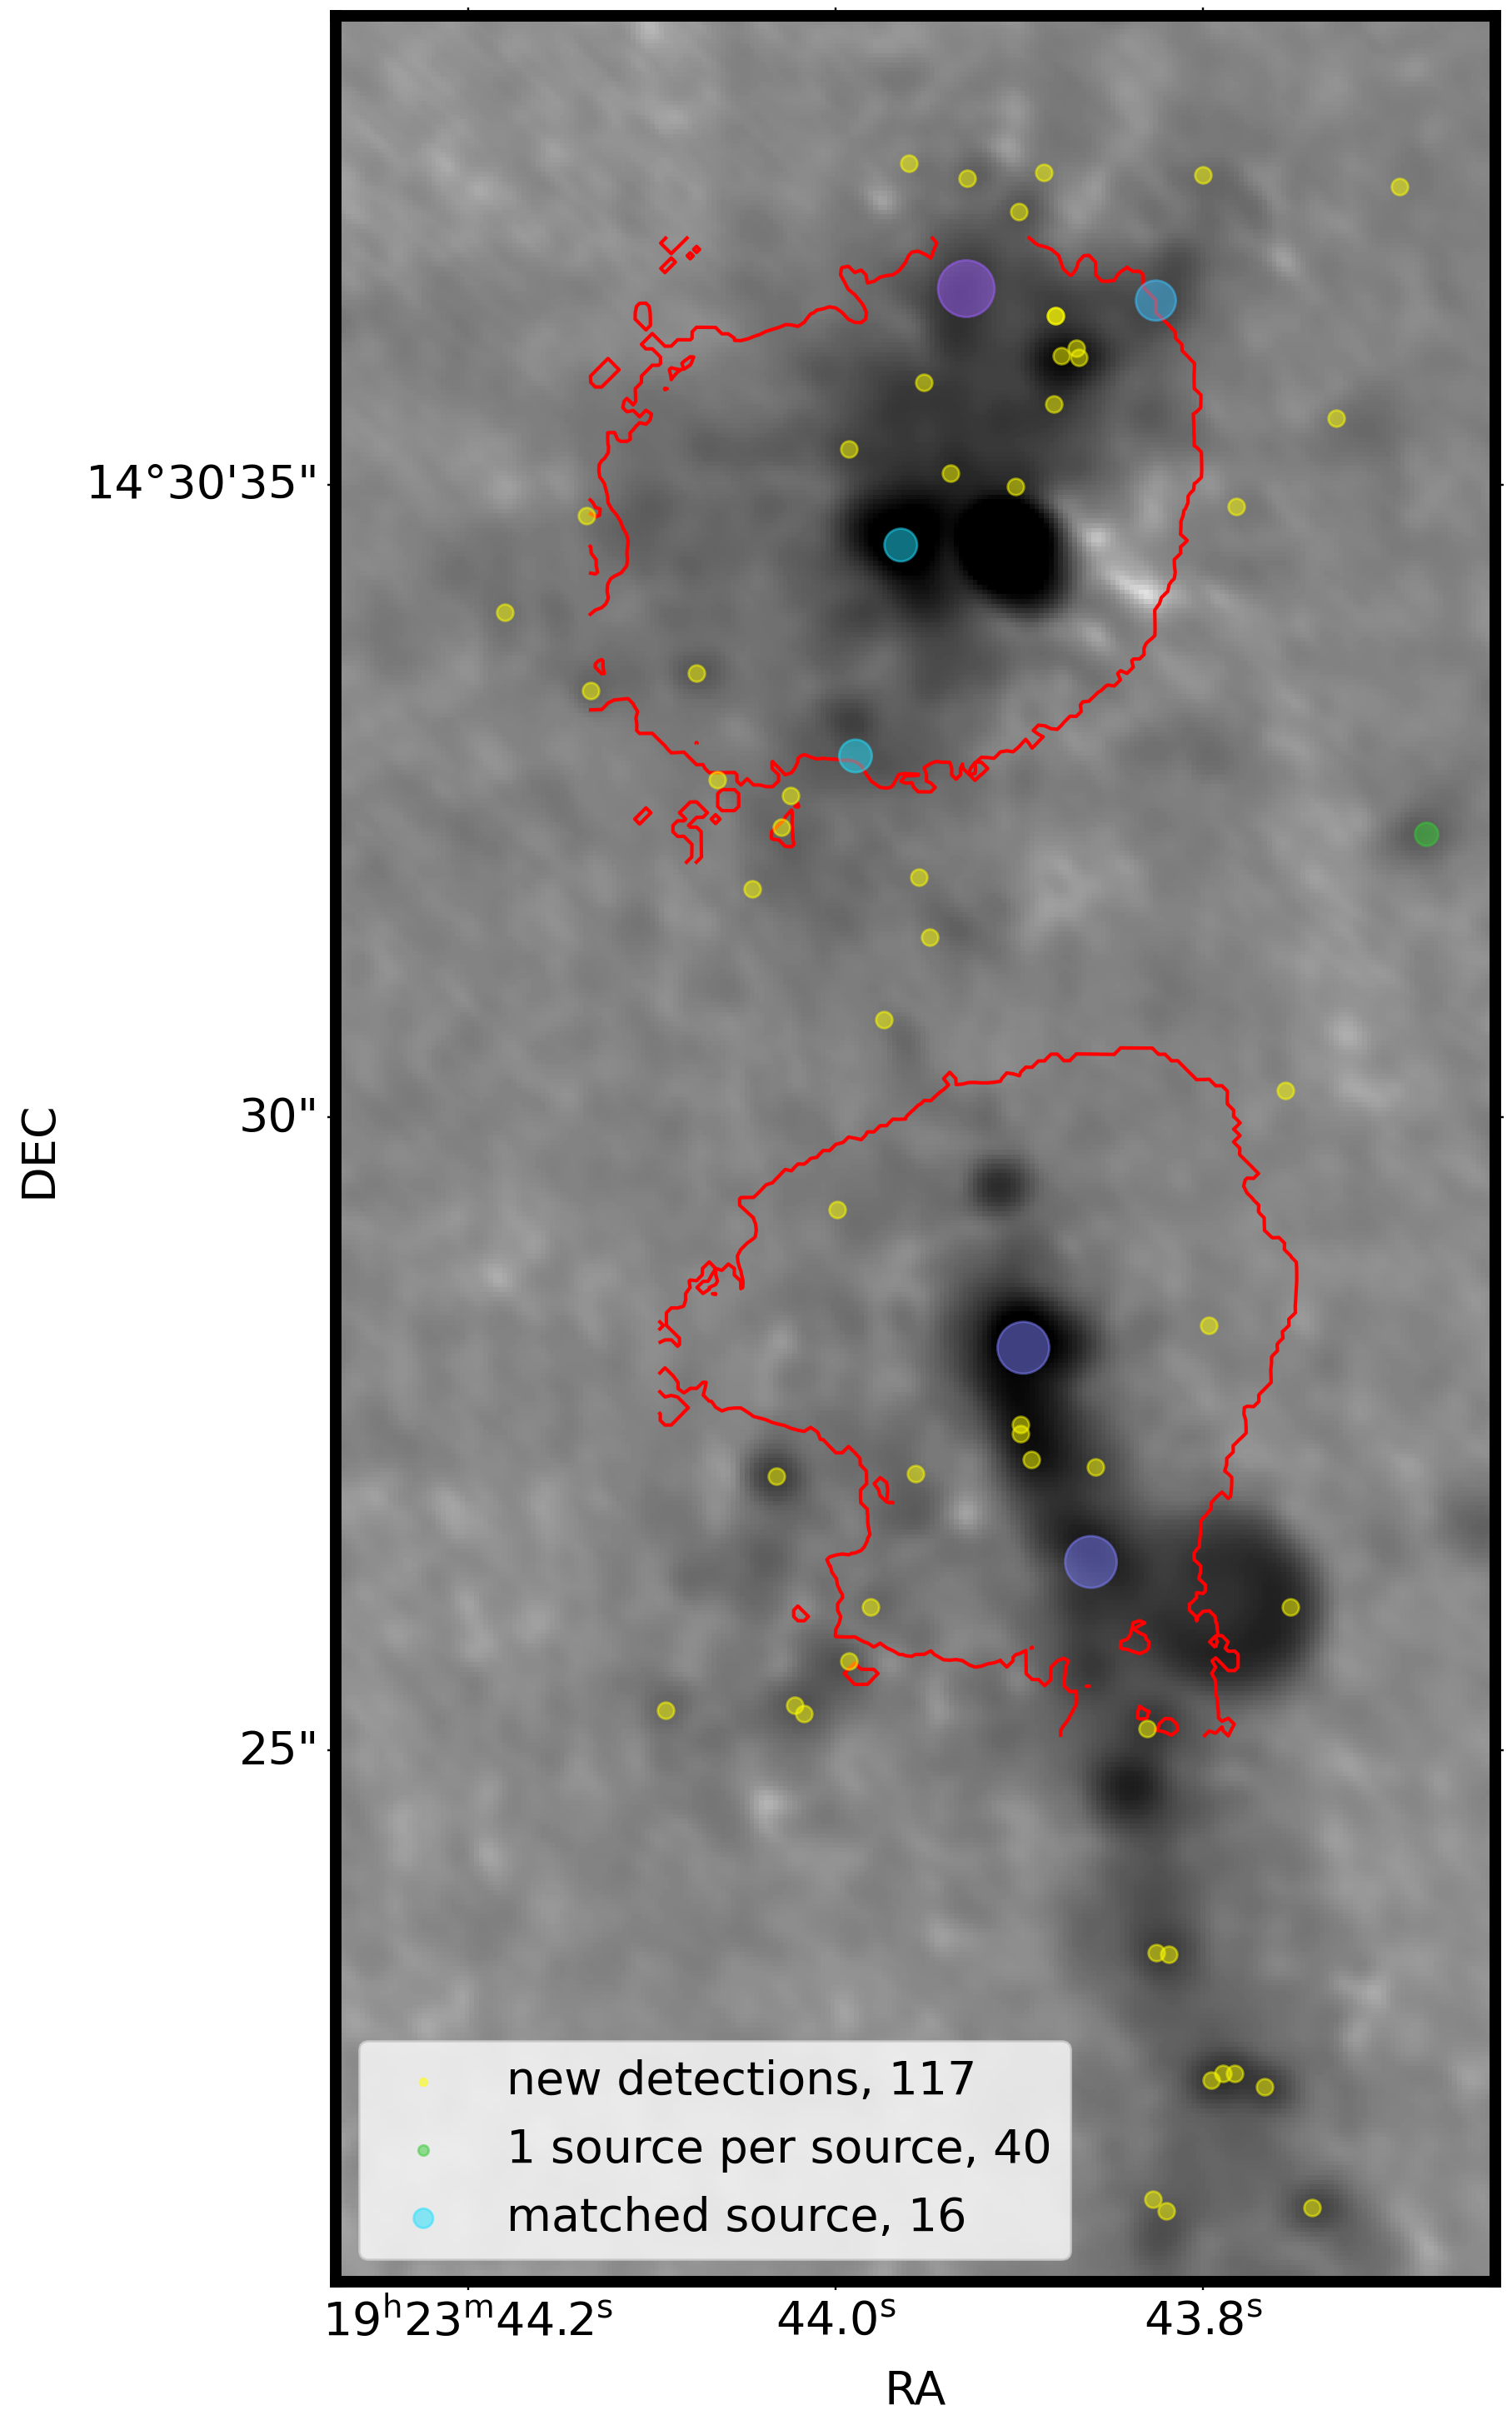
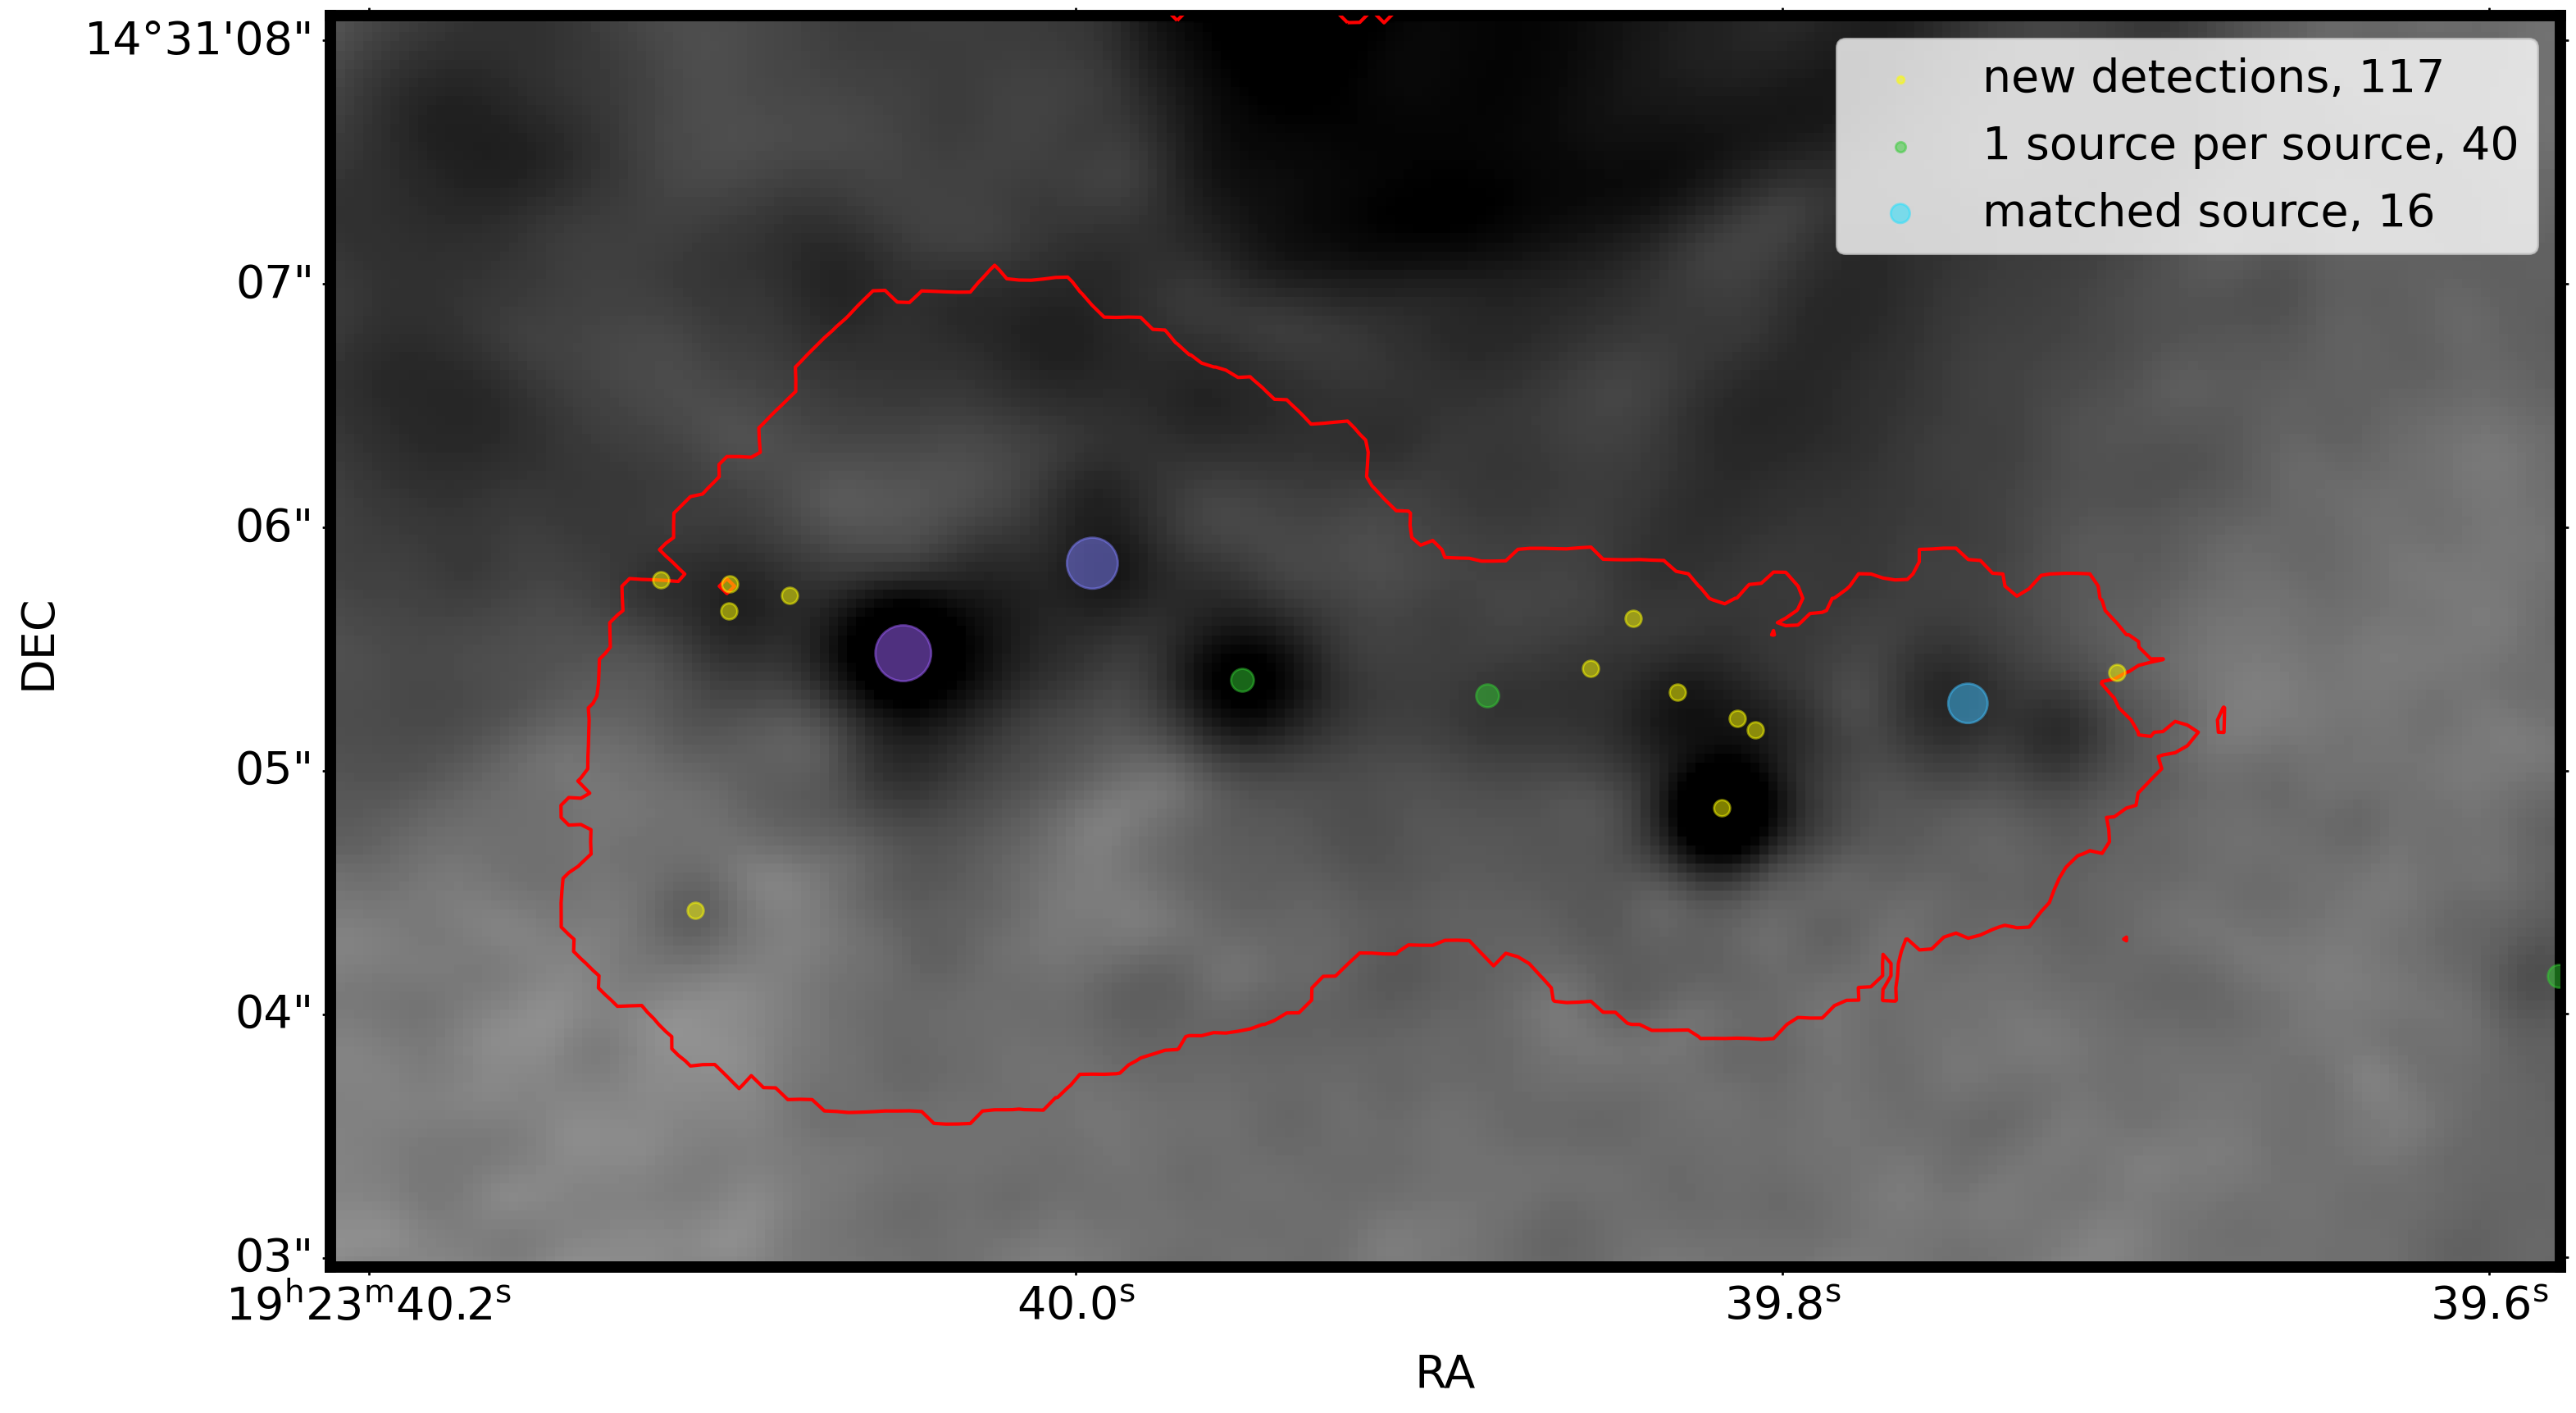
20% of YSOs in W51 lie within the $>100$ K contour
Trend: More massive cores fragment more.
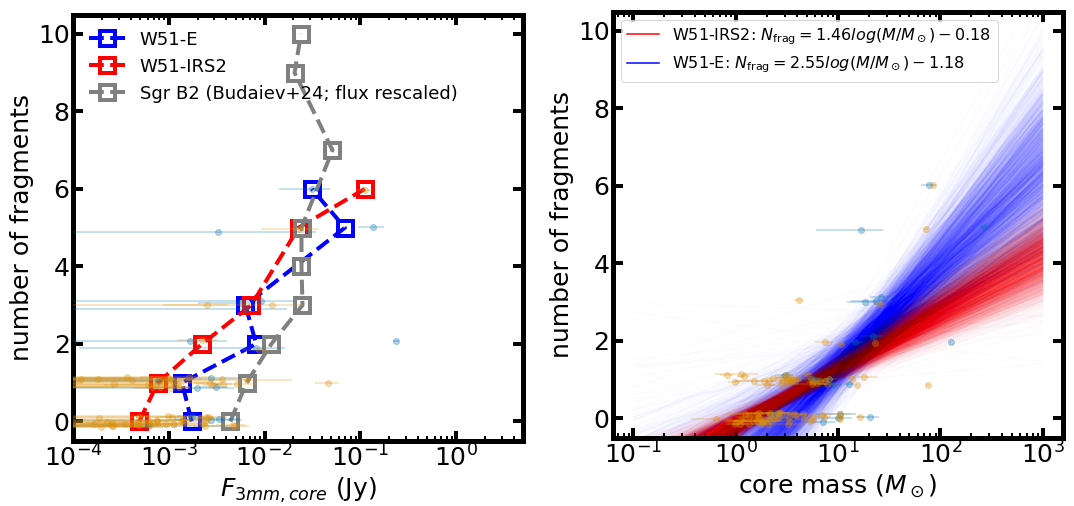

Suggestive Trend: More massive cores make more massive single stars

Yoo+ resub.: W51
Budaiev+ 2024: Sgr B2
The number of detectable fragments goes up, but the mass gets more
concentrated into the most massive object.
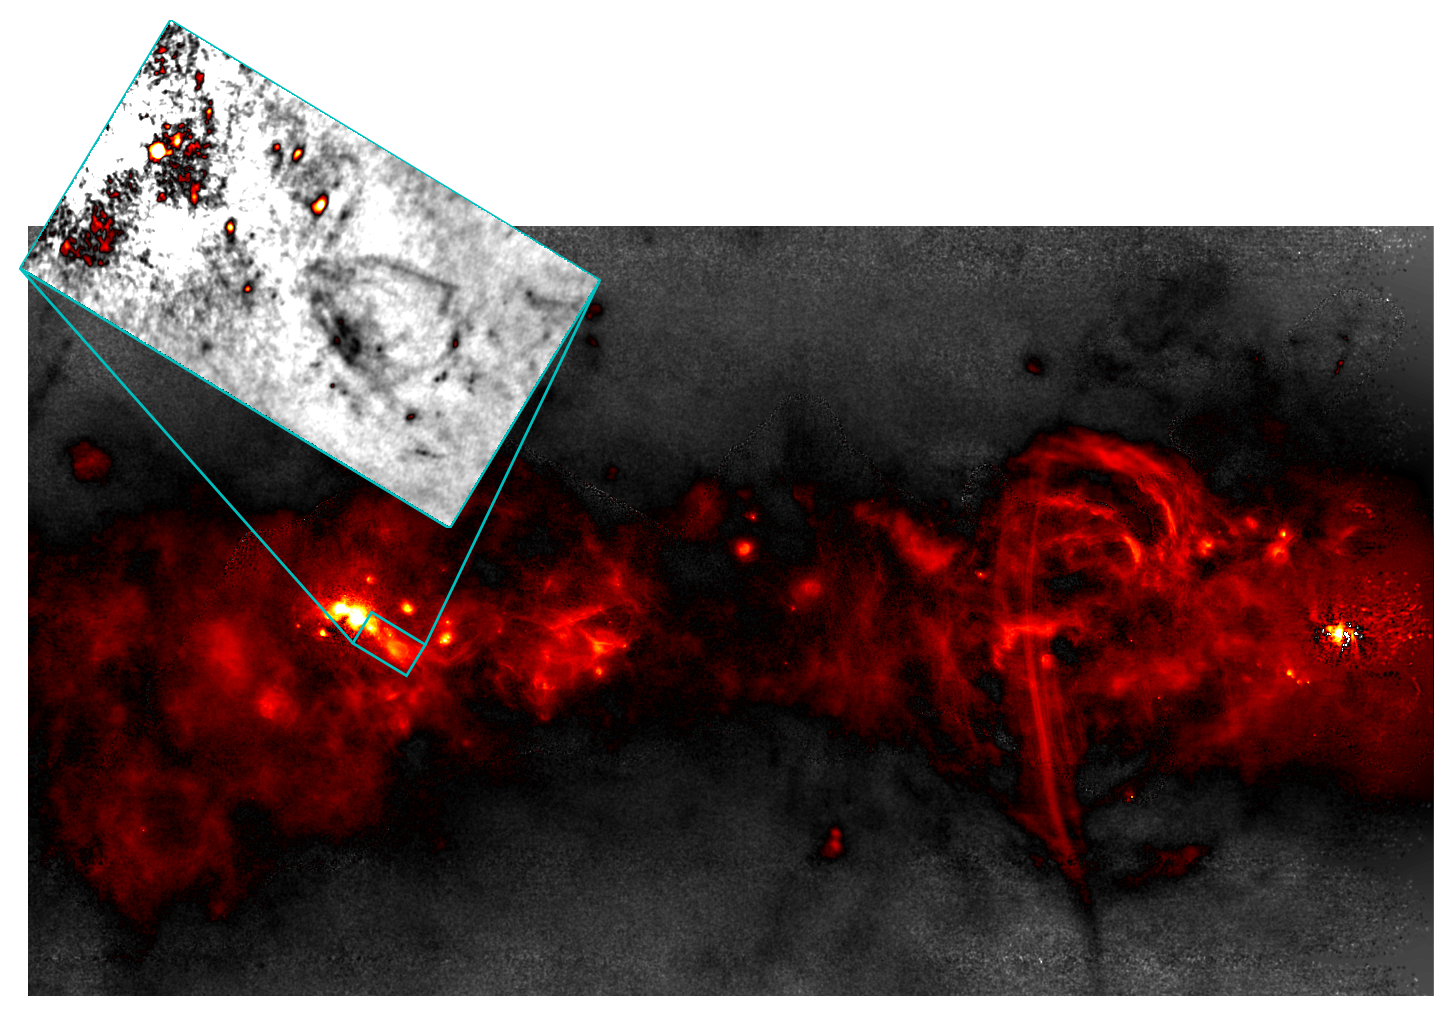
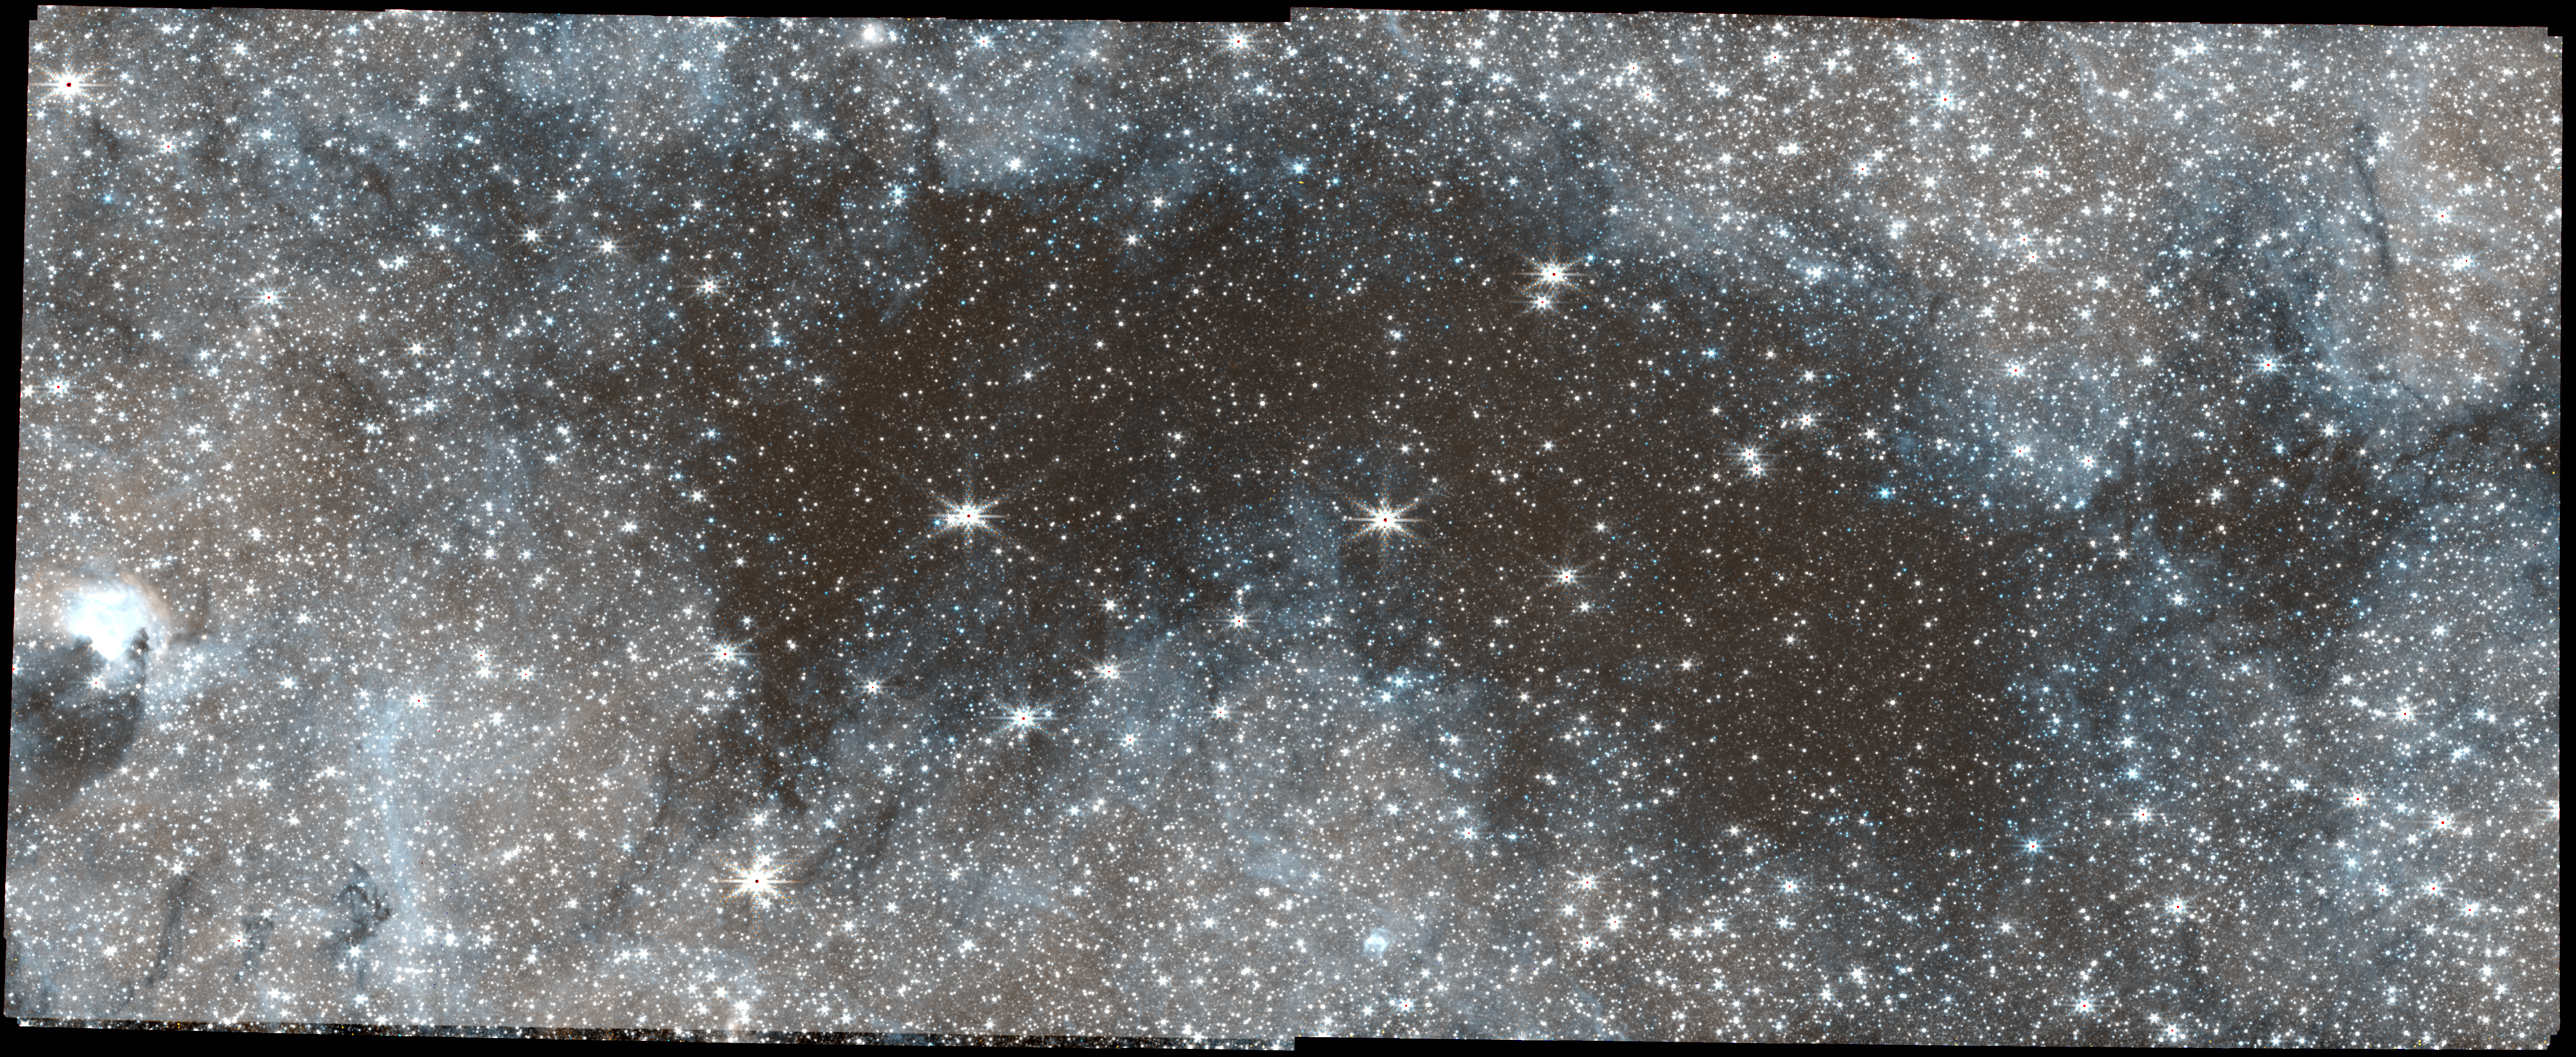
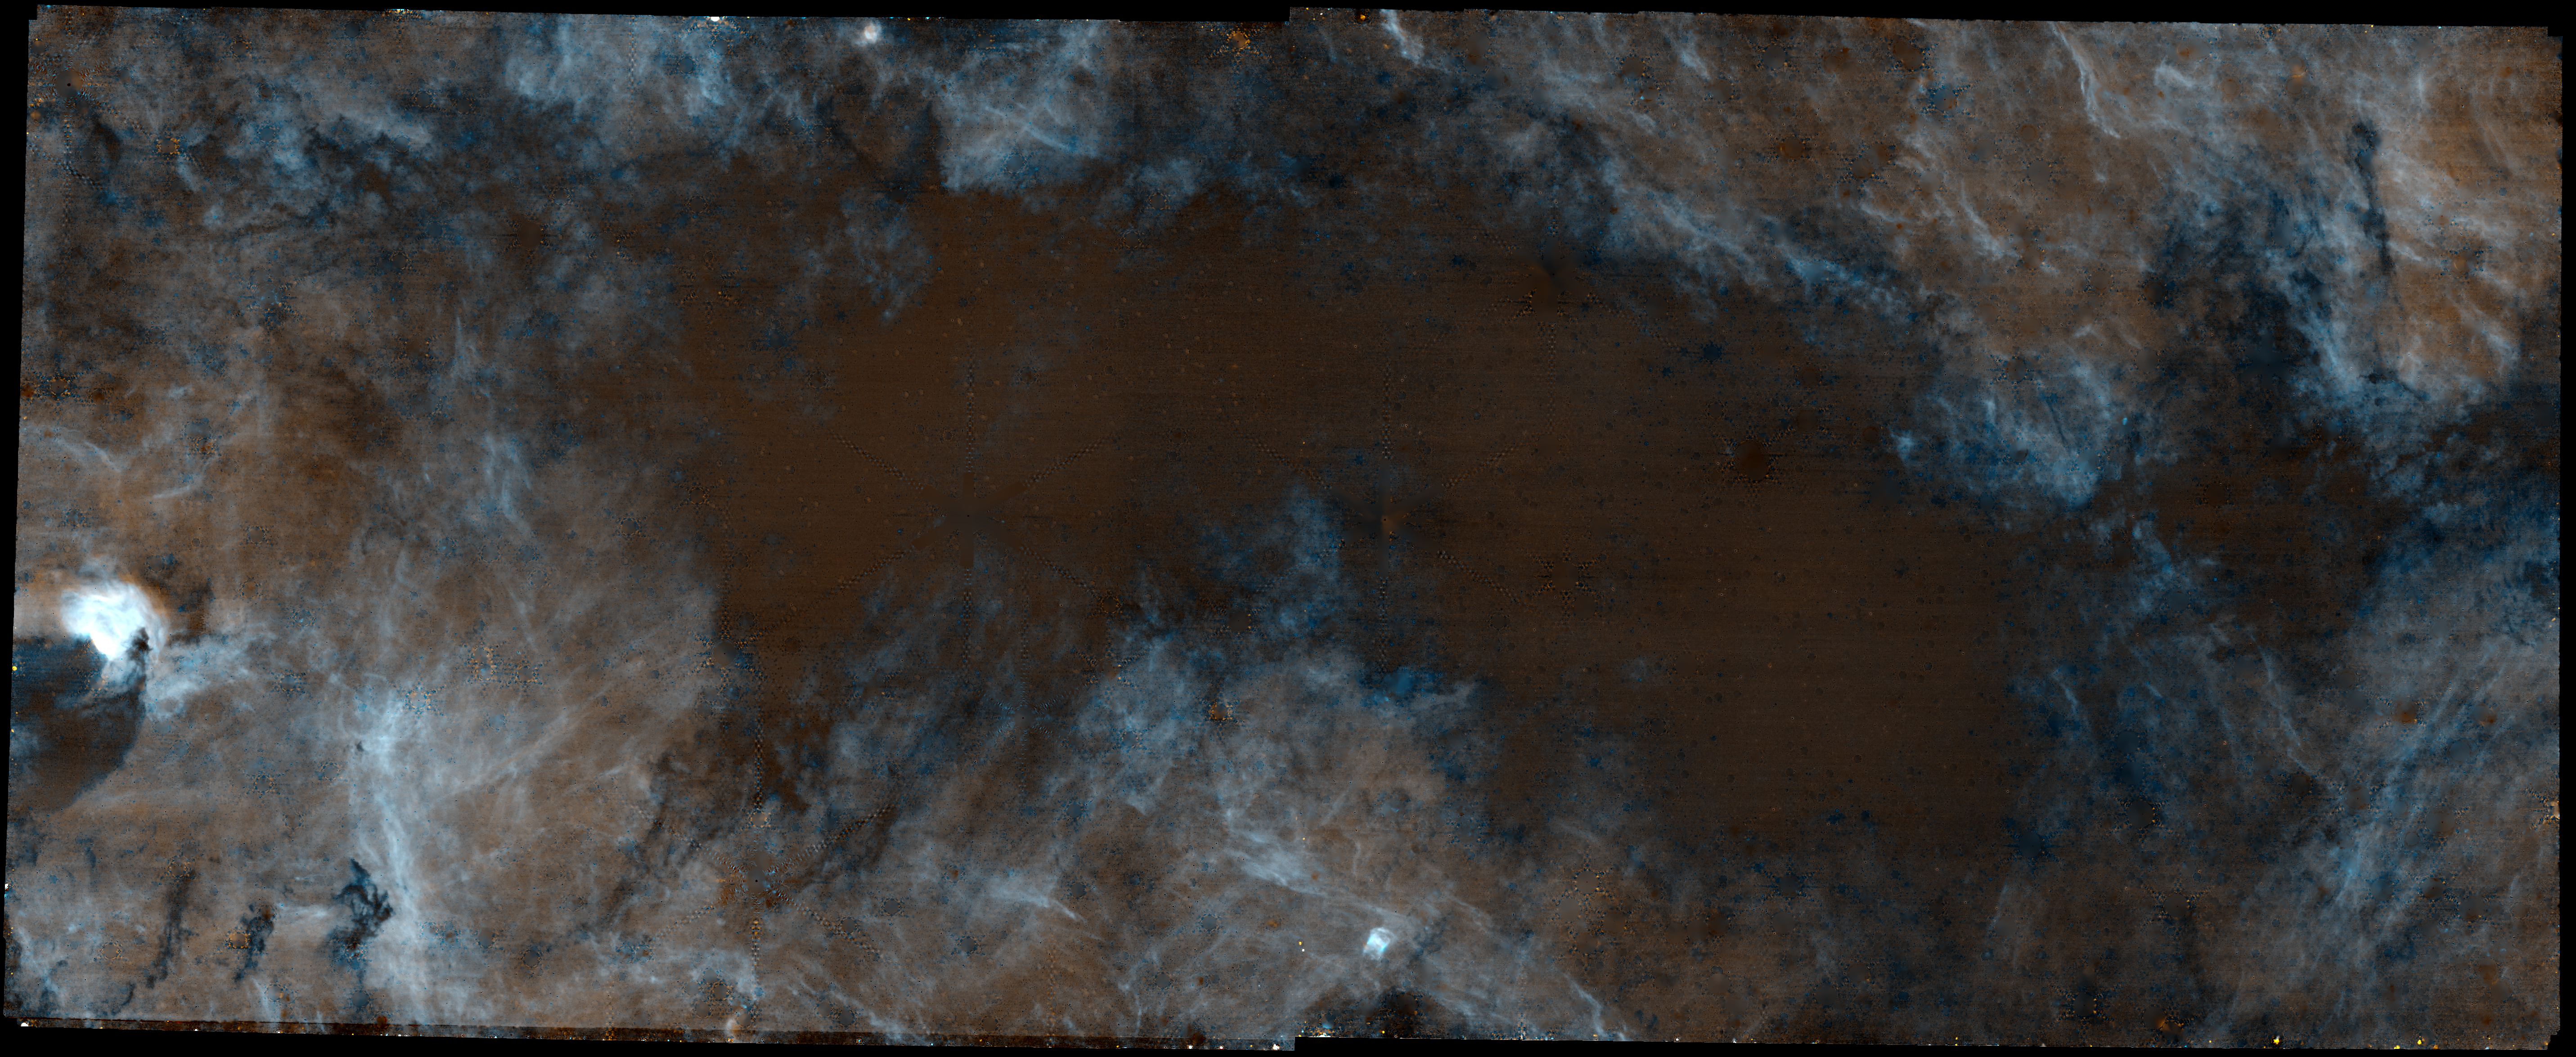
Sgr B2 with JWST on MEERKAT: Ionized gas shows layers of the cloud
MIRI reveals deeply embedded gas
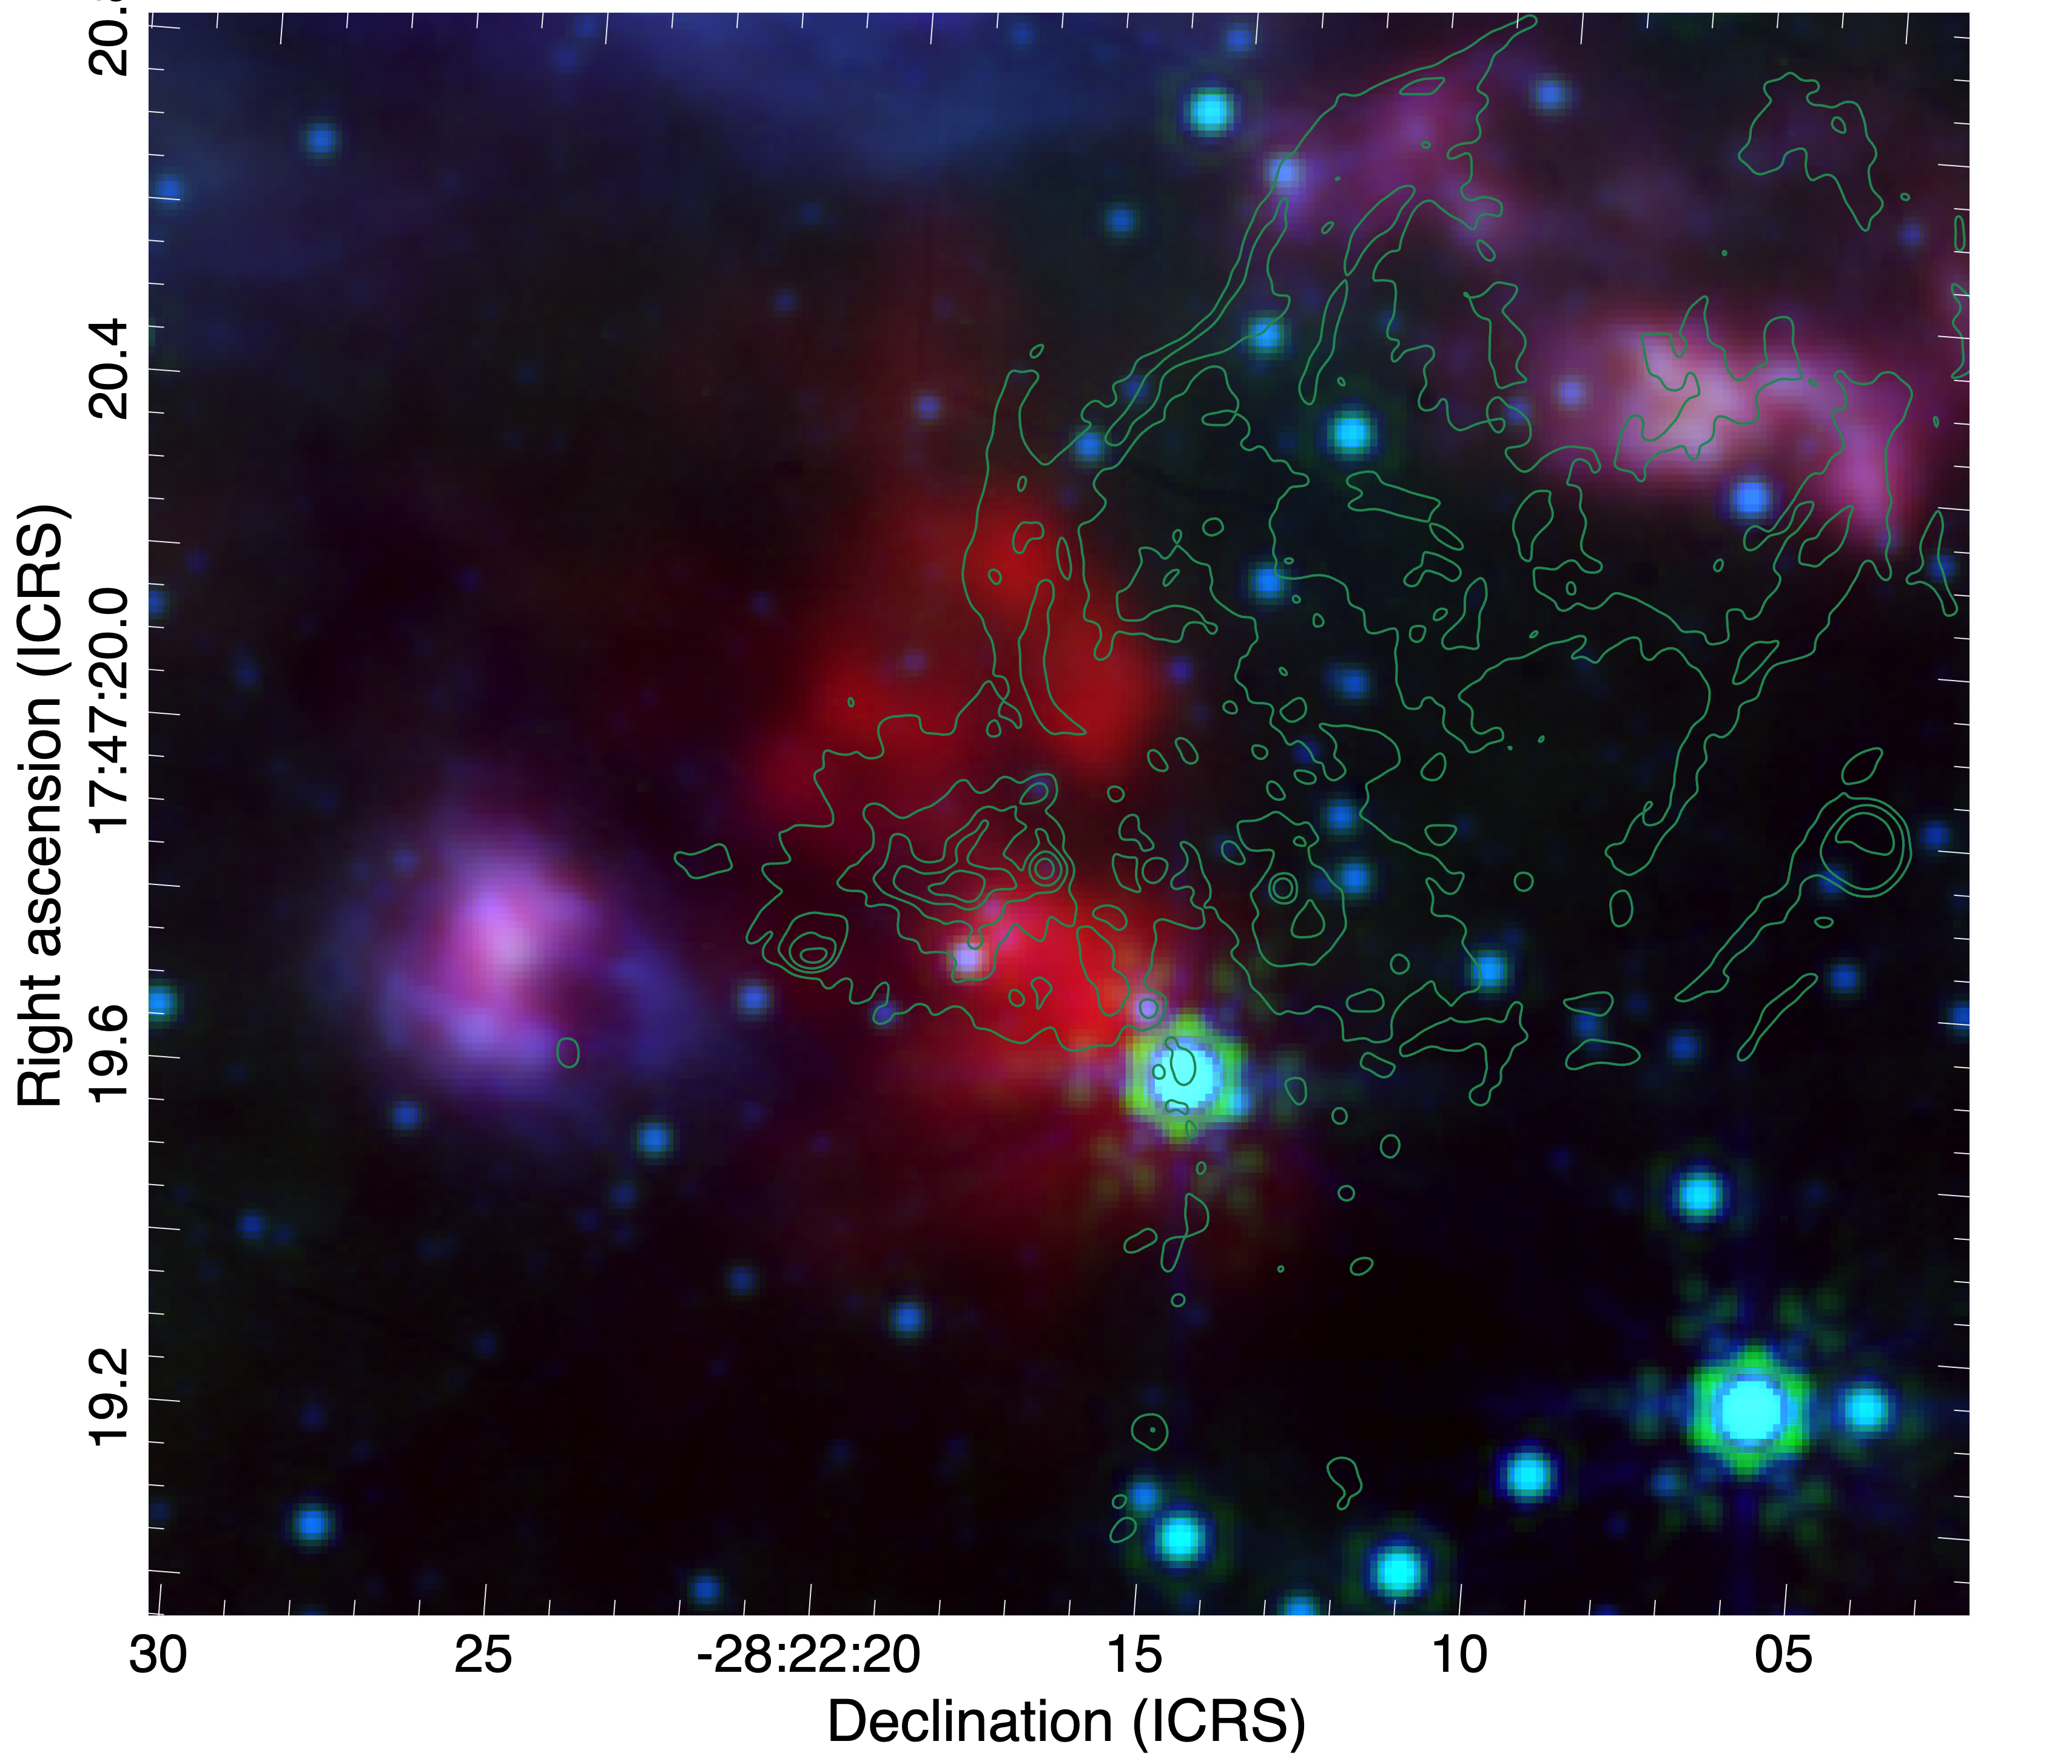
MIRI 25 micron shows the outflow:
first IR light from within Sgr B2 N
first IR light from within Sgr B2 N
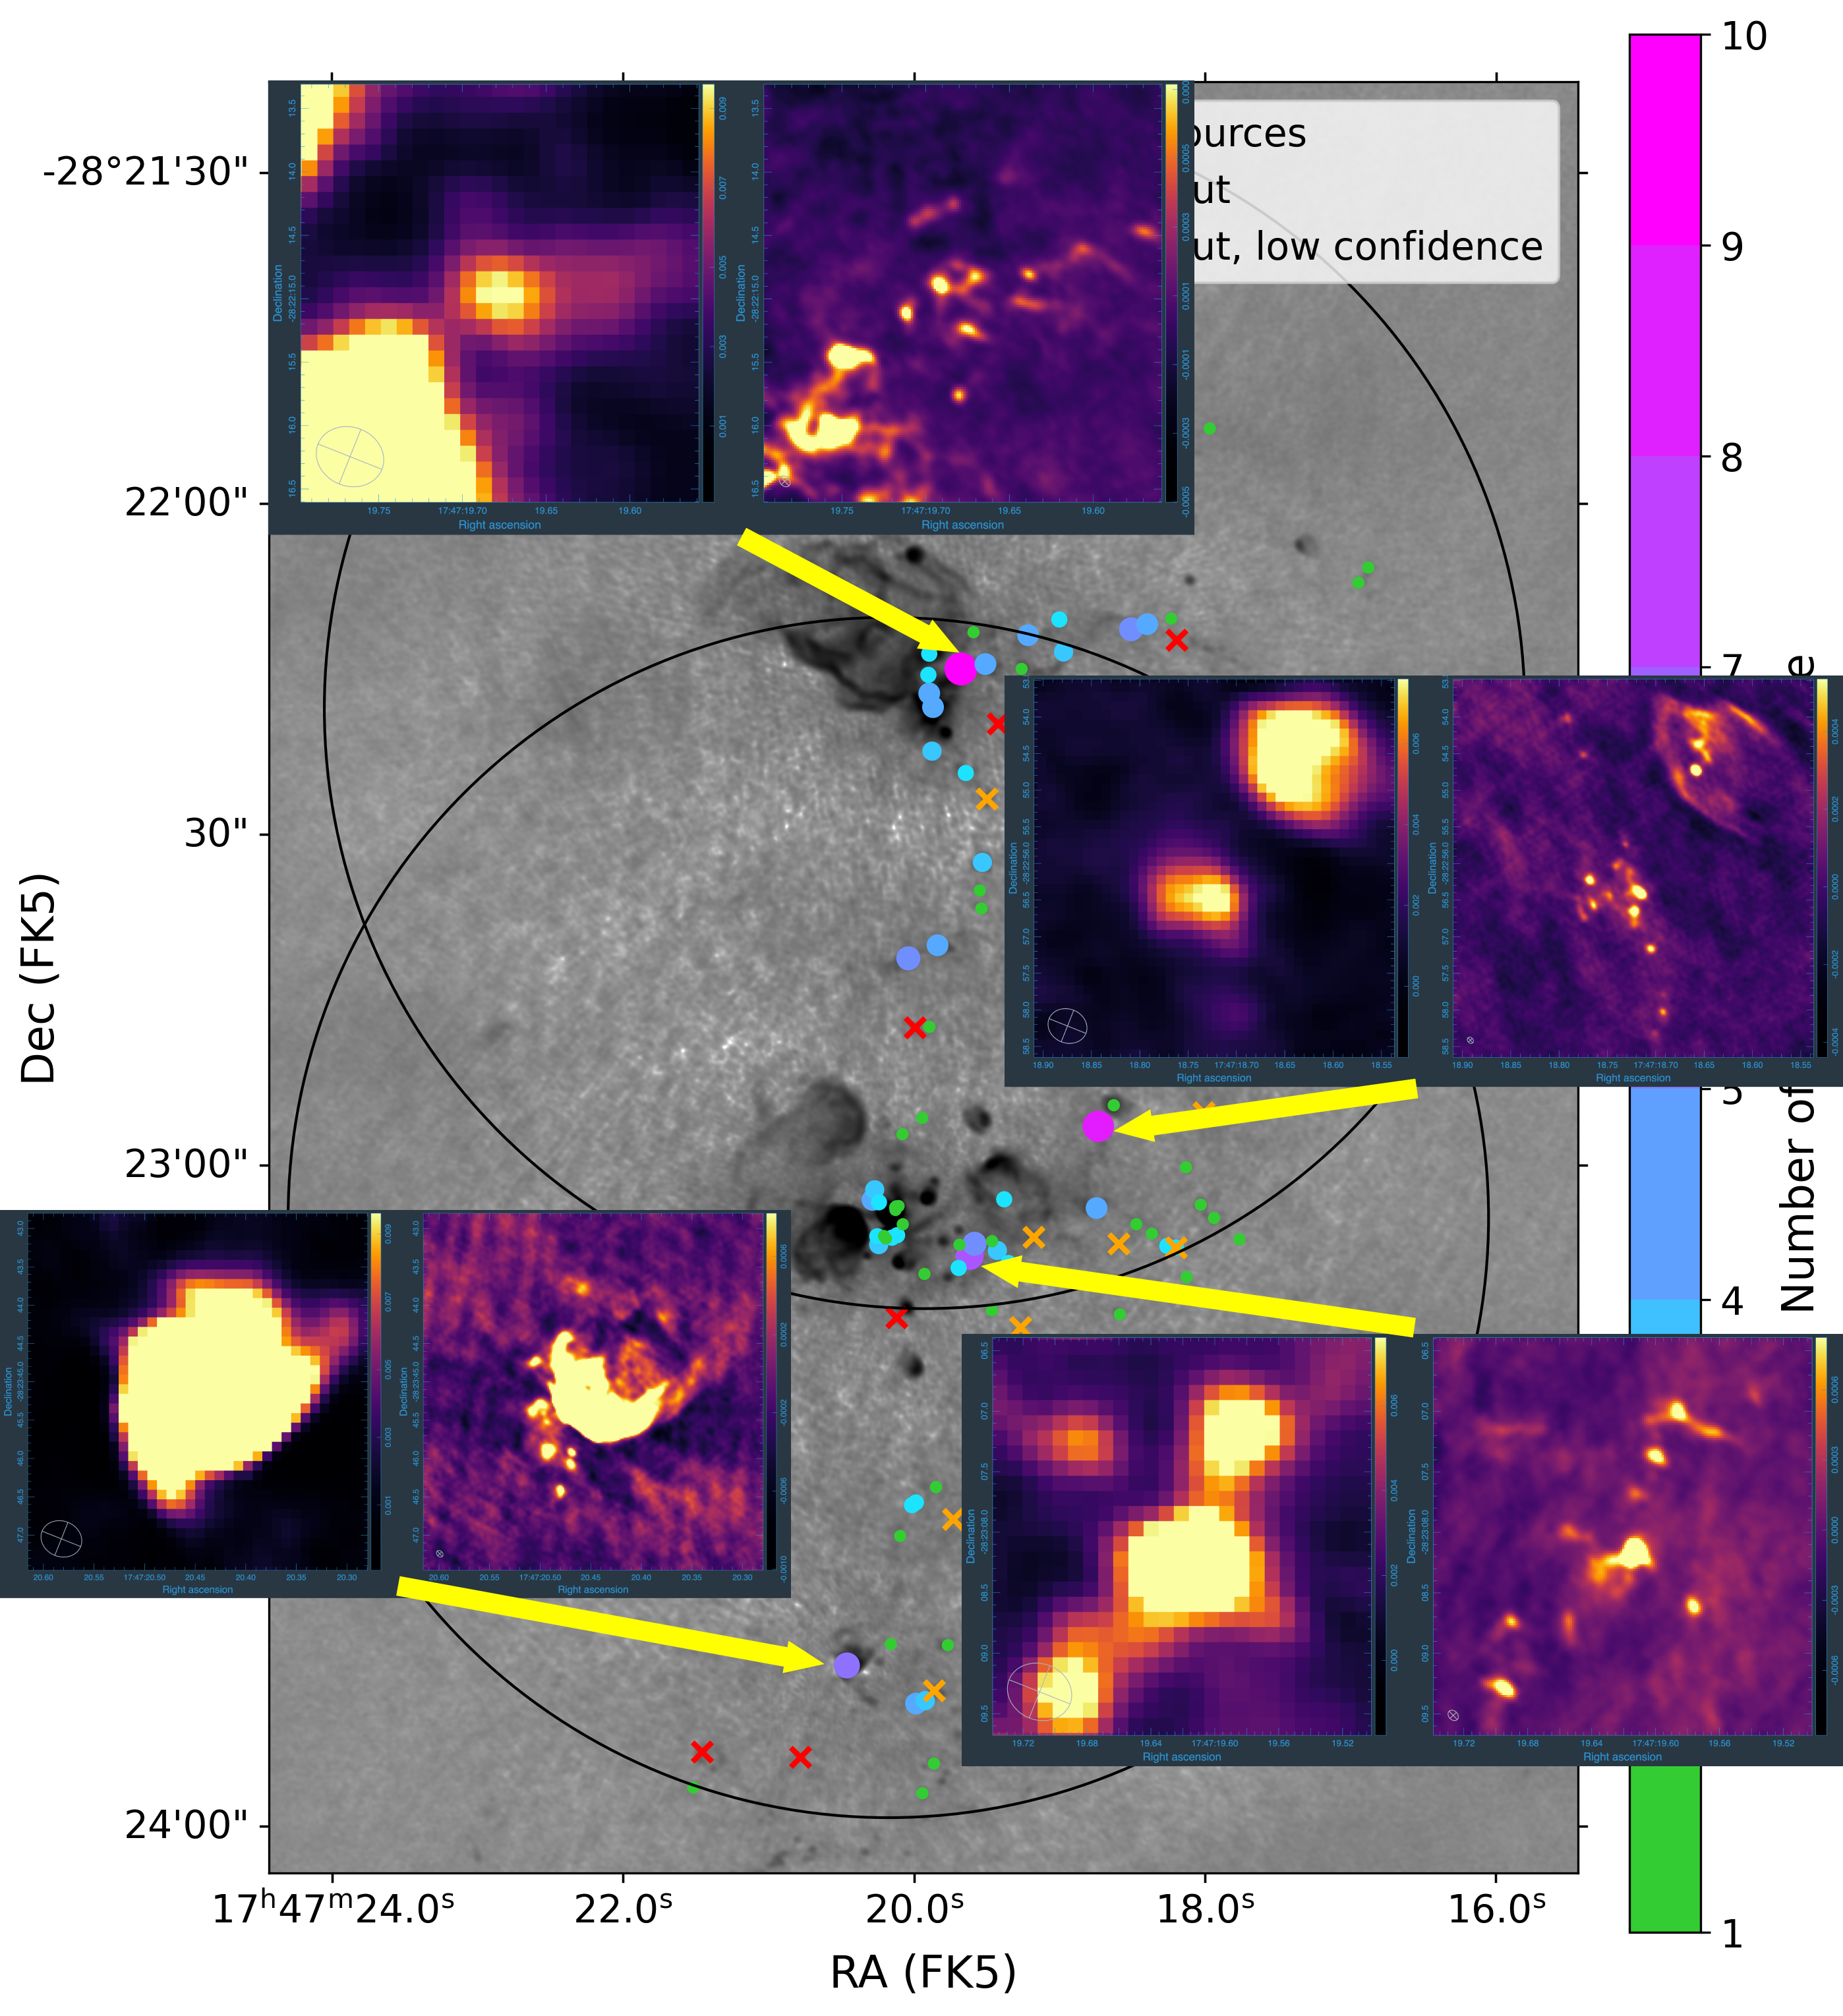
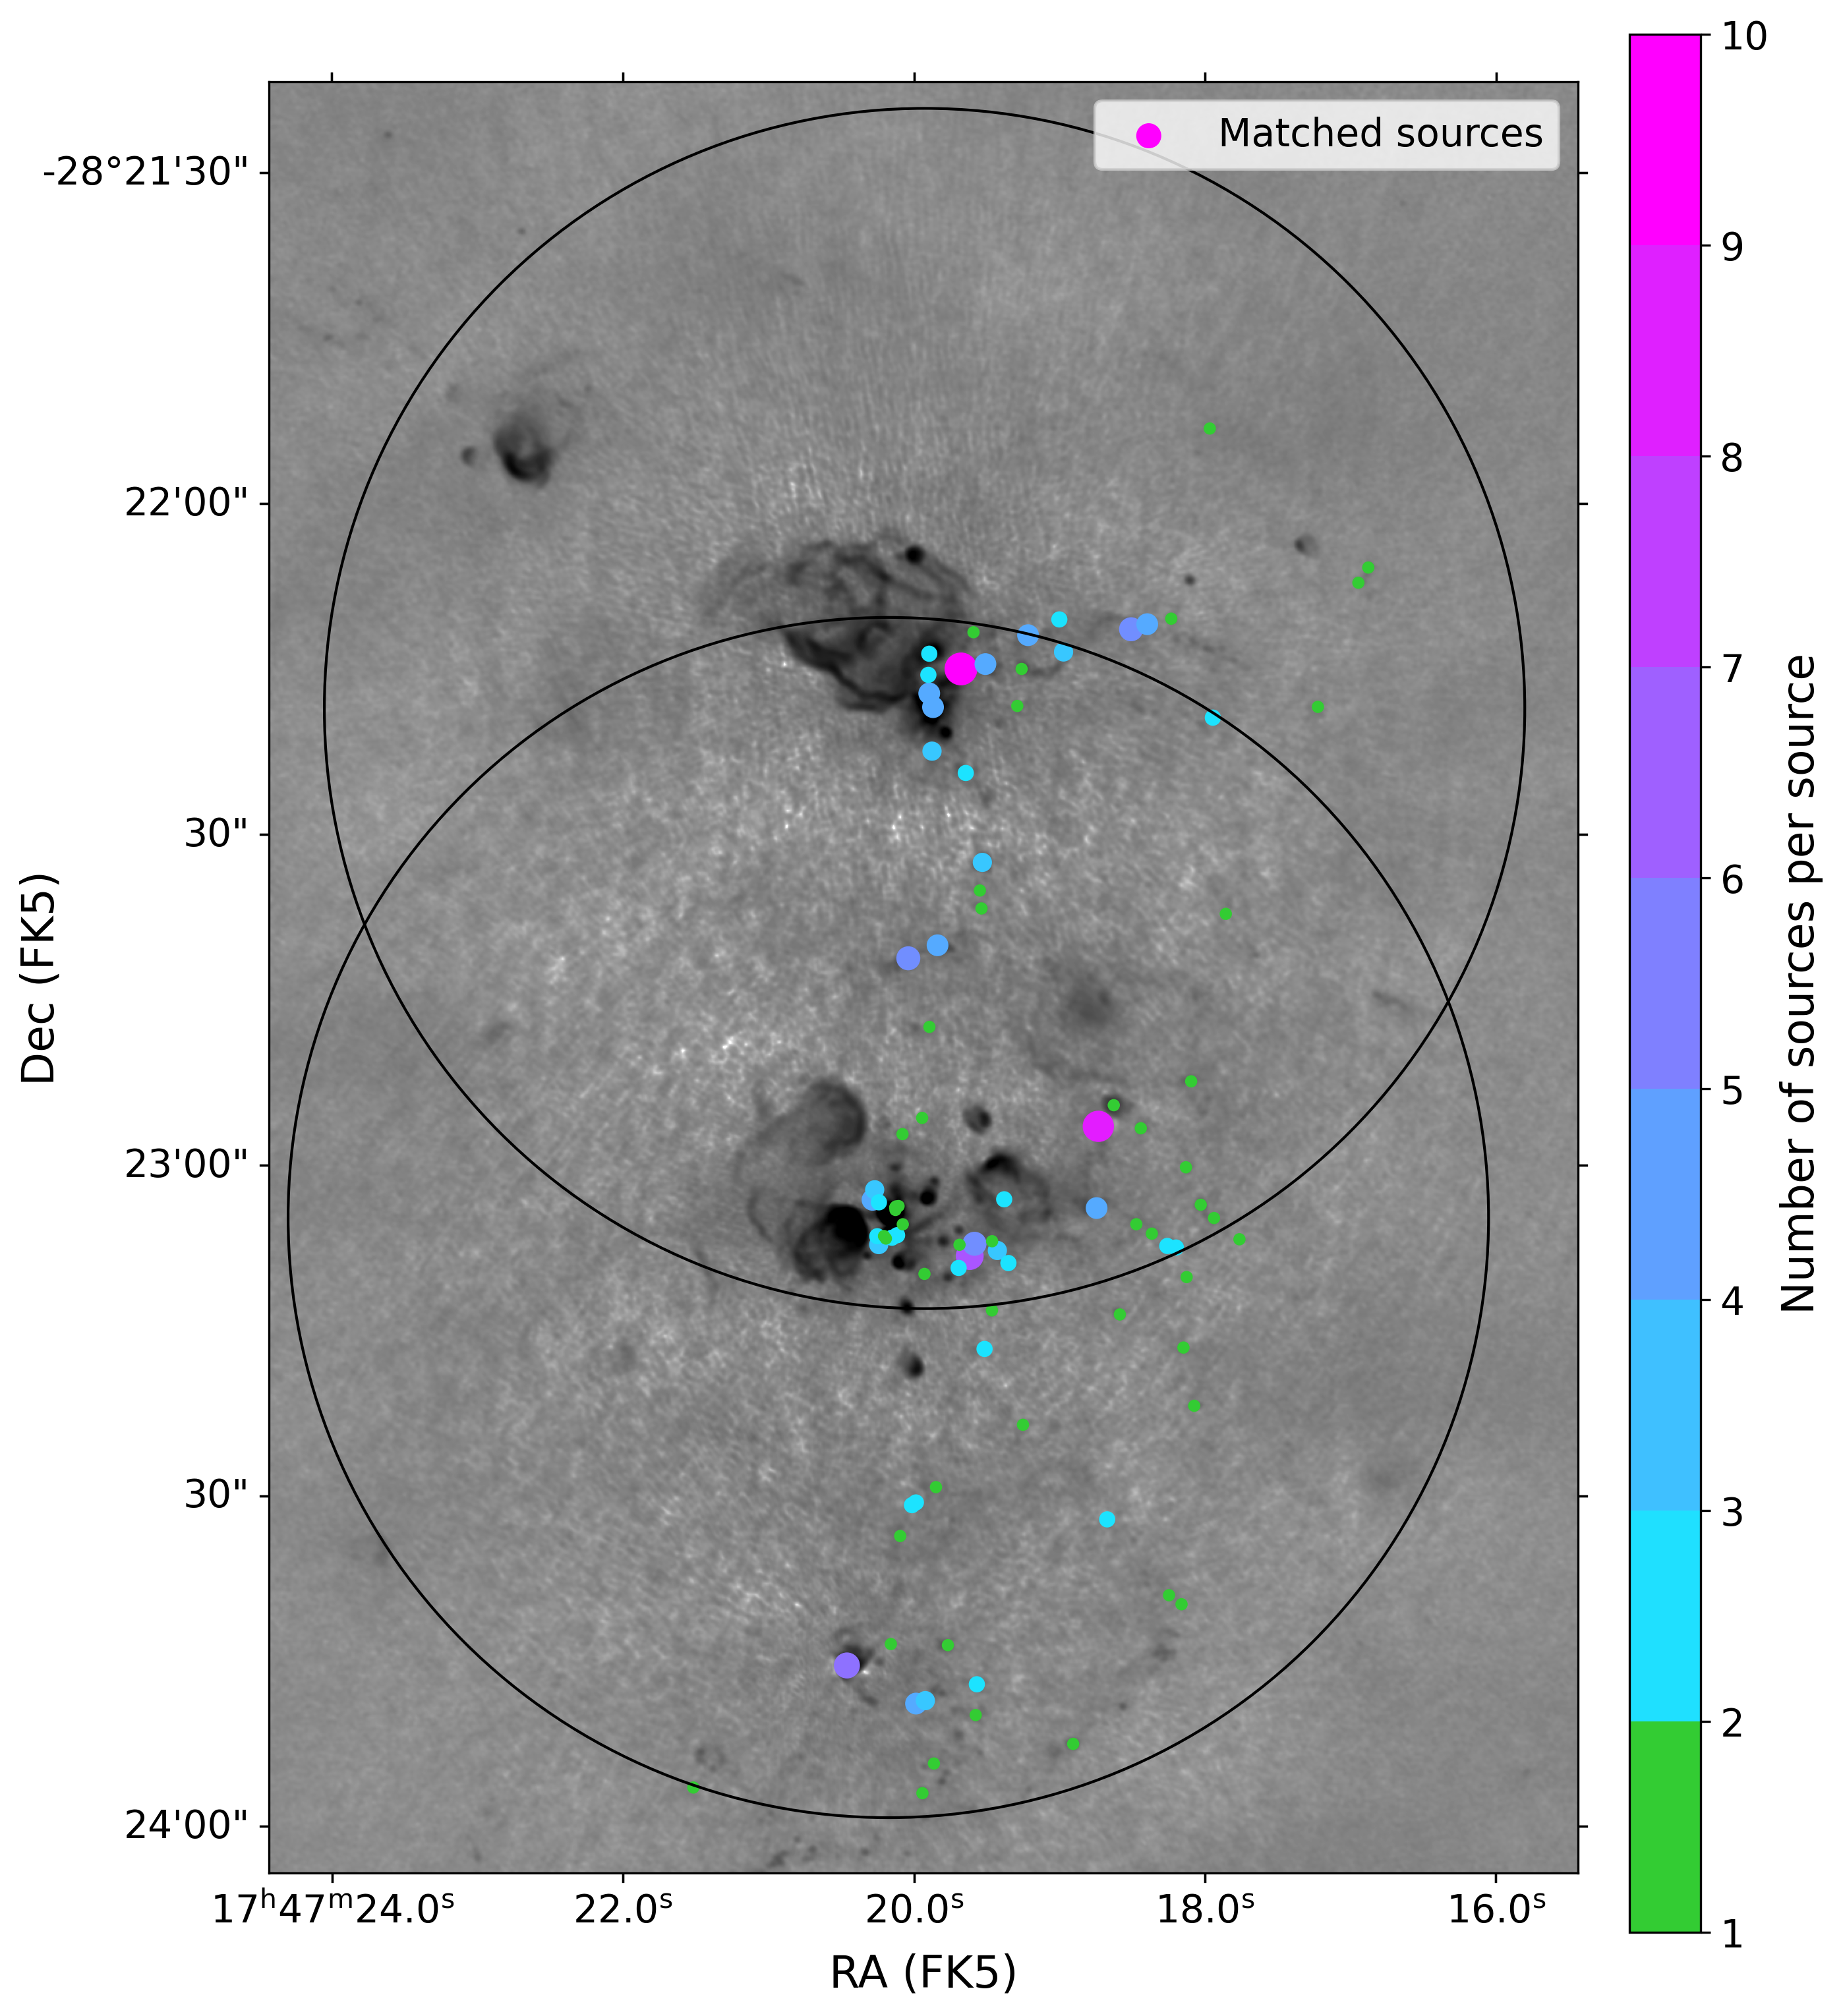
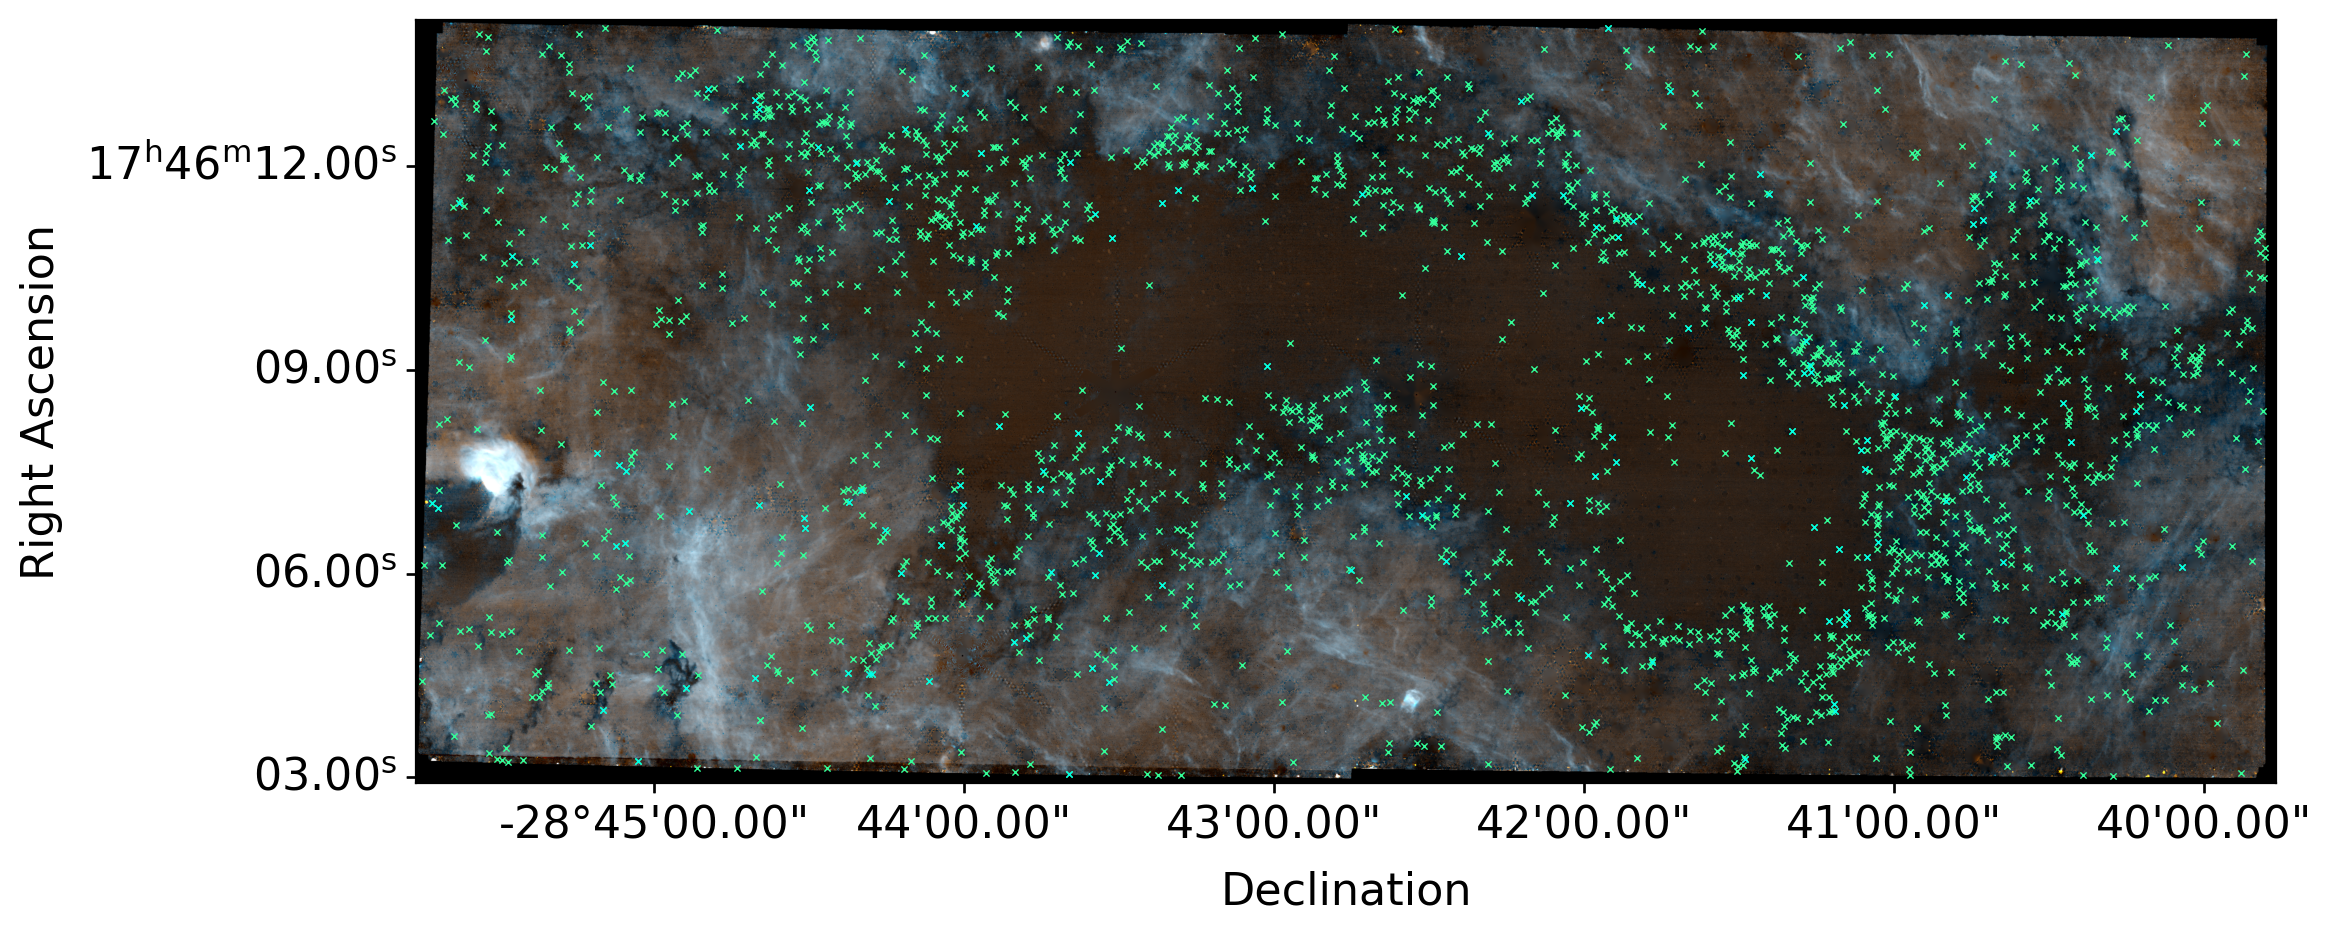
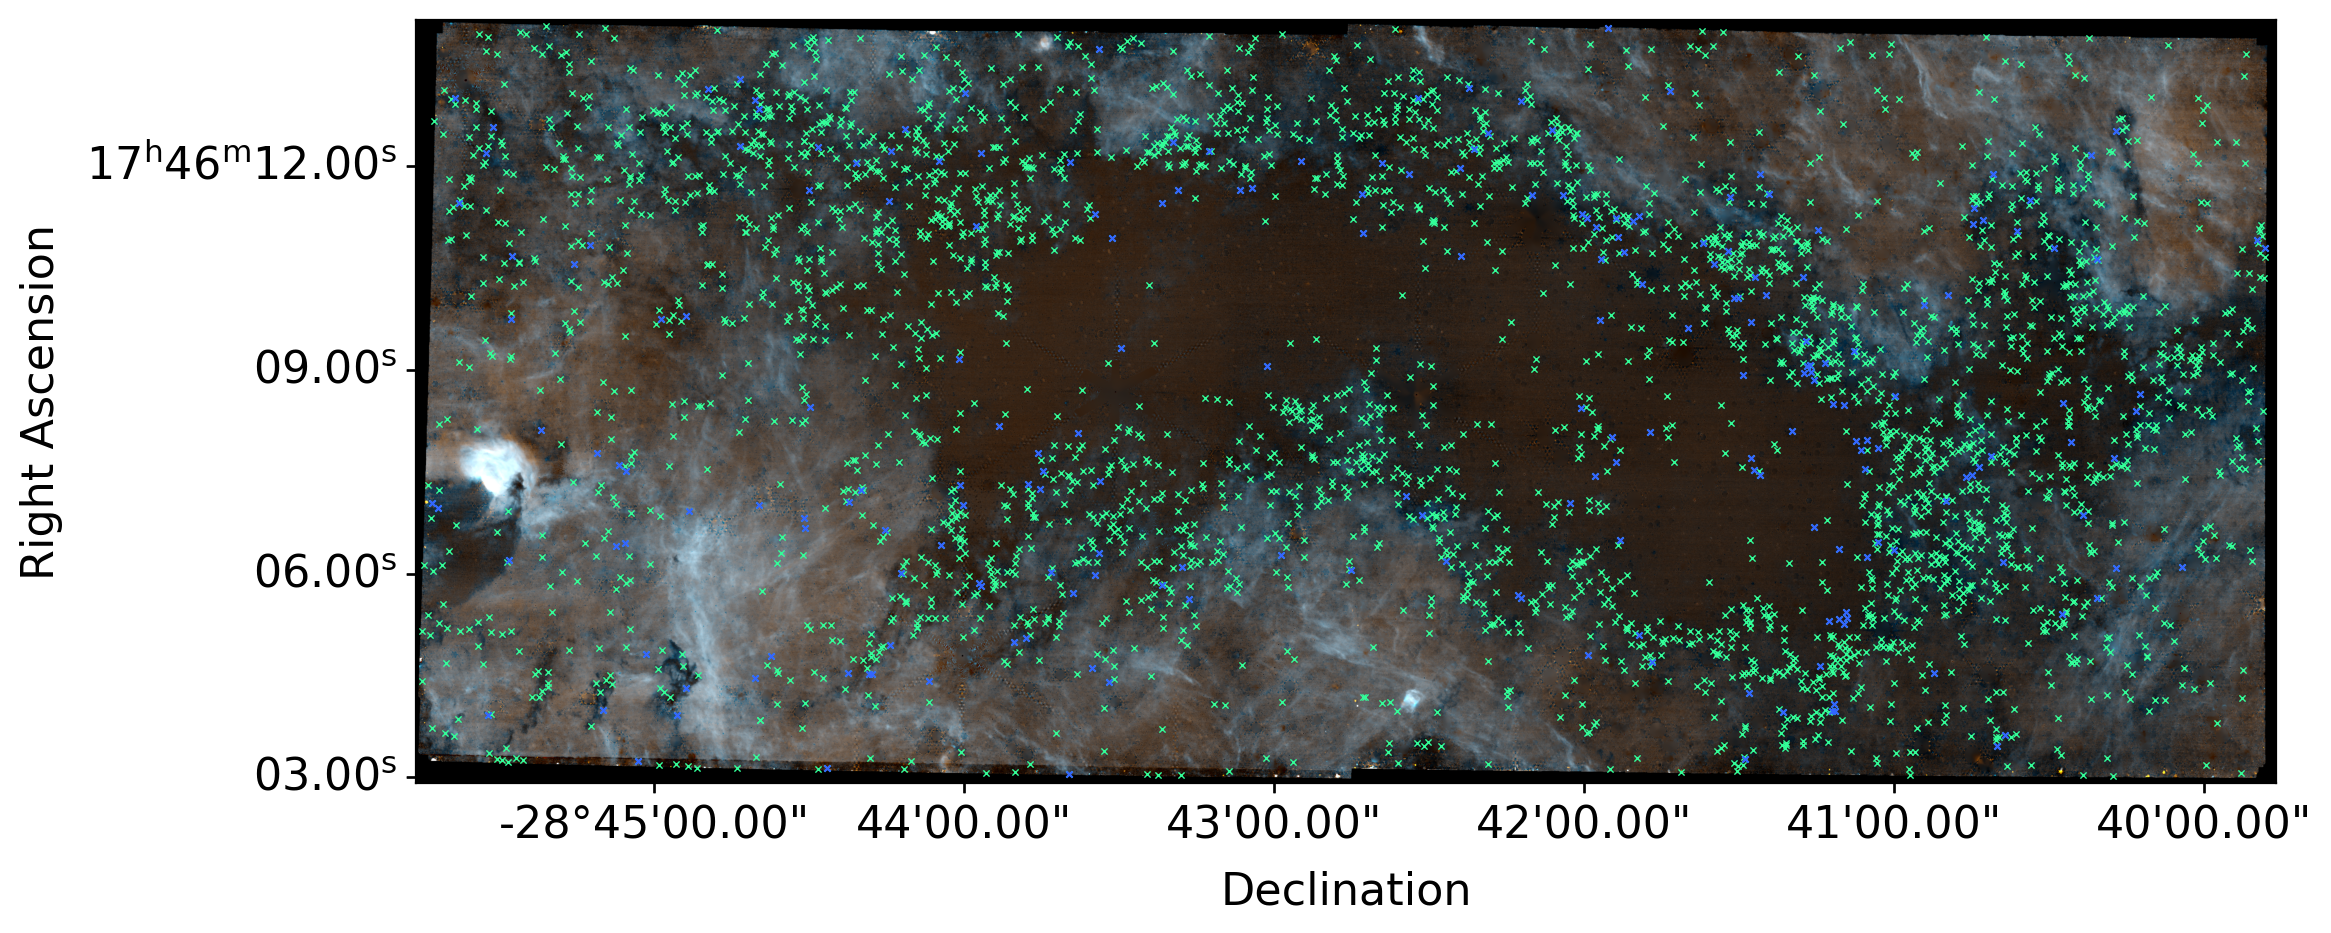
There is an overall asymmetry in the star formation seen both in JWST (HII regions) and ALMA (embedded YSOs)
What ALMA sees, JWST doesn't: 0/700 point source matches, though still investigating extended sources (HII regions, outflow cavities)
480
405
187

182
162
140
360
335
210
480
410
405
Interesting feature highlight reel
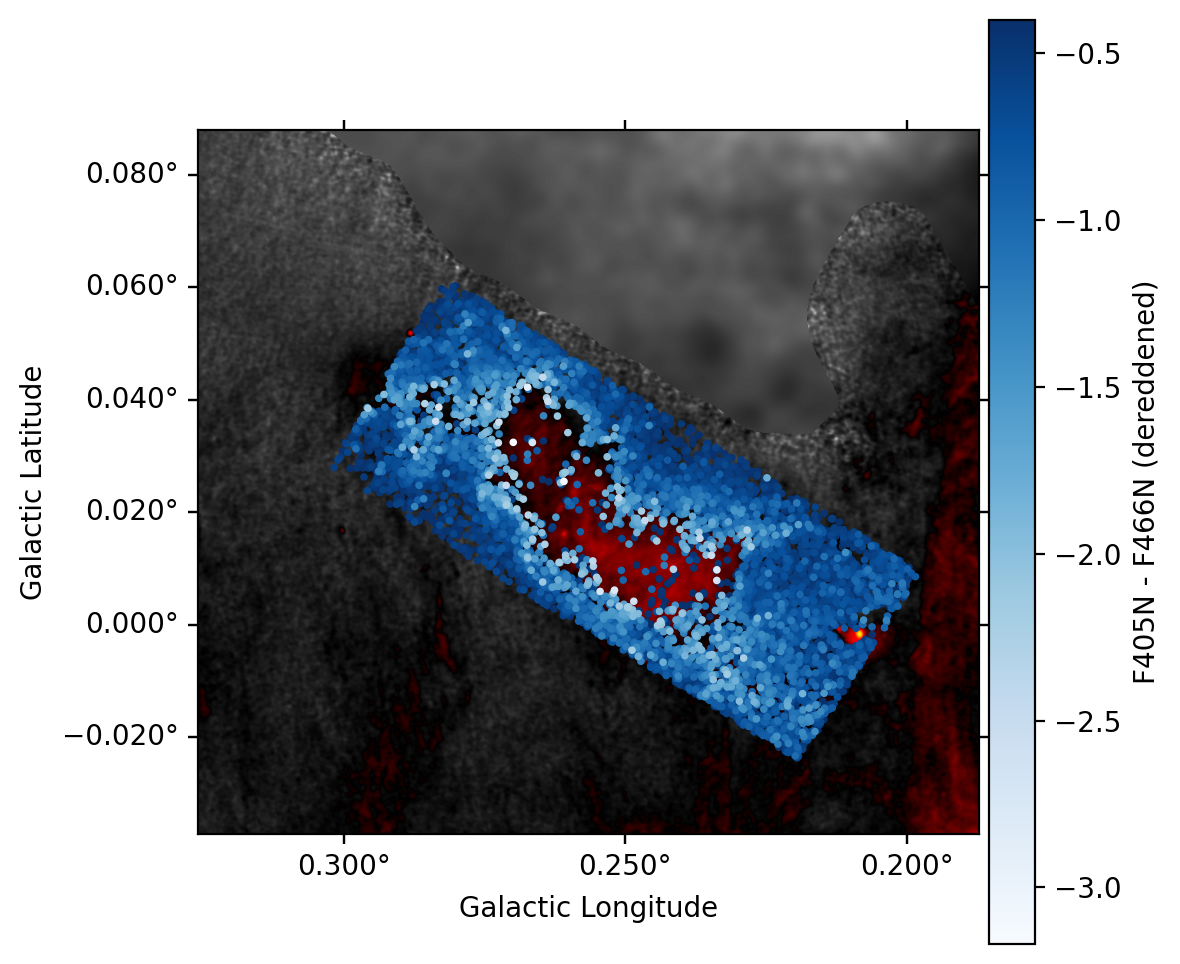
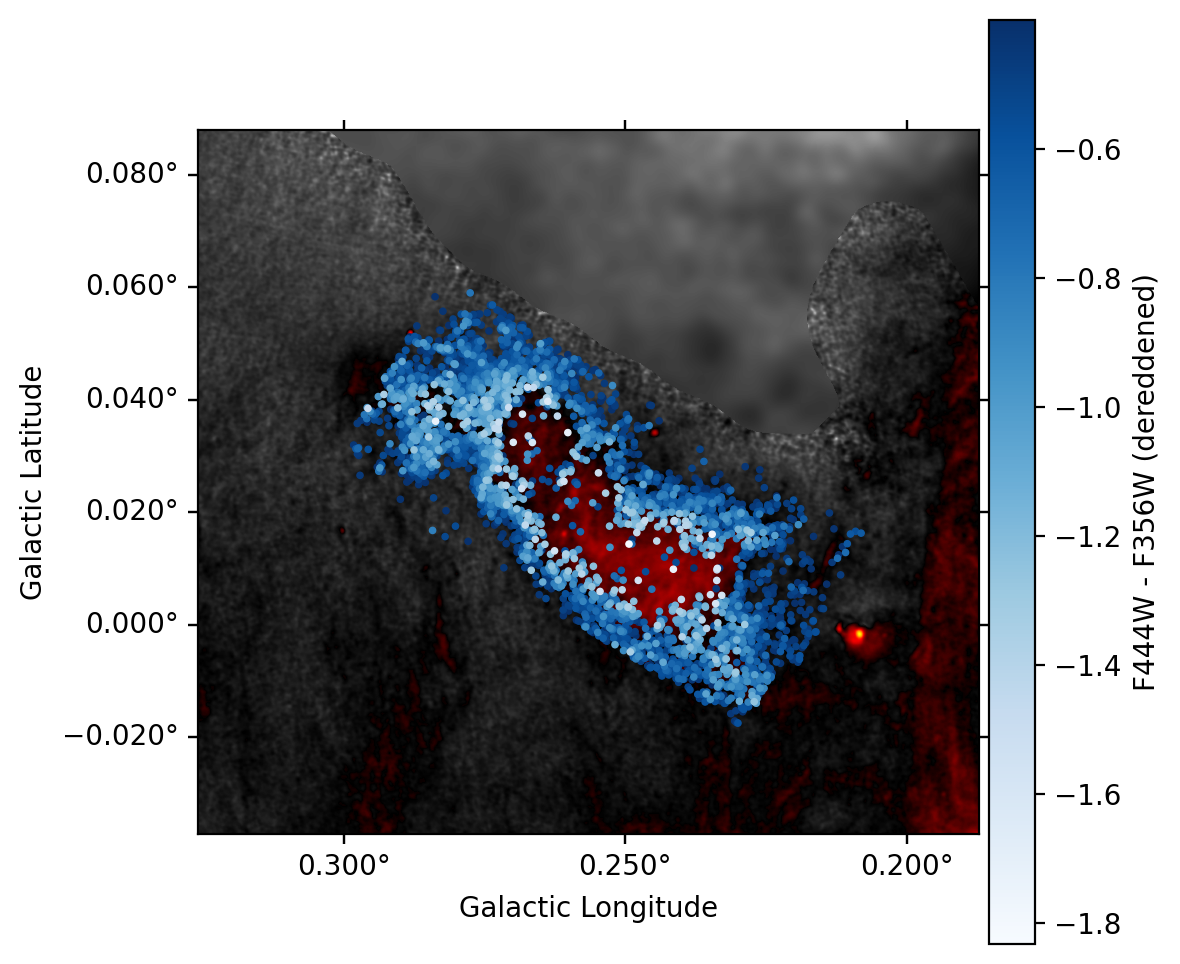
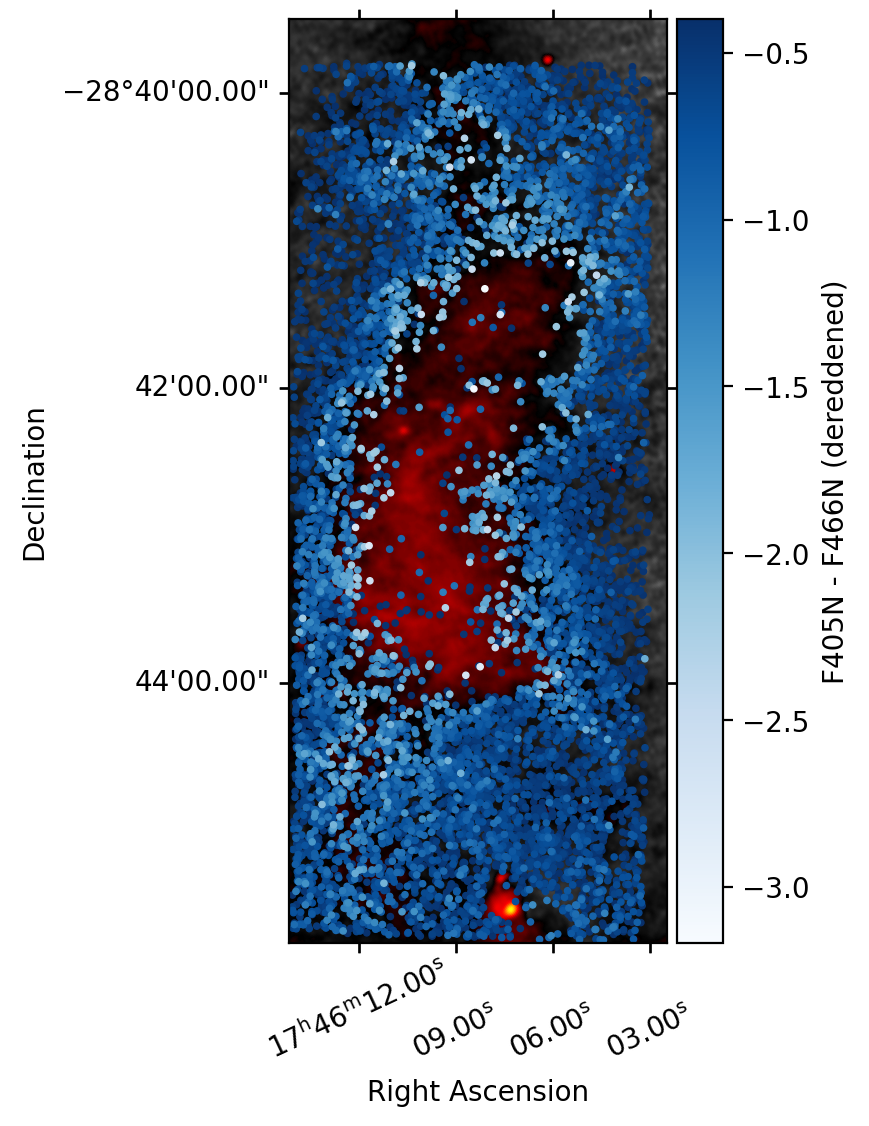
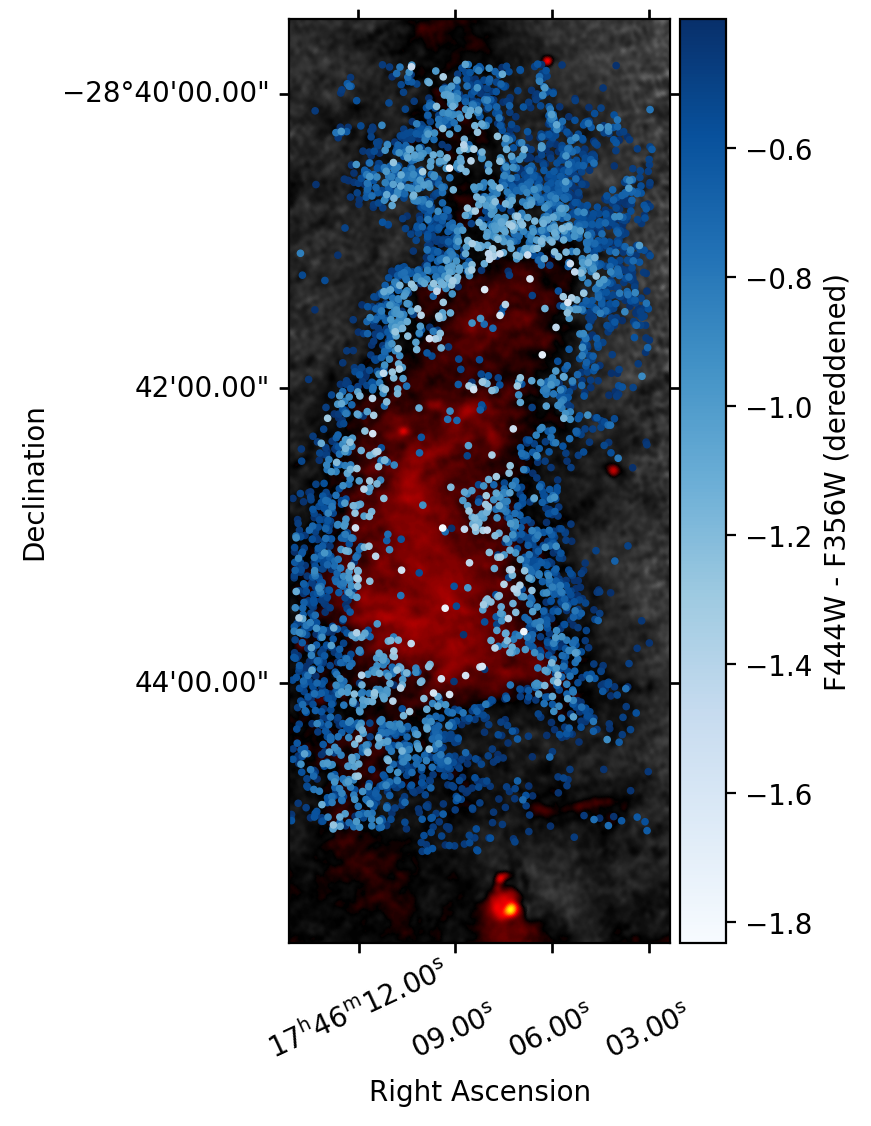
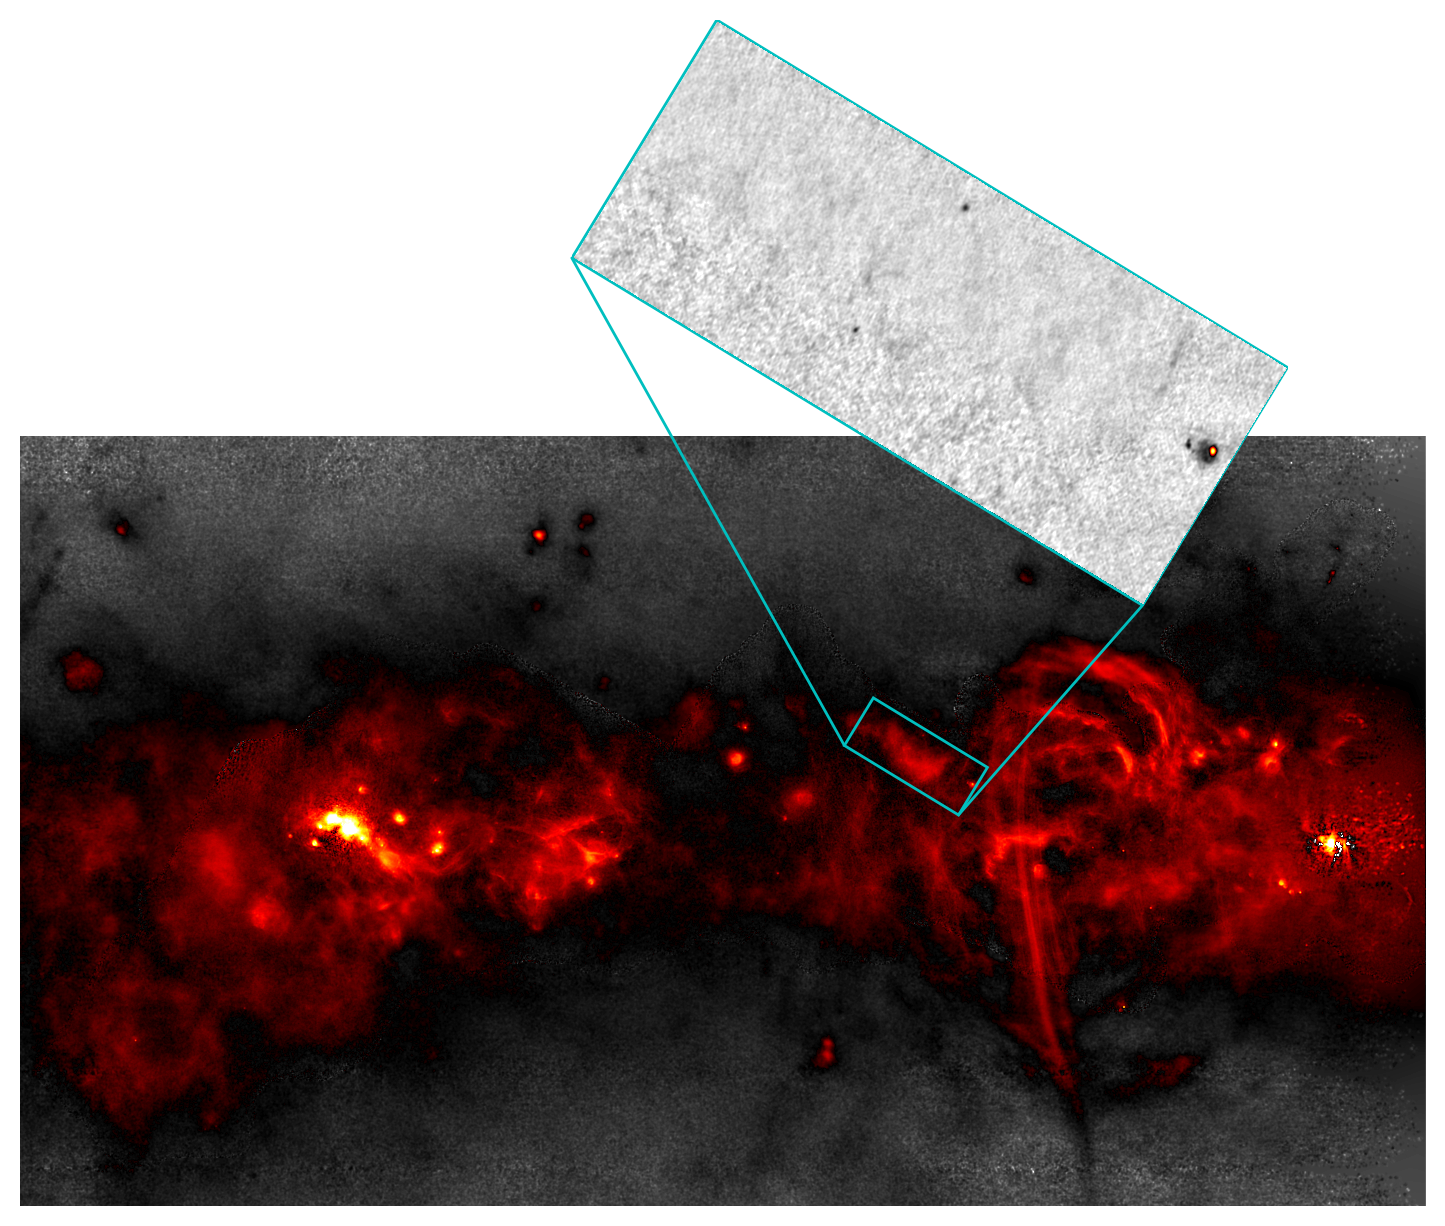
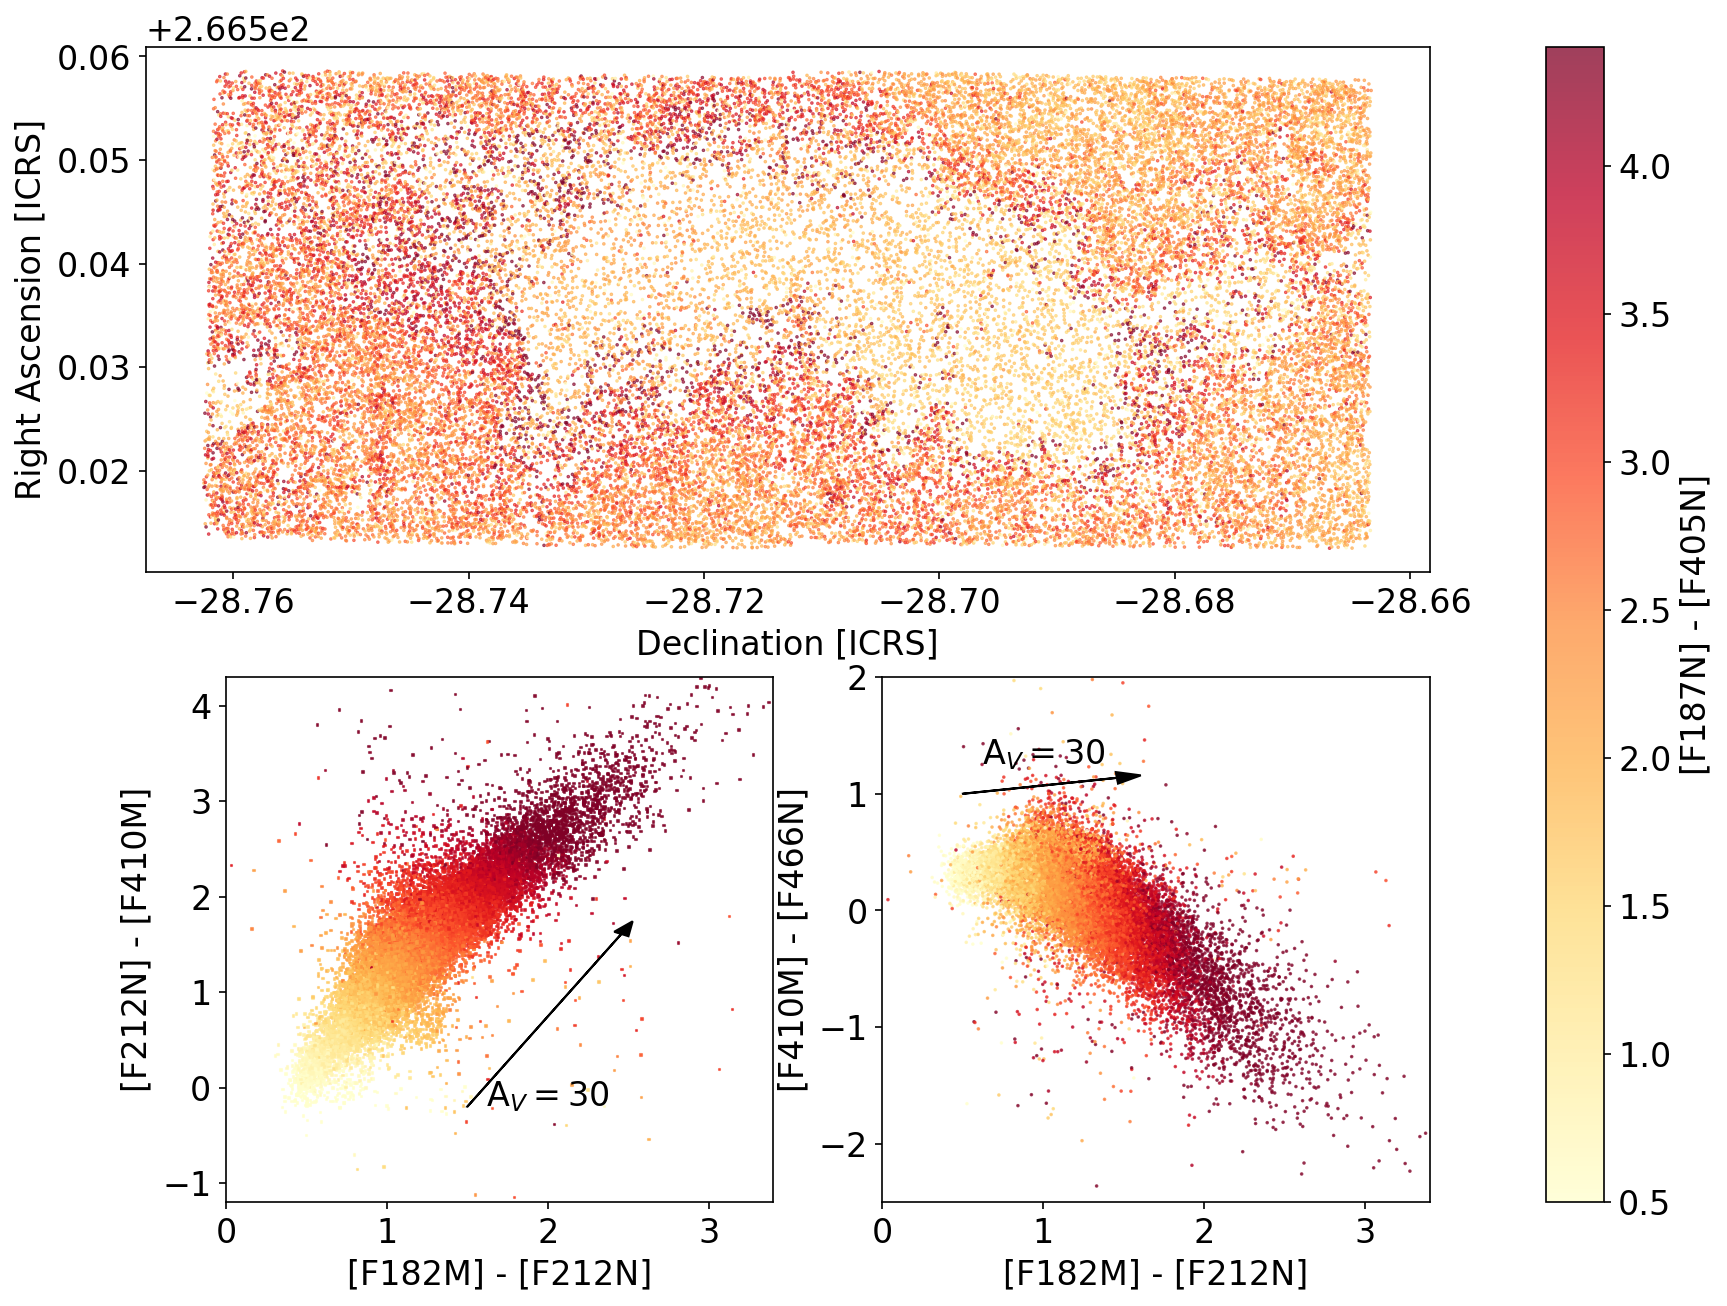
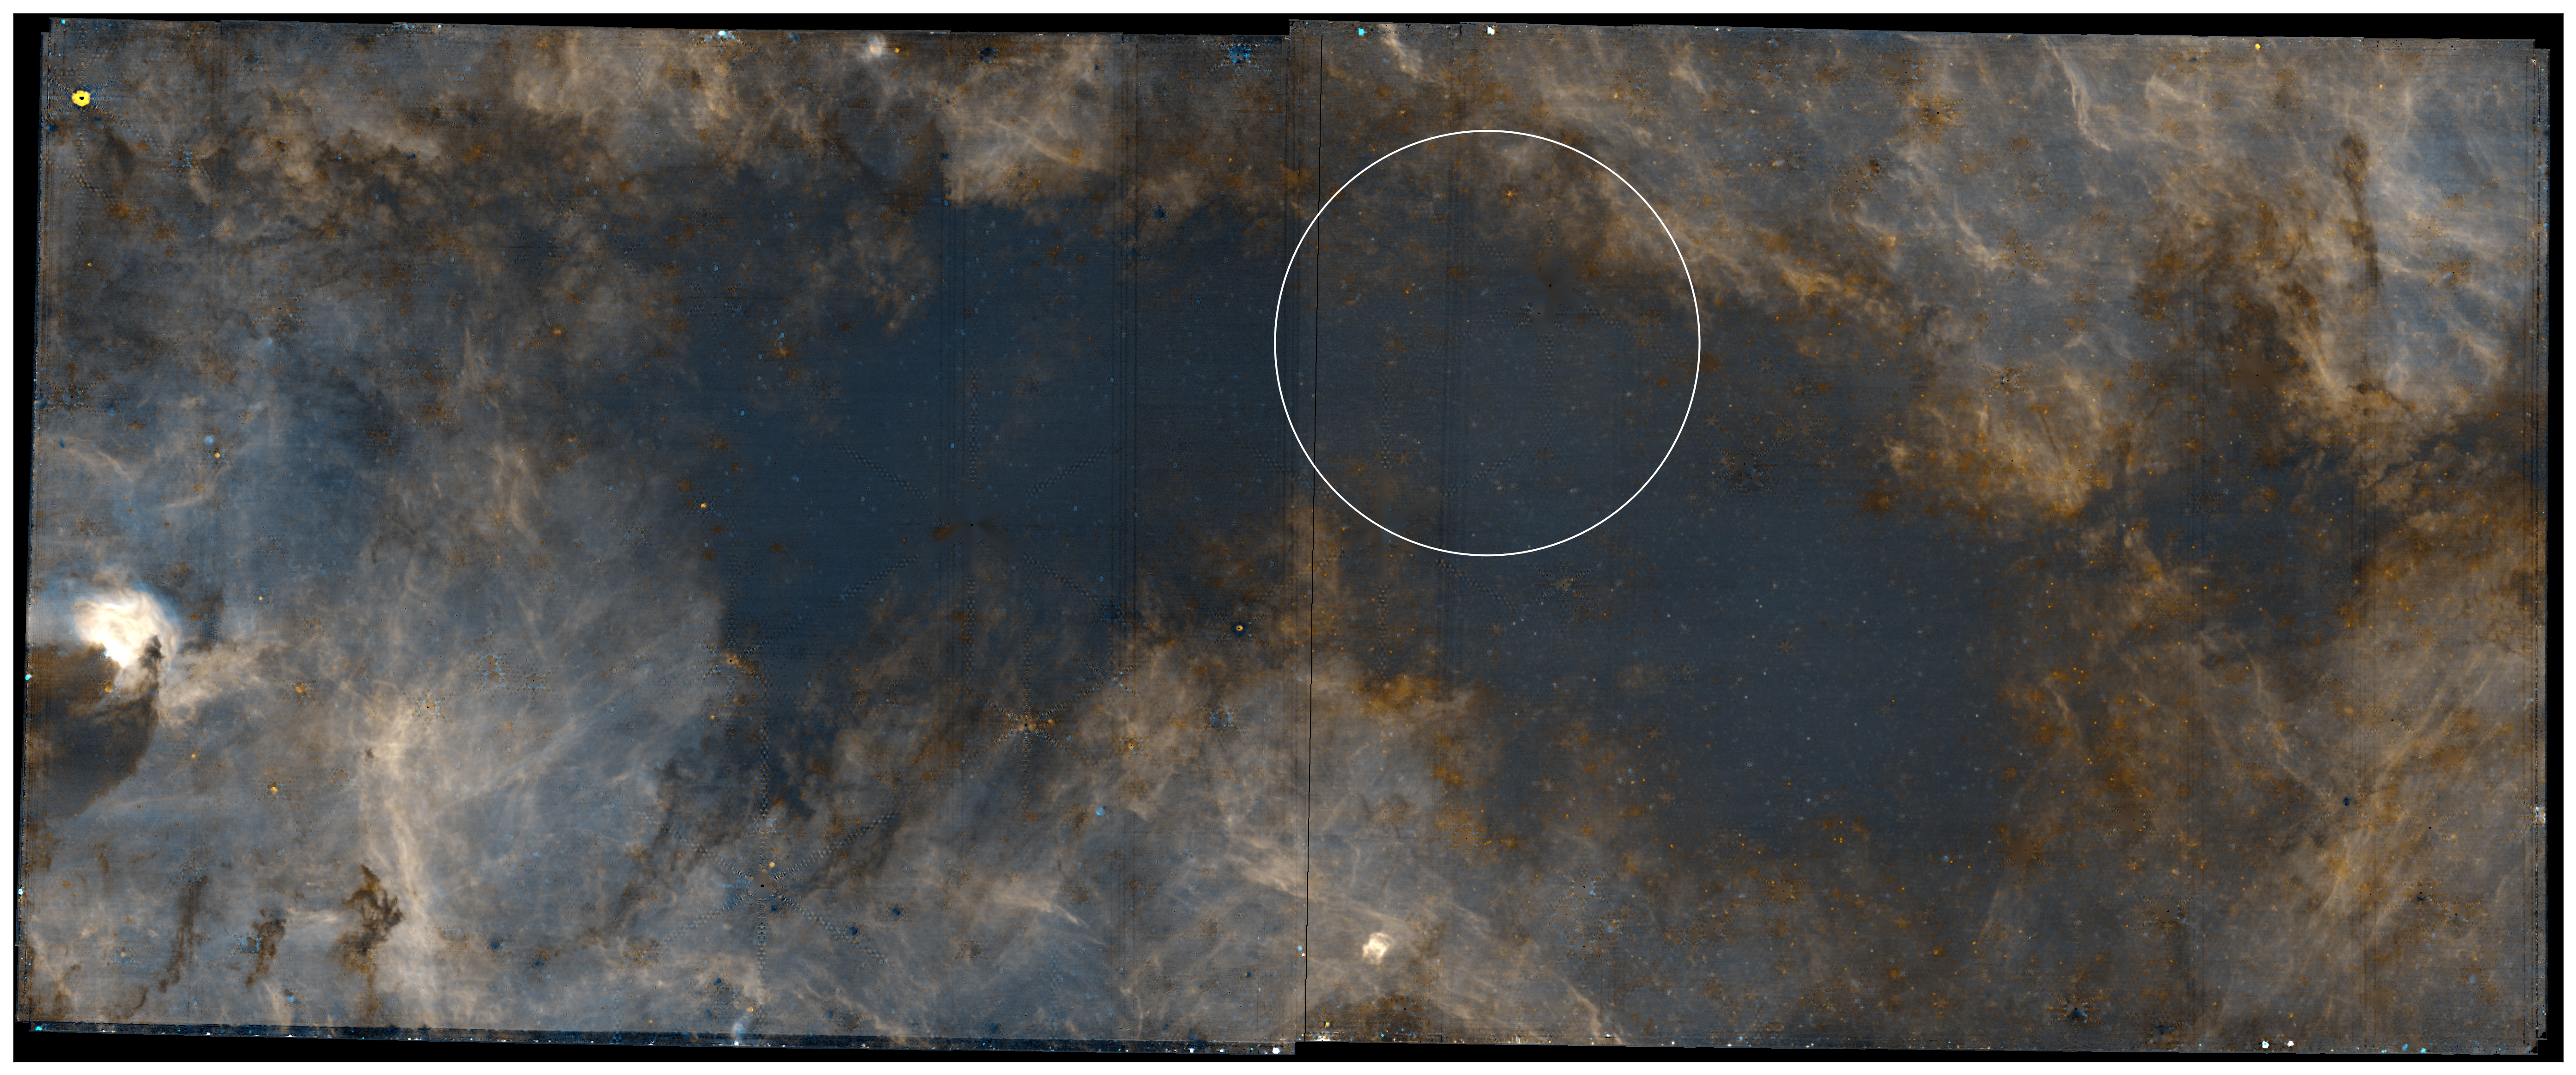
IRS2E is saturated at all wavelengths $\lambda >2 \mu\mathrm{m}$
The extinction-producing layers seen at short wavelengths are not the ALMA star-forming gas:
this hints at edge-on filamentary (or planar) structures
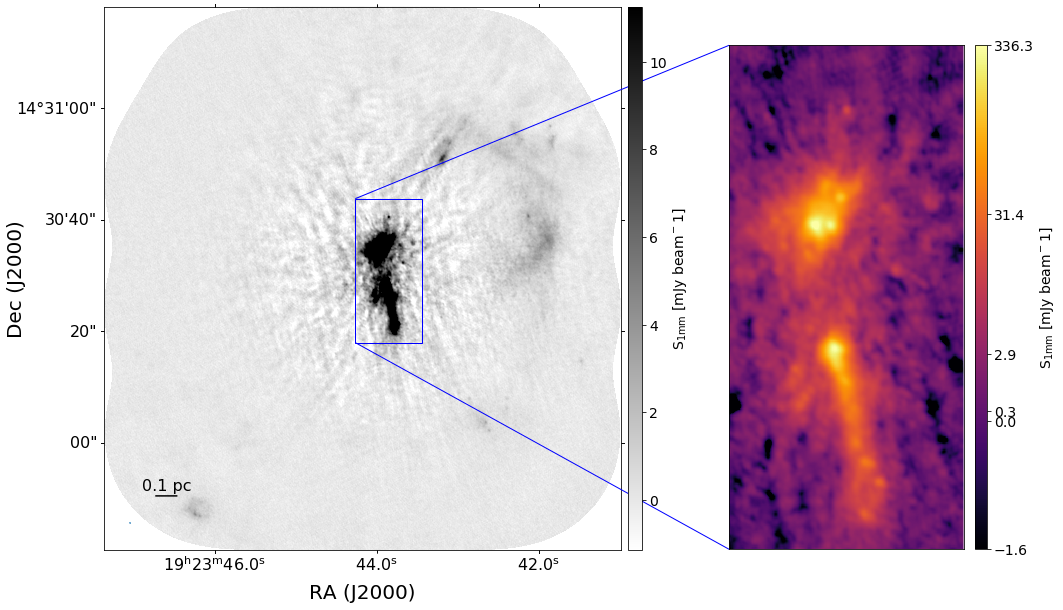
The Galactic Center Dust ridge...

...has a foreground cloud in front
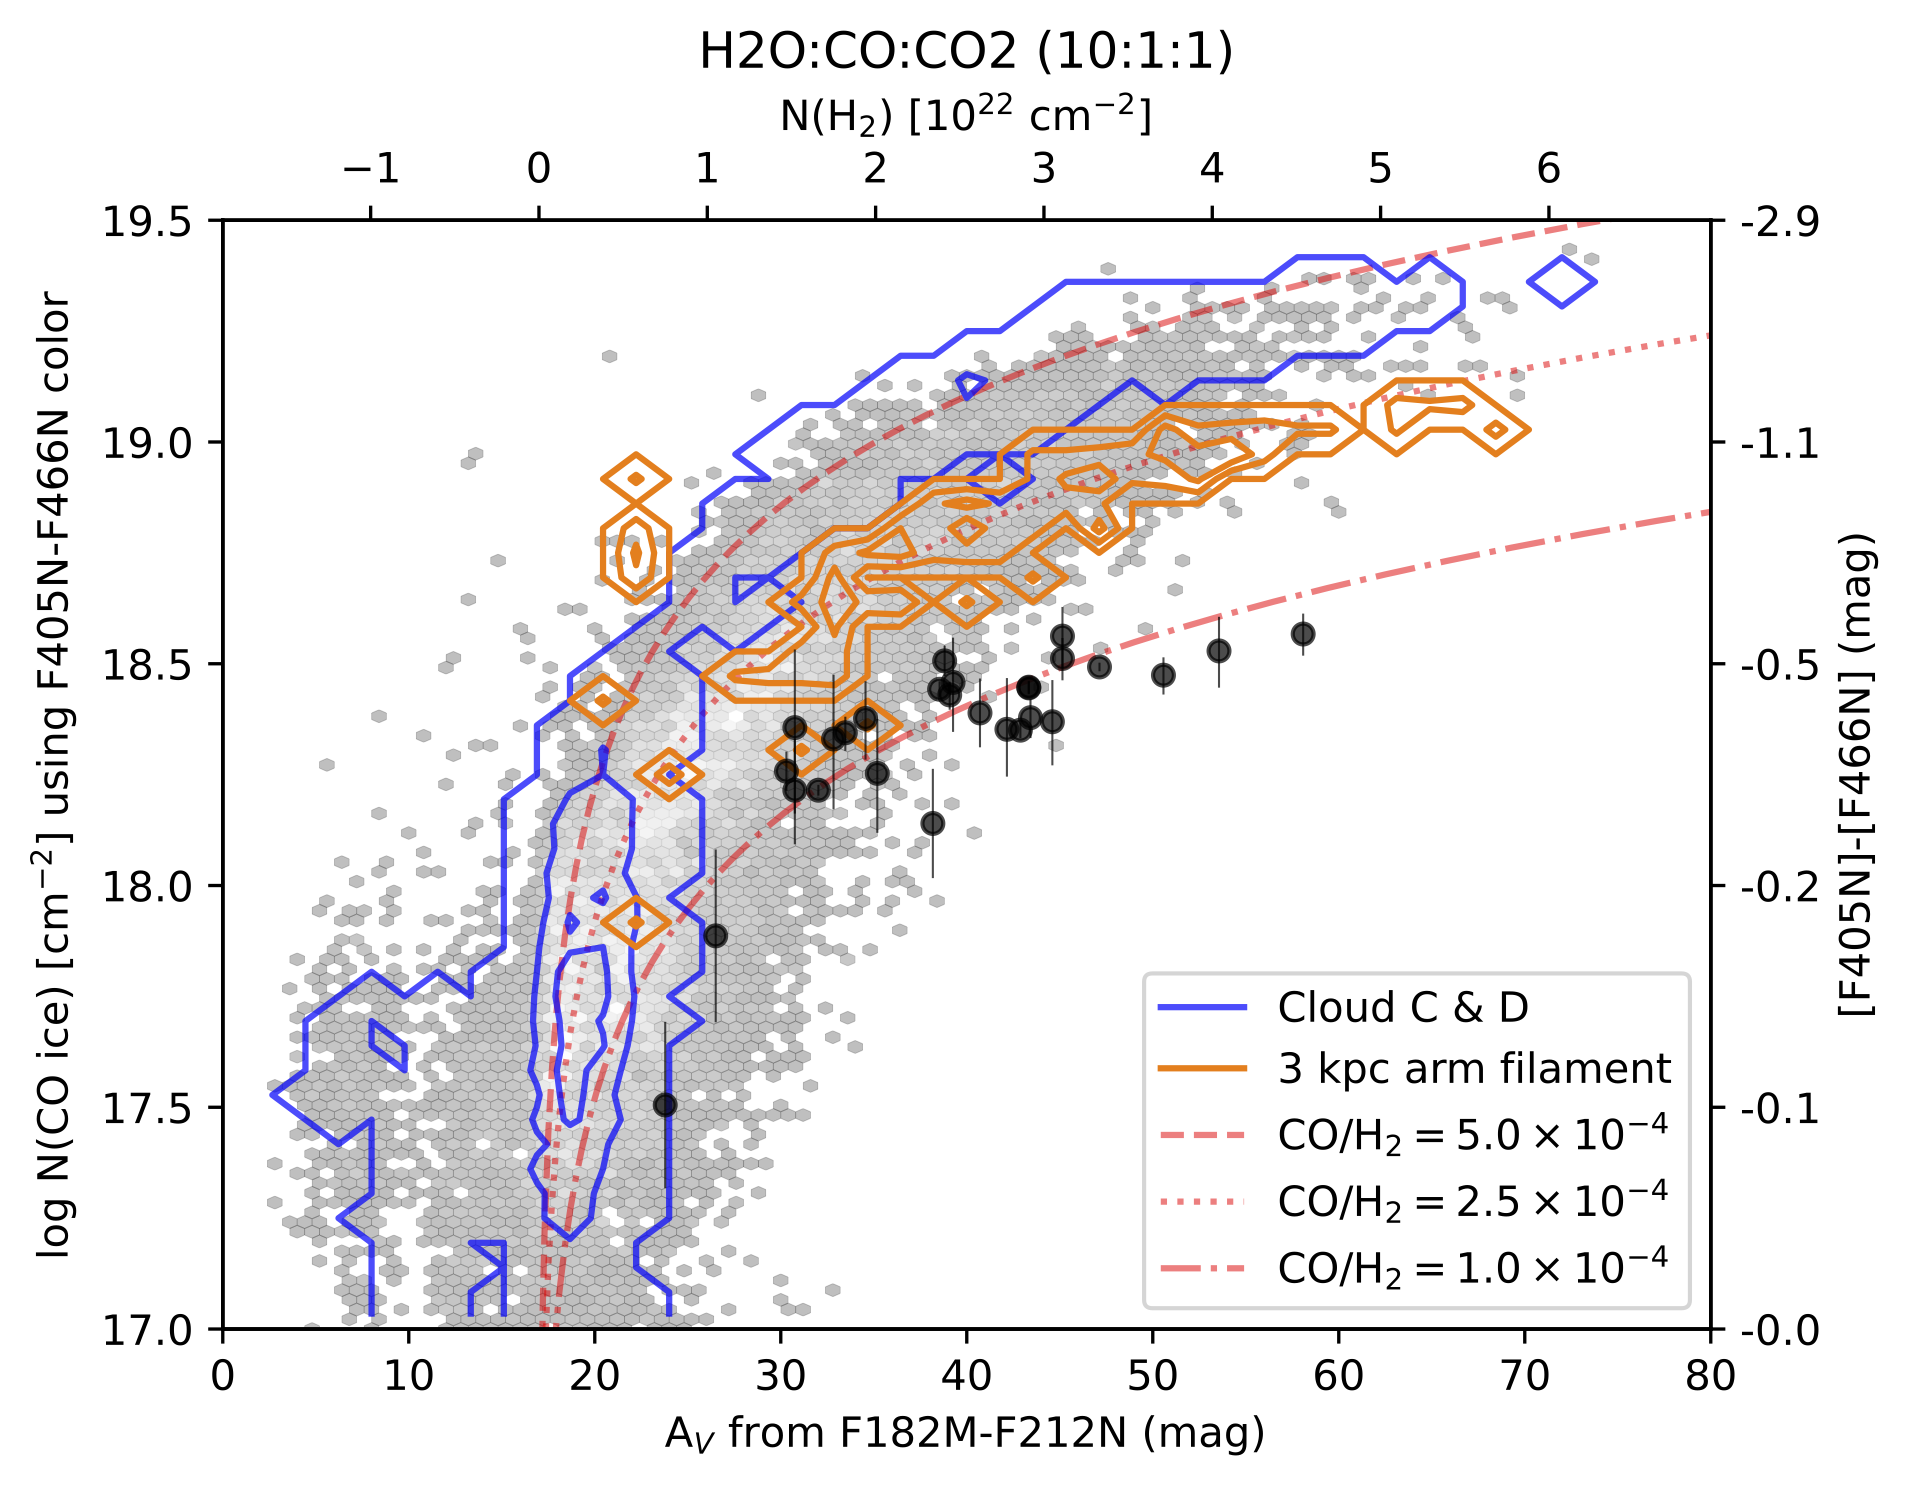
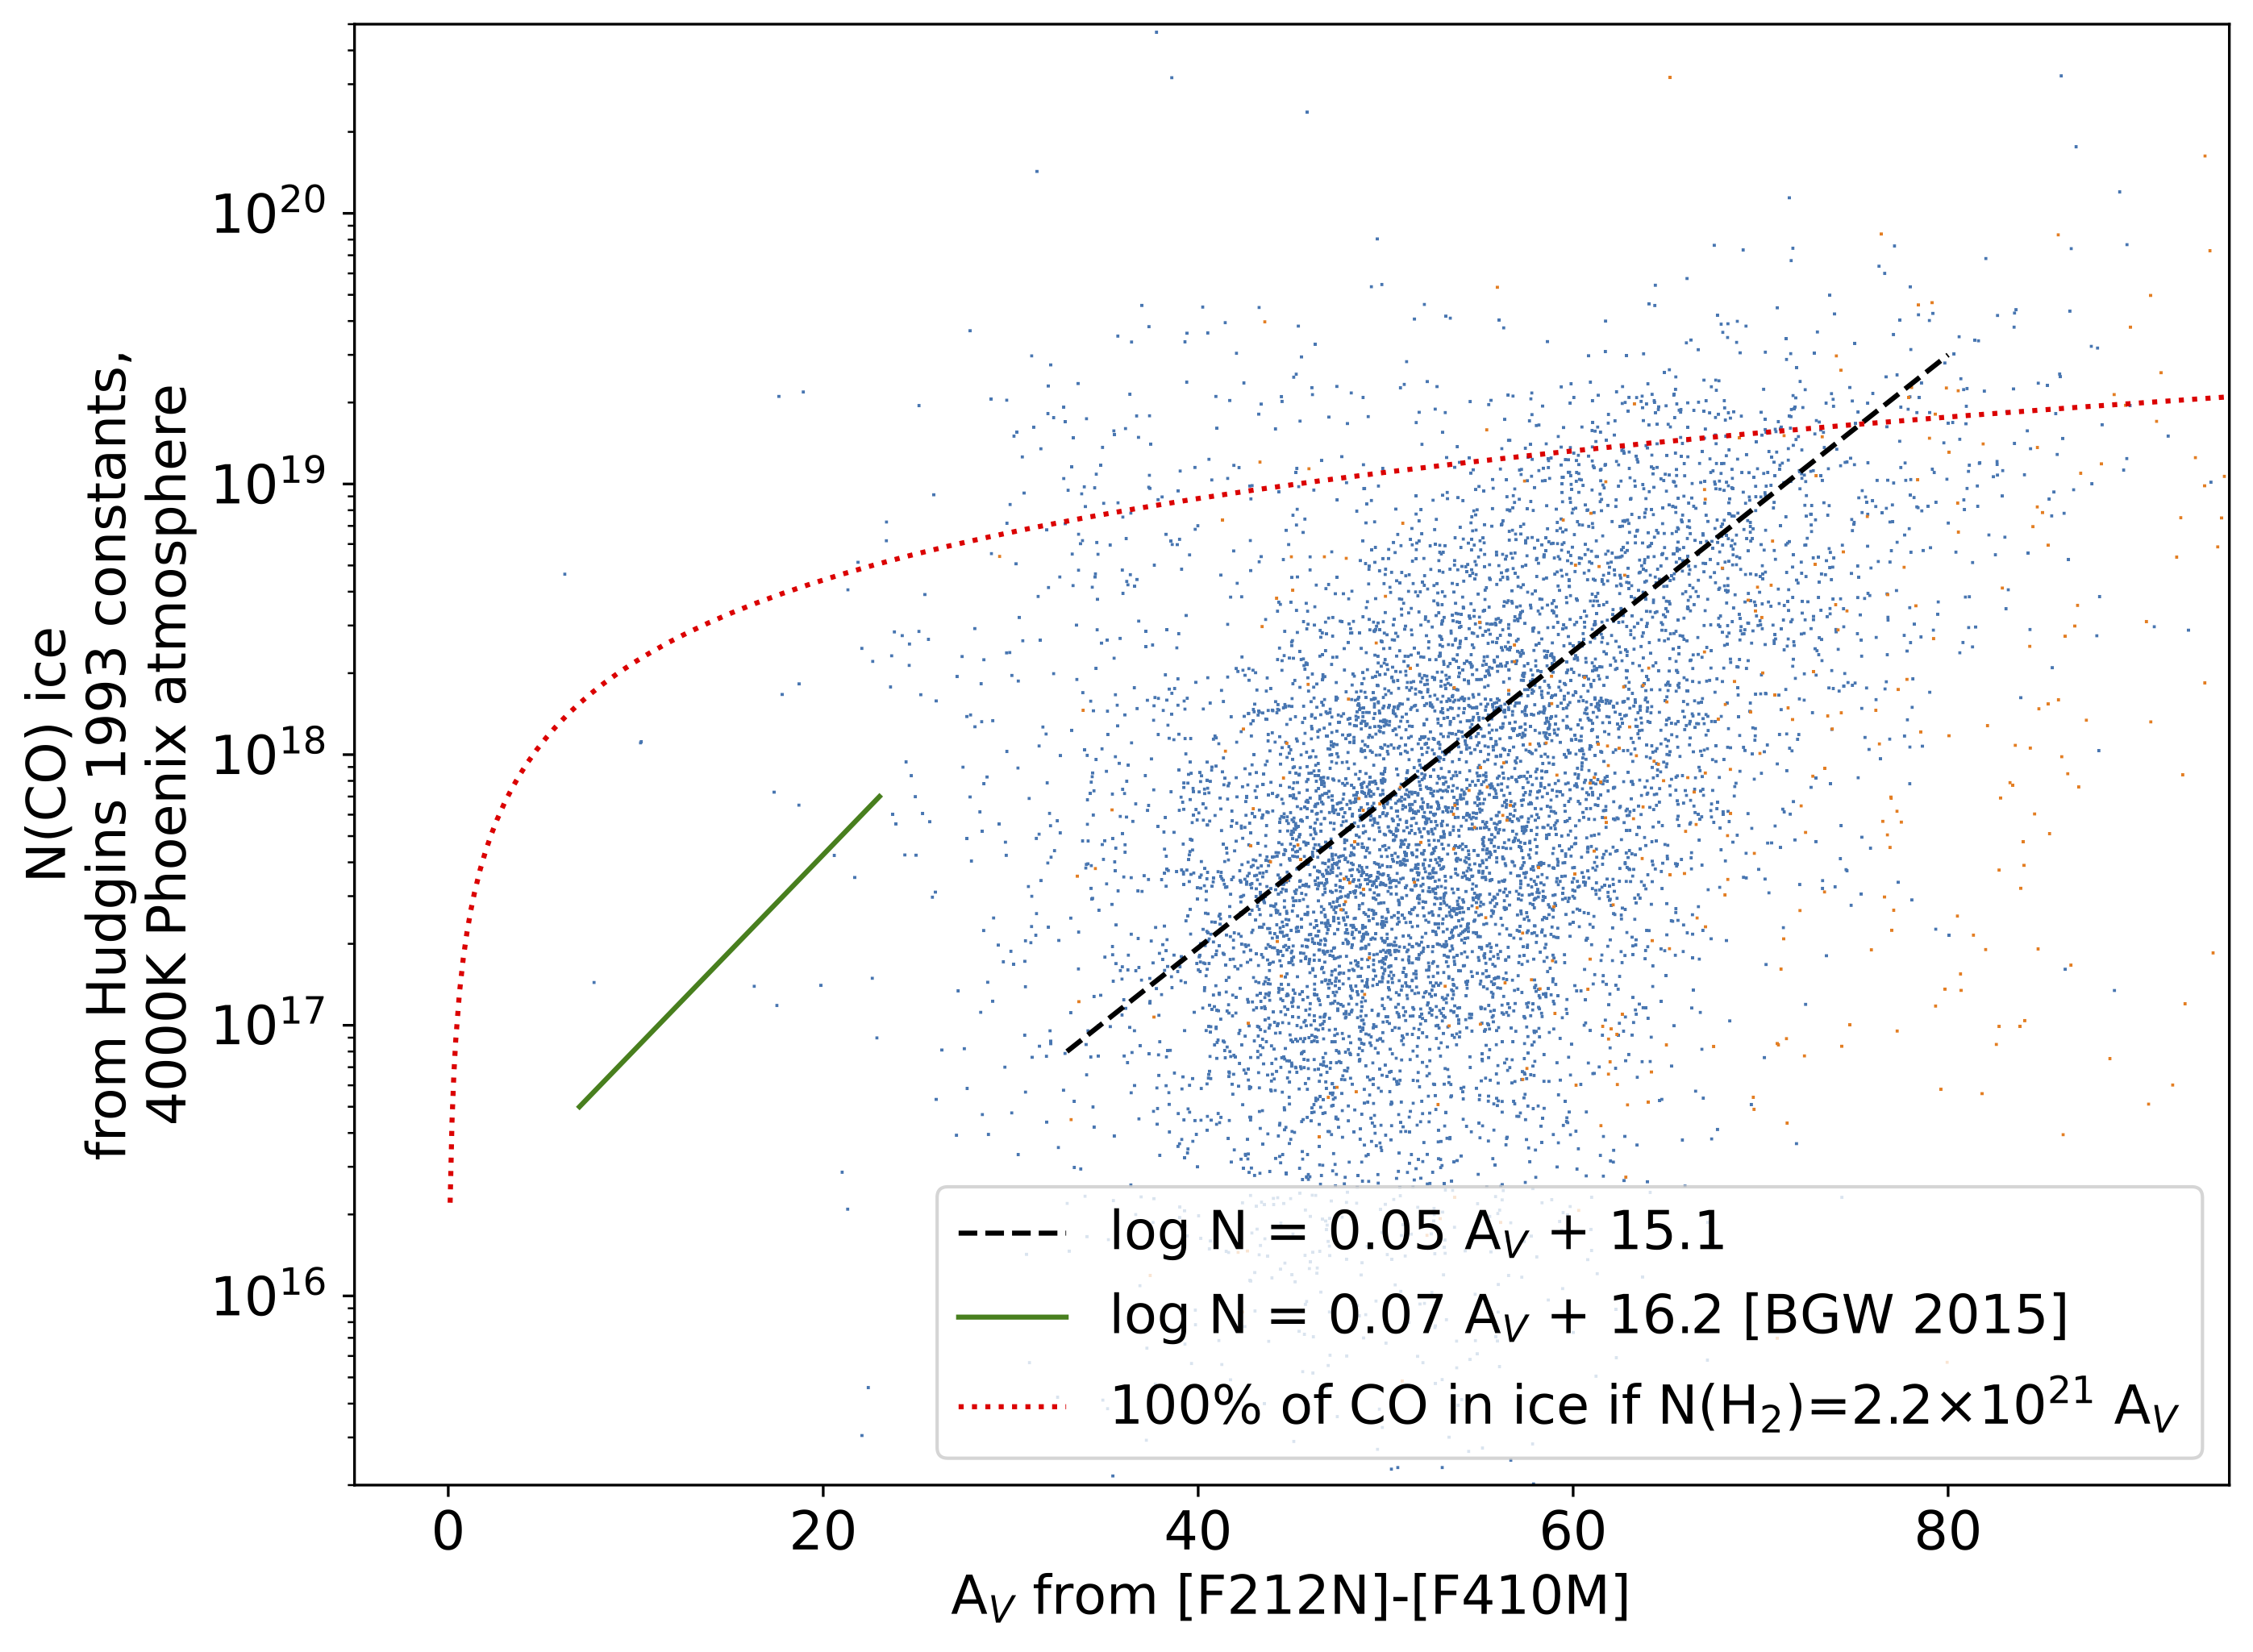
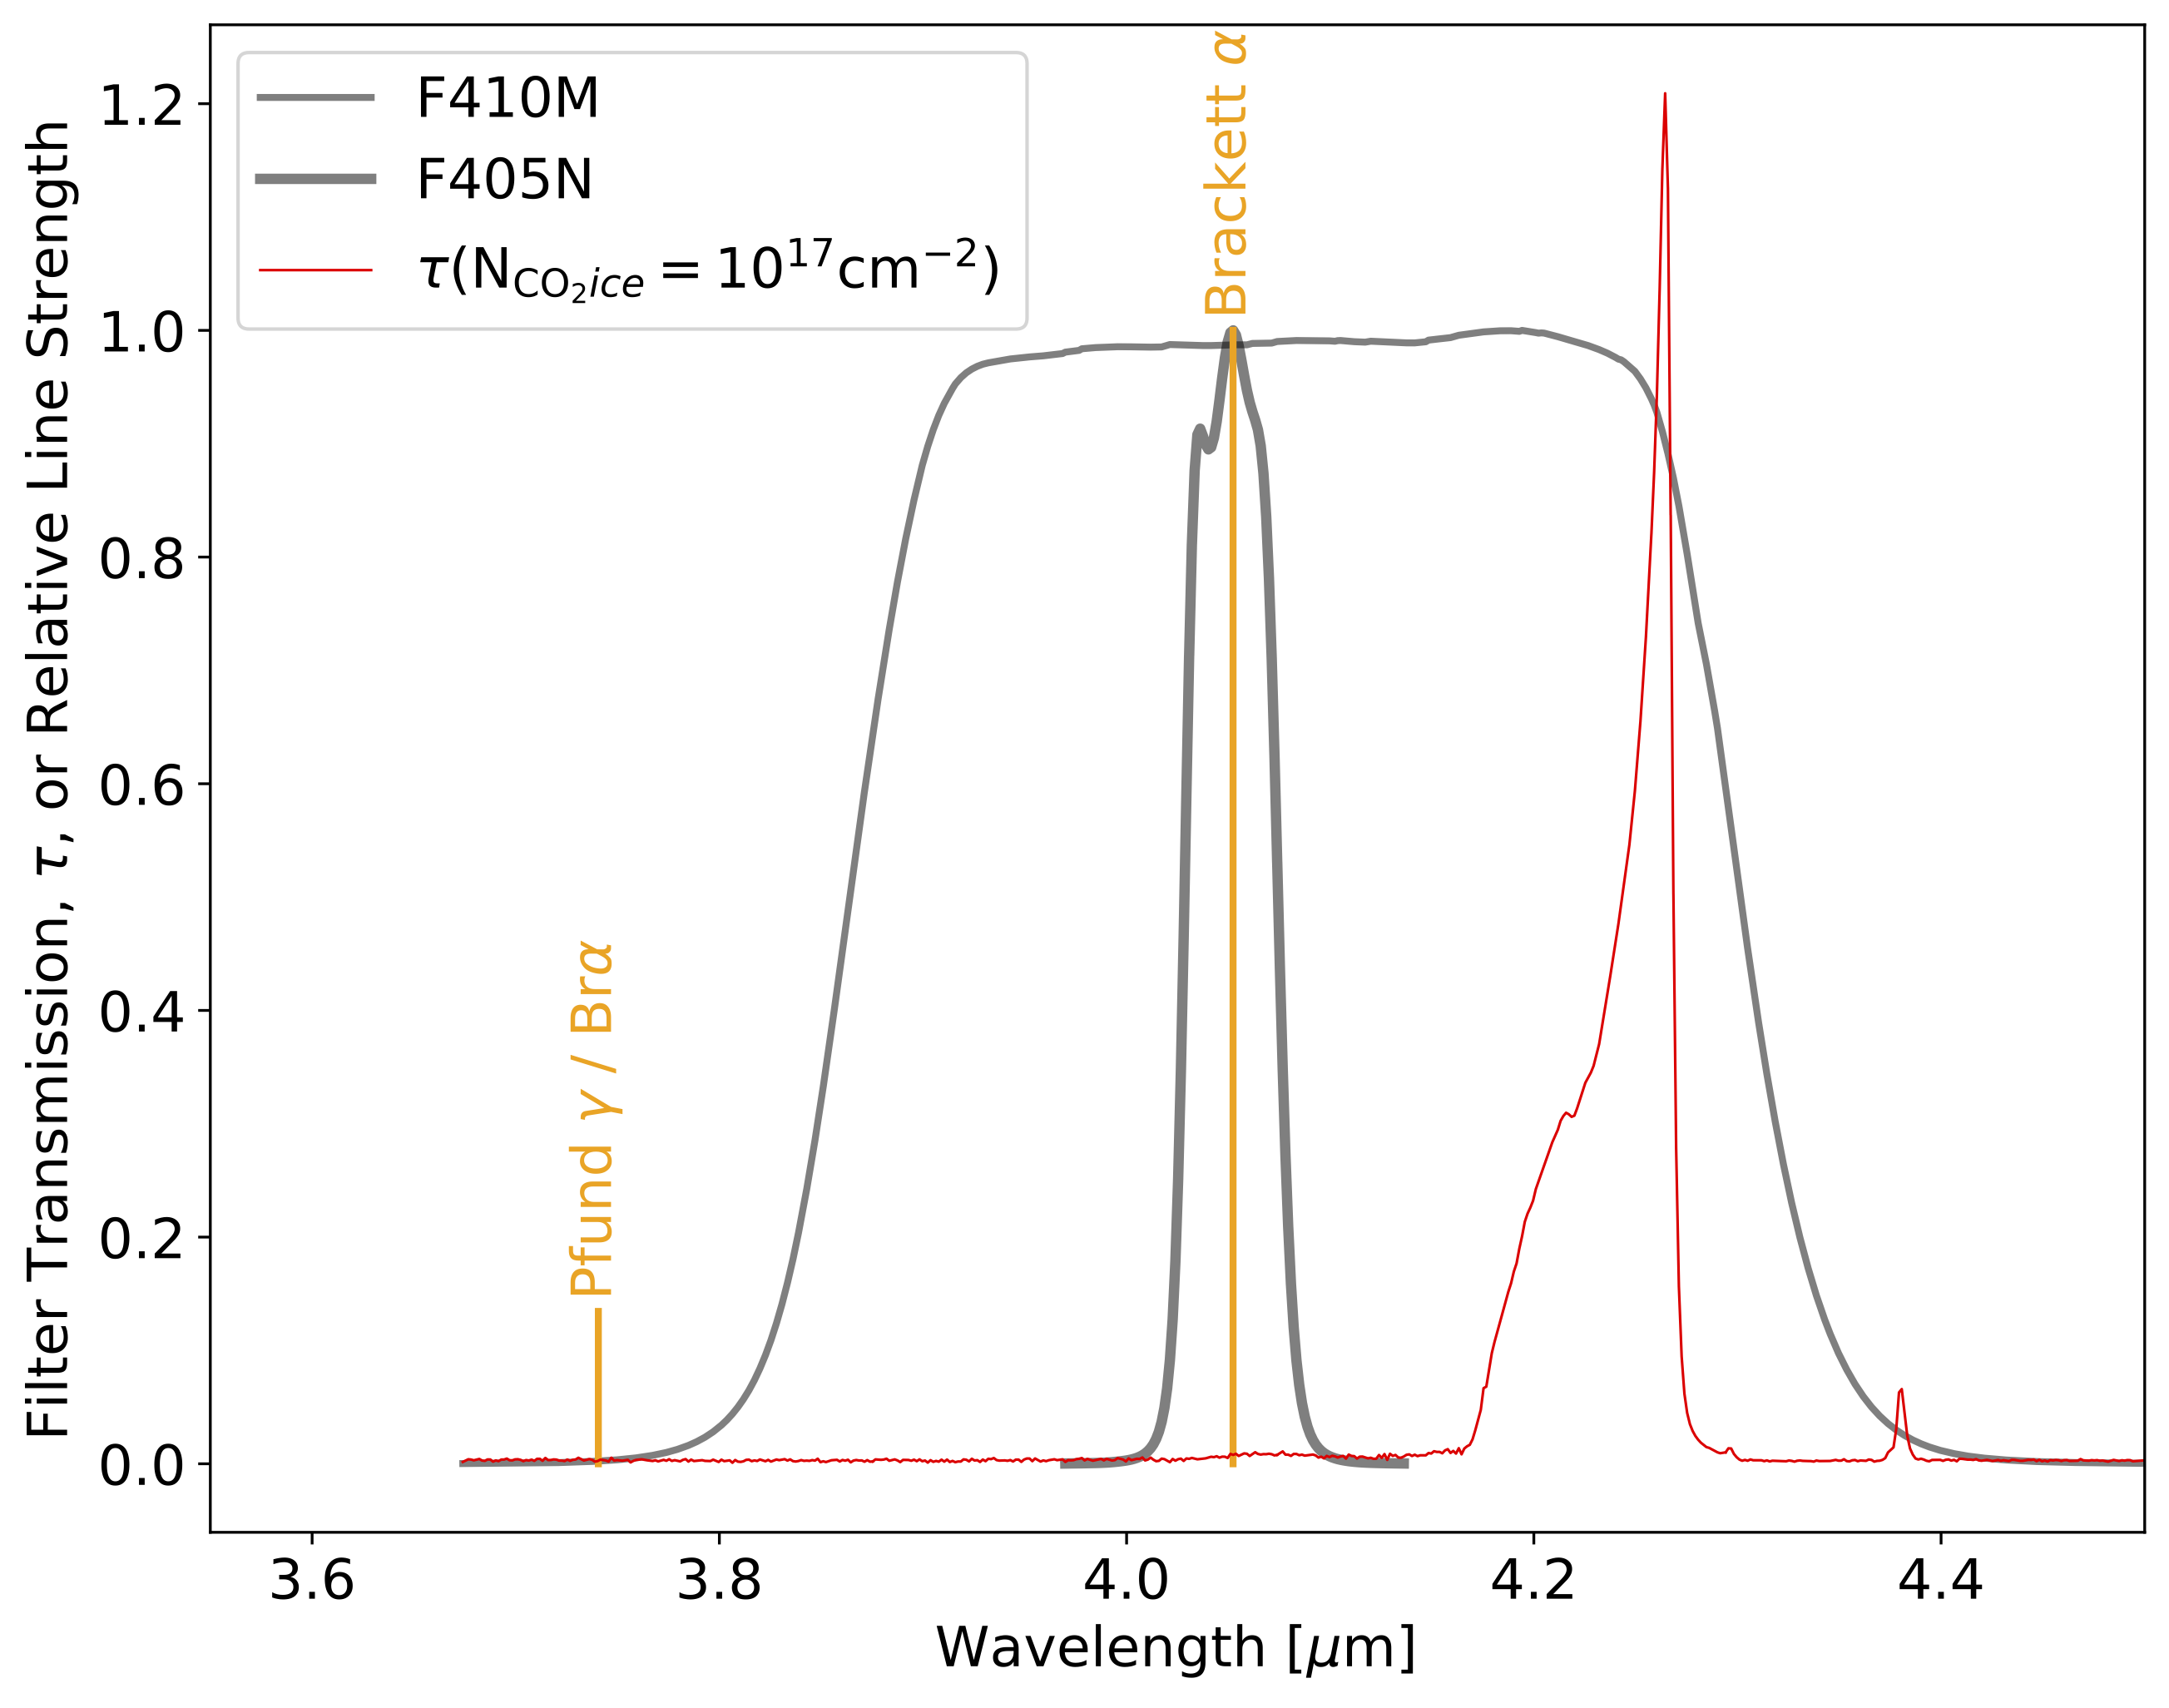
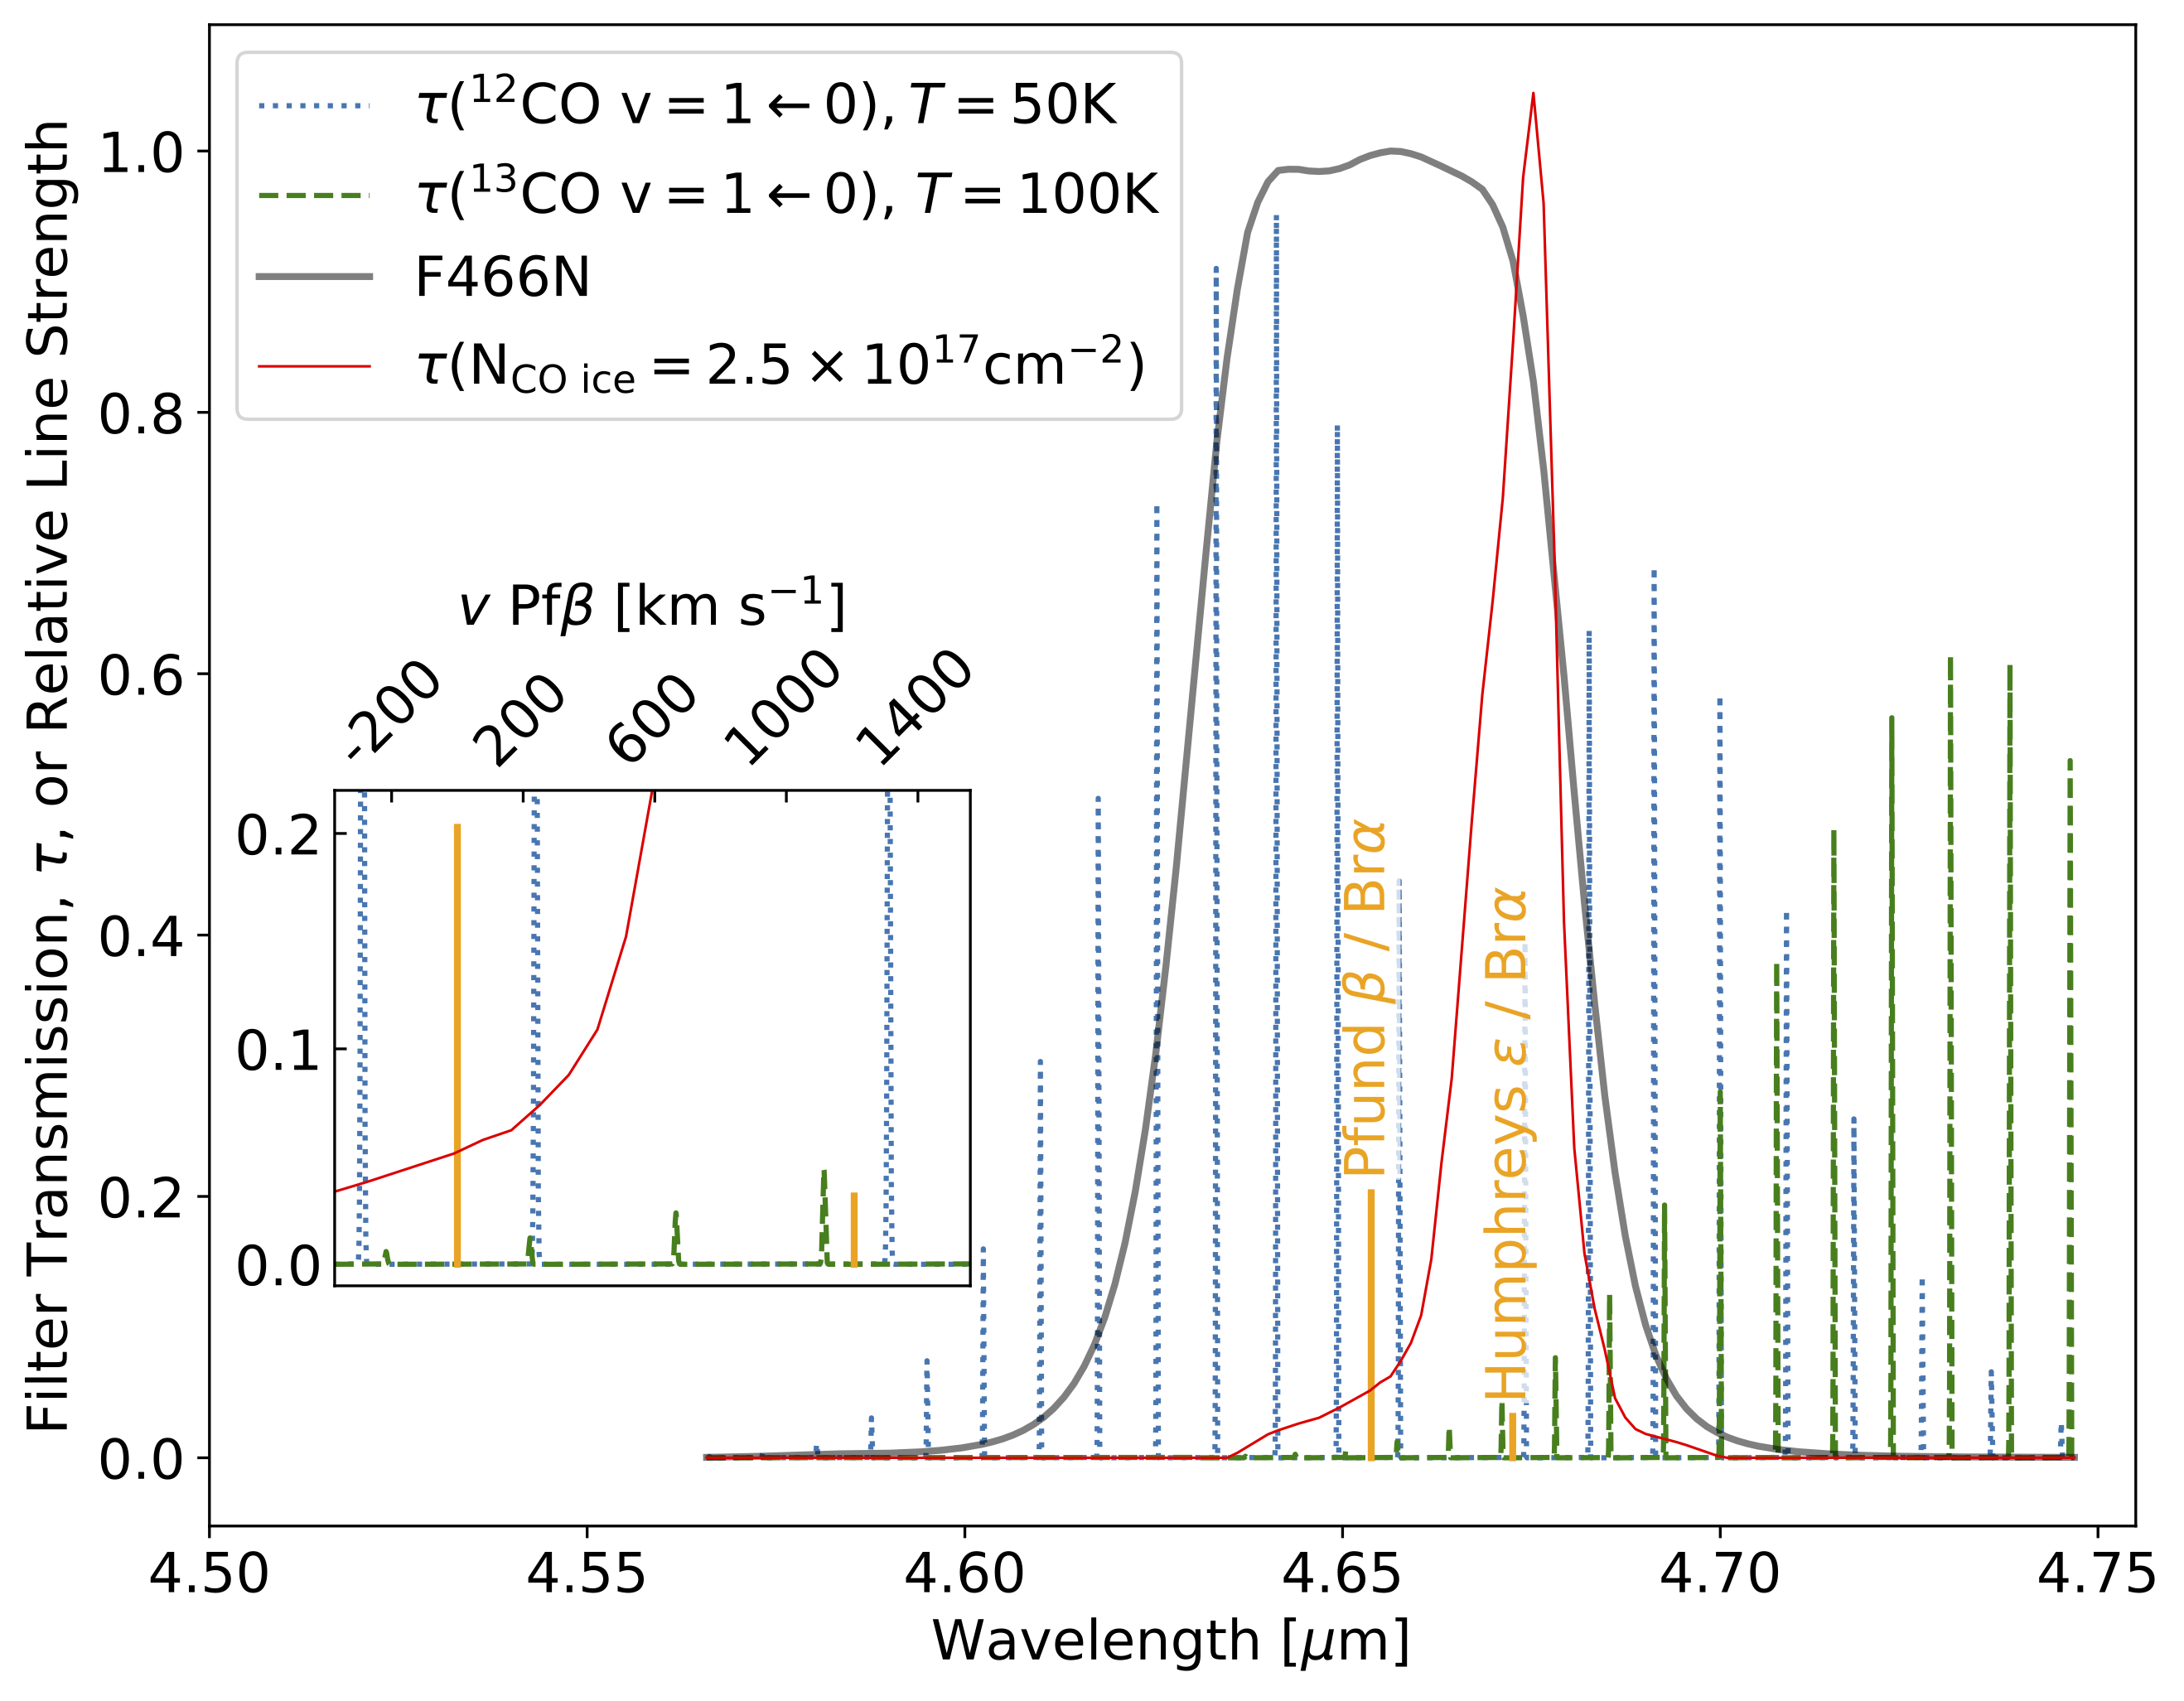
We measure ice via stellar absorption


- YSO model grid is testing accretion models
- Sgr B2 is forming & fragmenting YSOs - asymmetrically
- W51 fragments are dominated by most massive
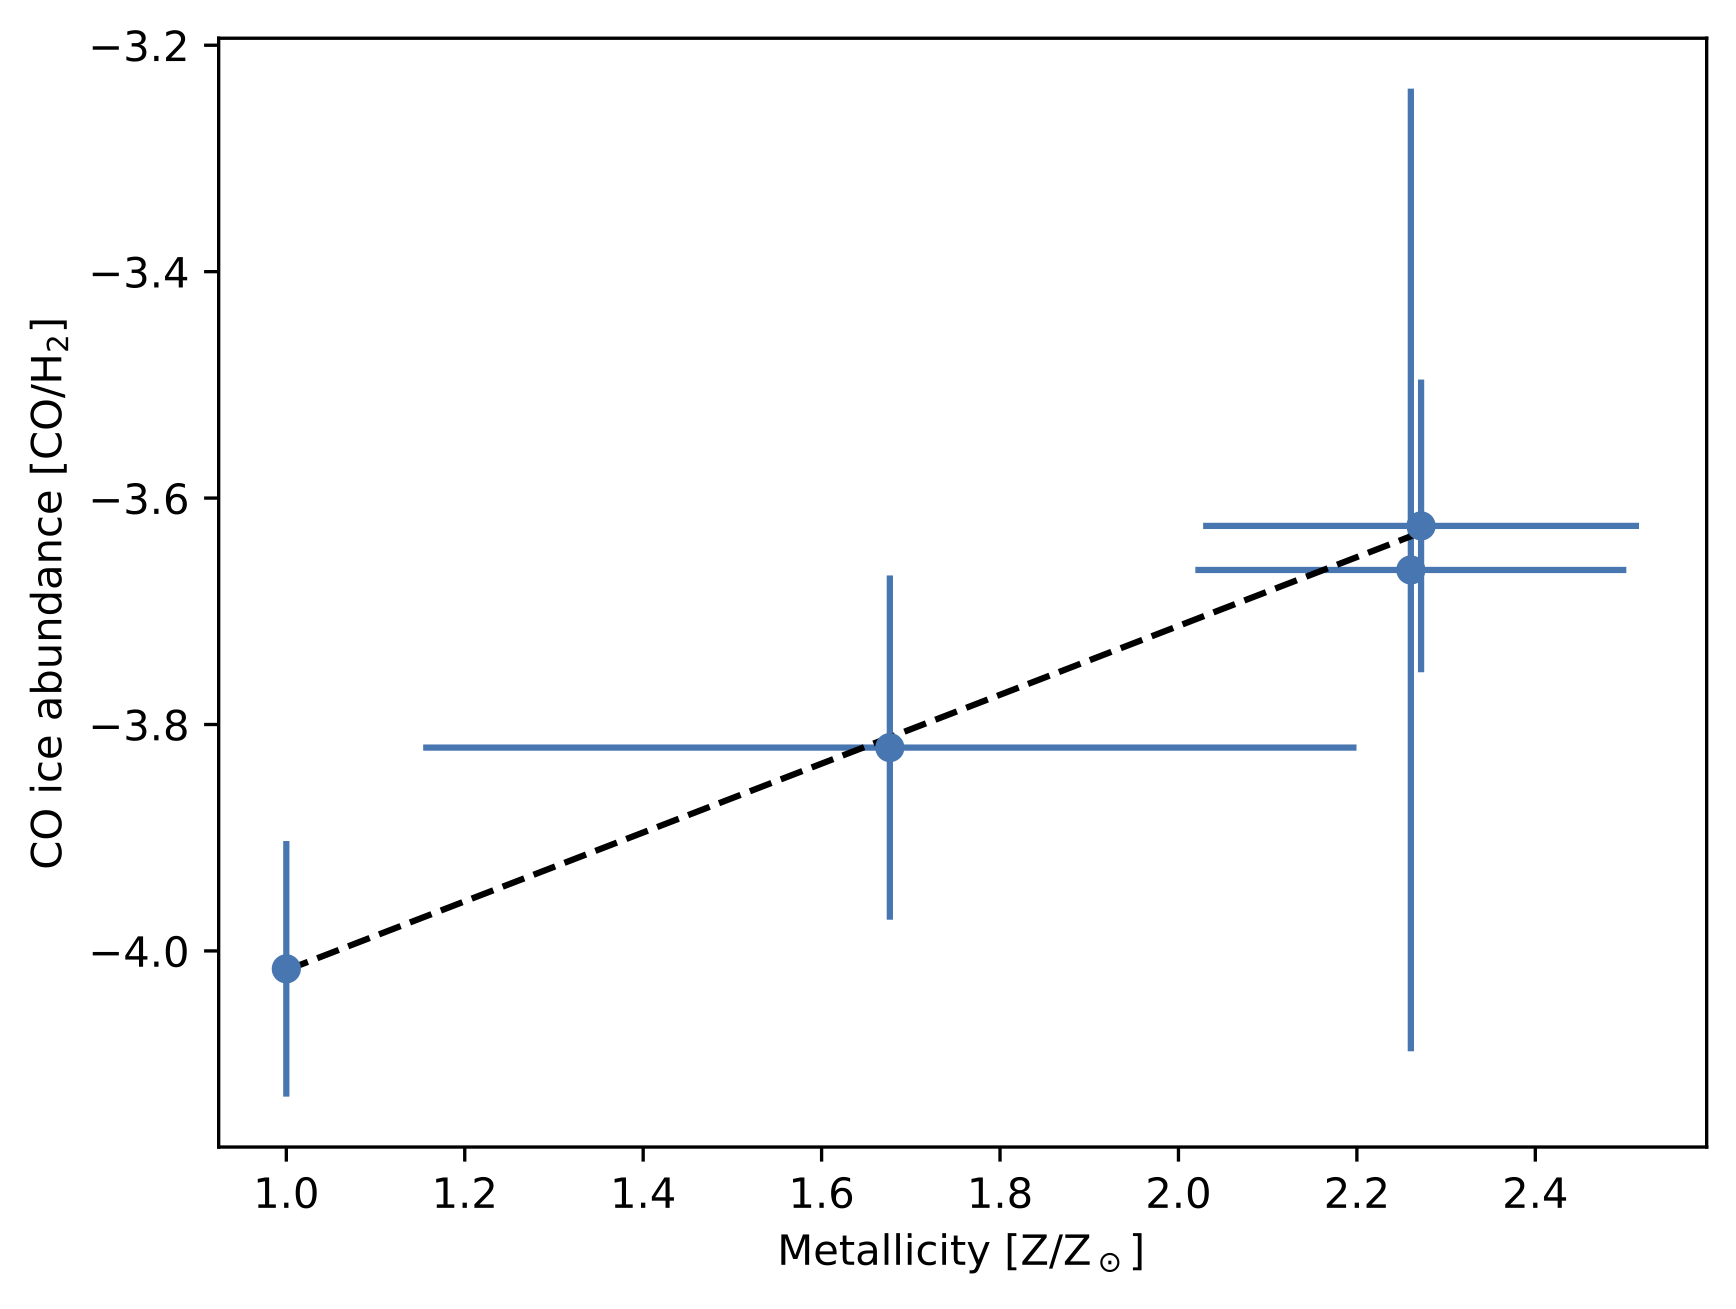
- JWST measures ice abundance across the galaxy
- We can measure metallicity with ice
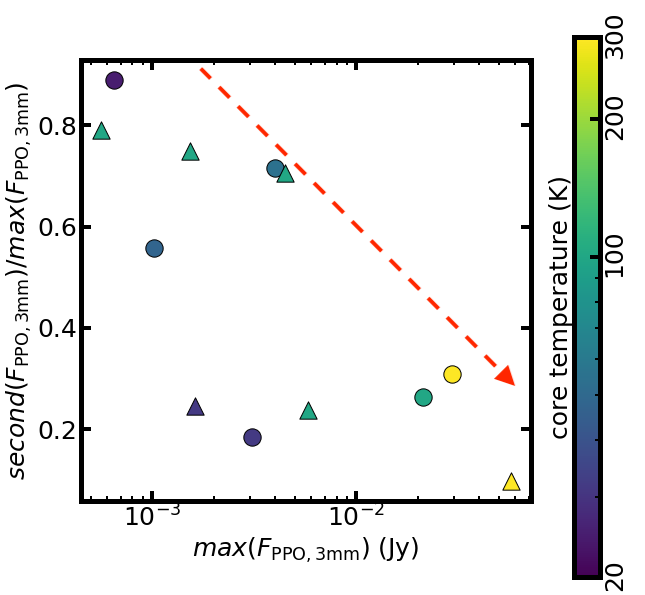
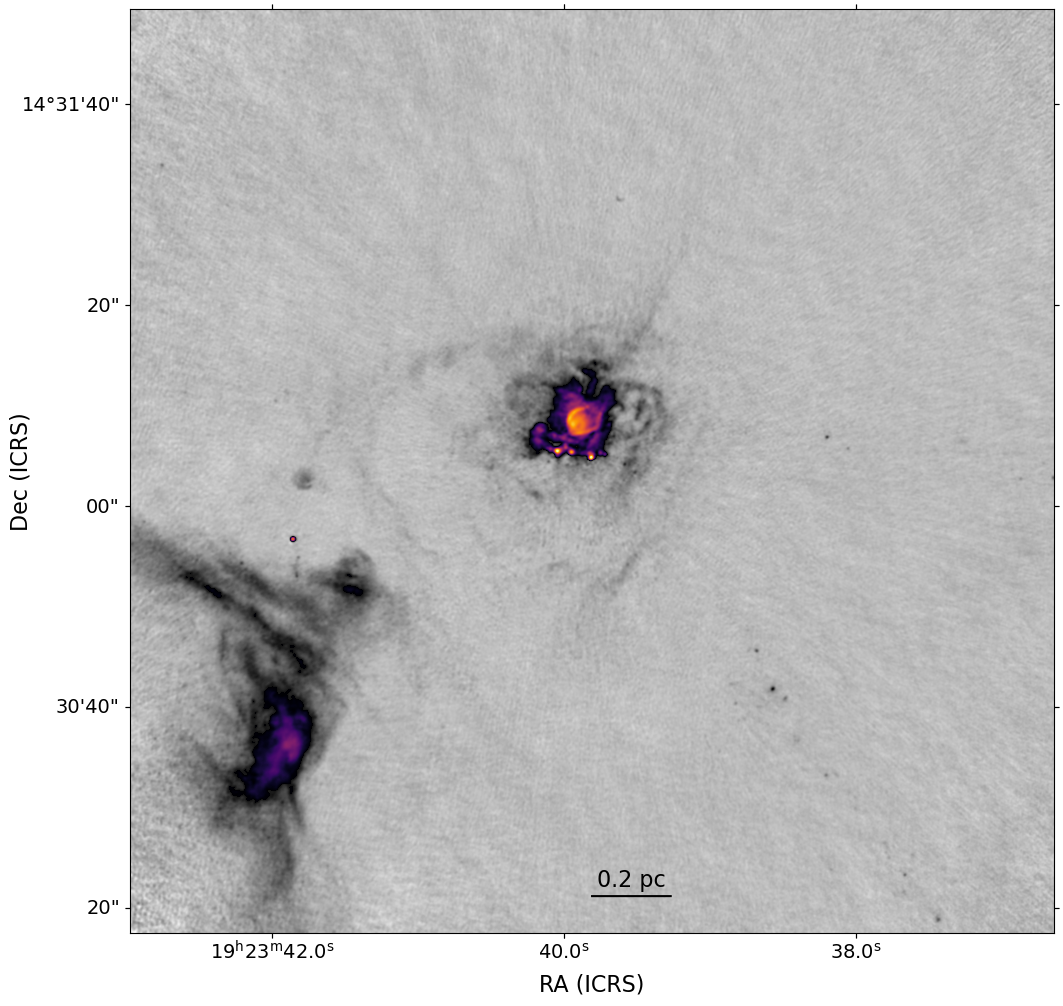
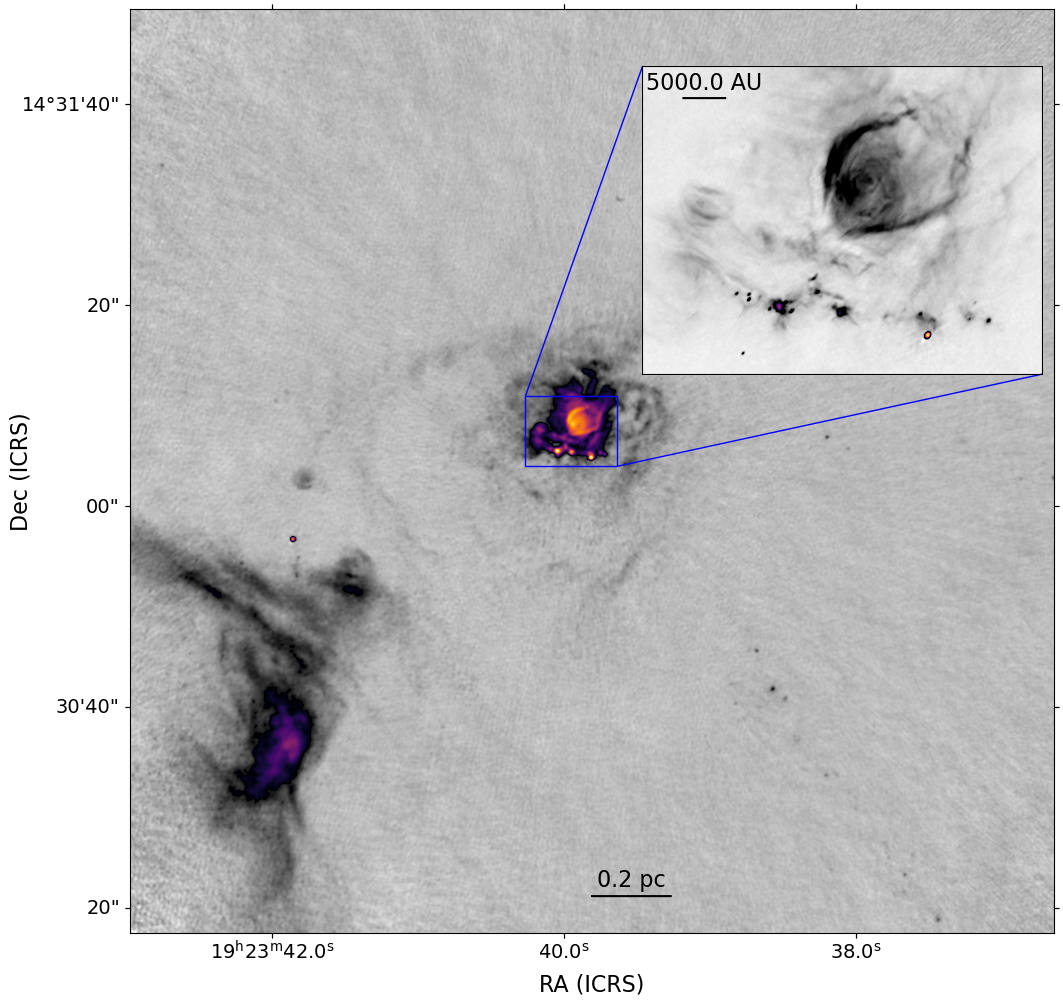
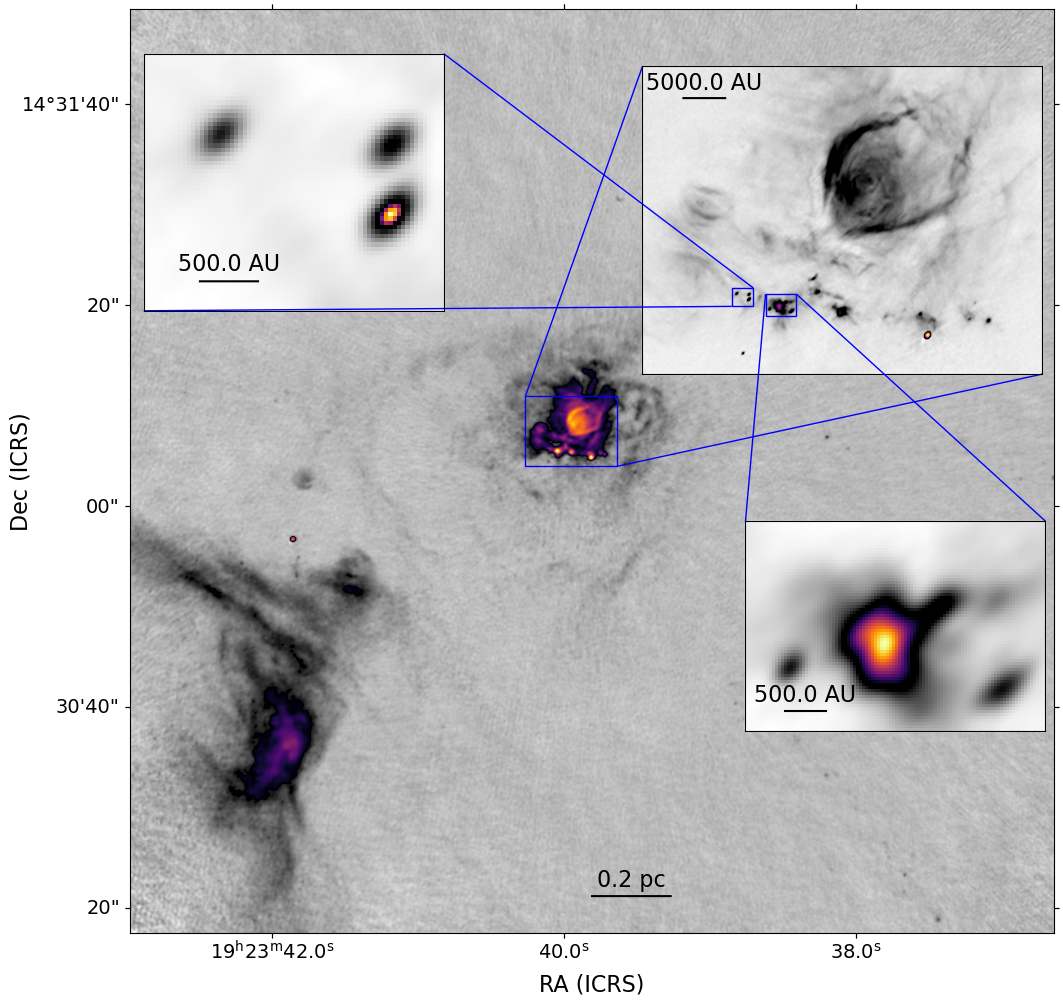
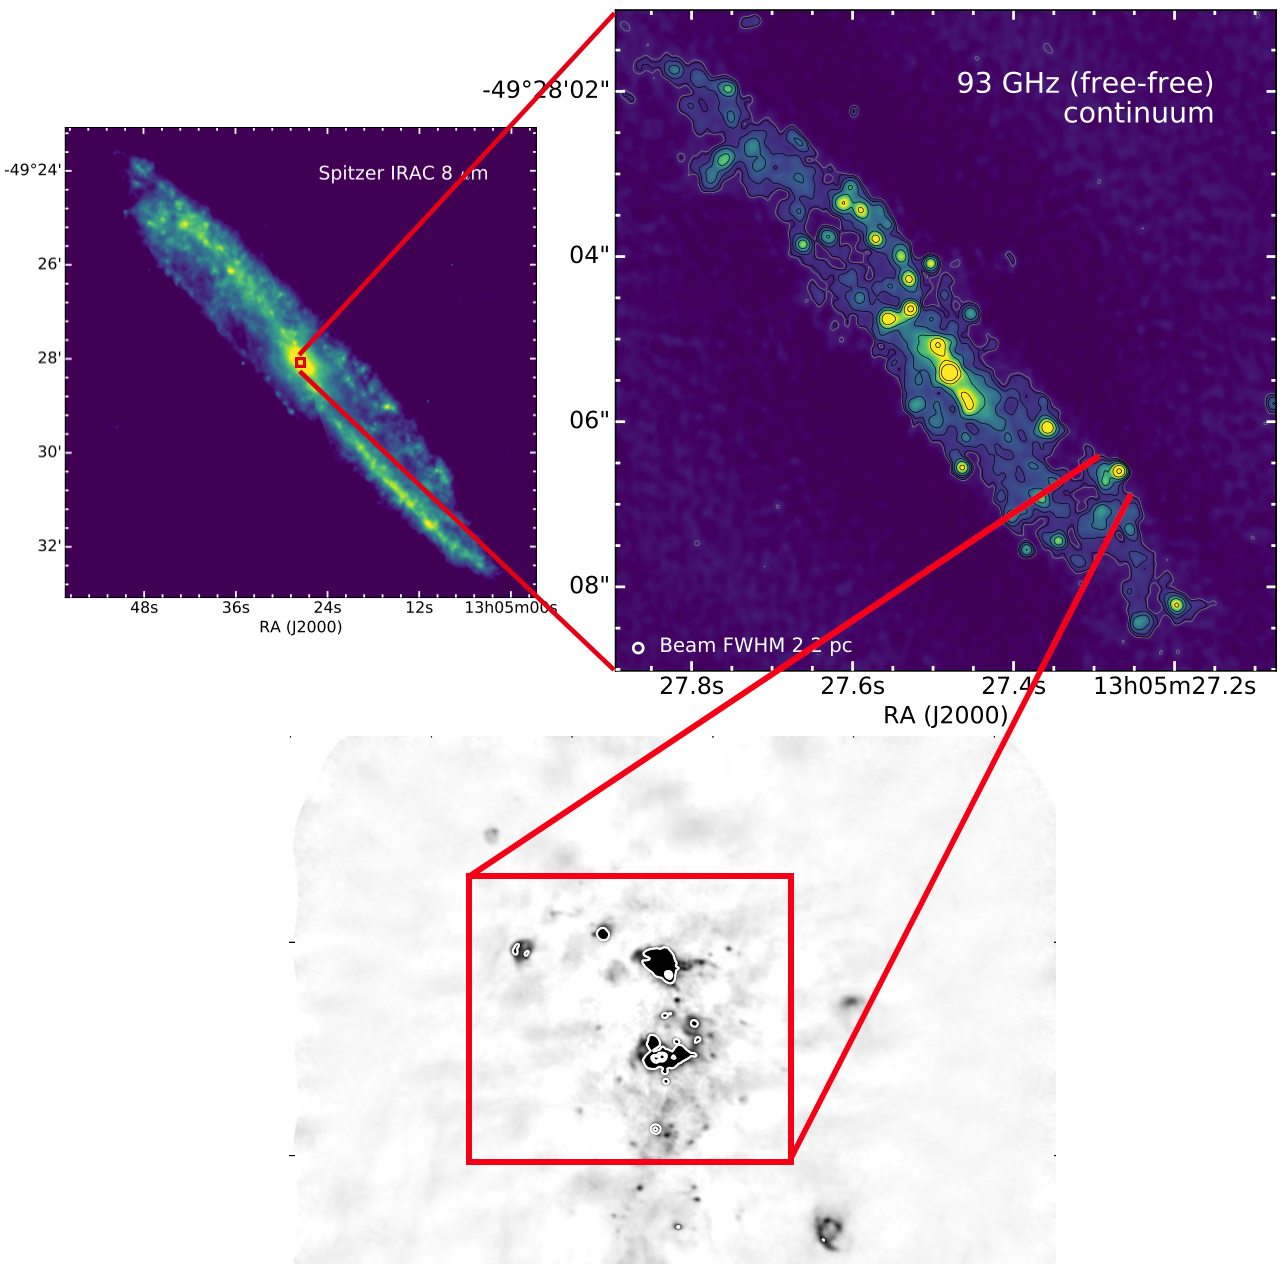
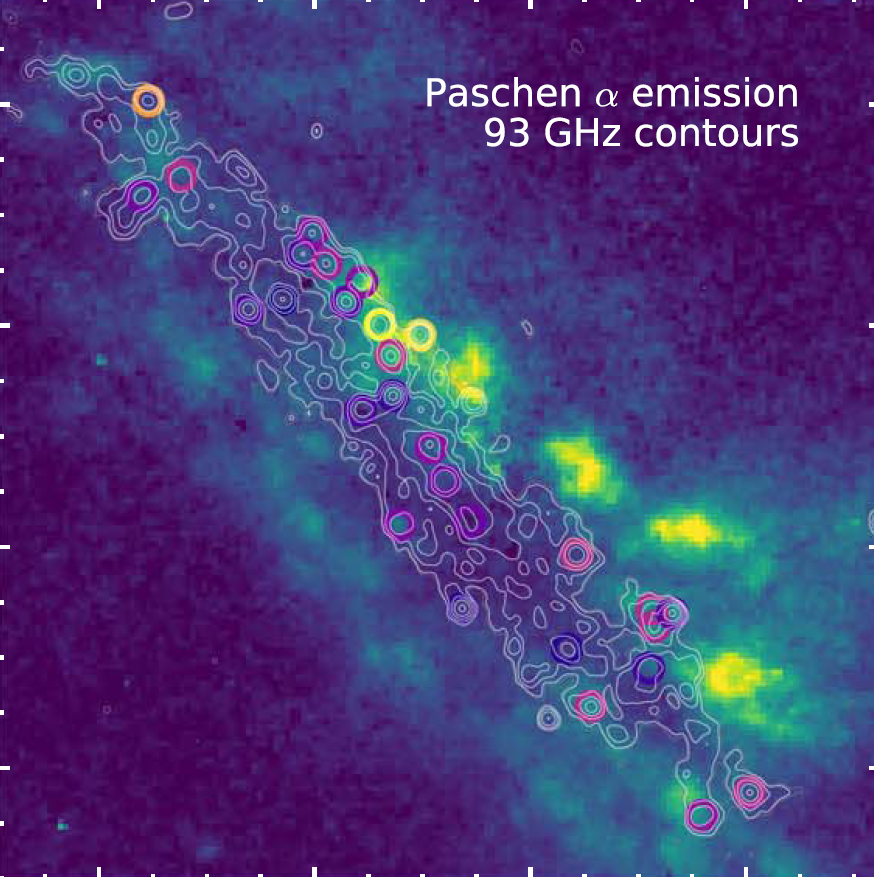
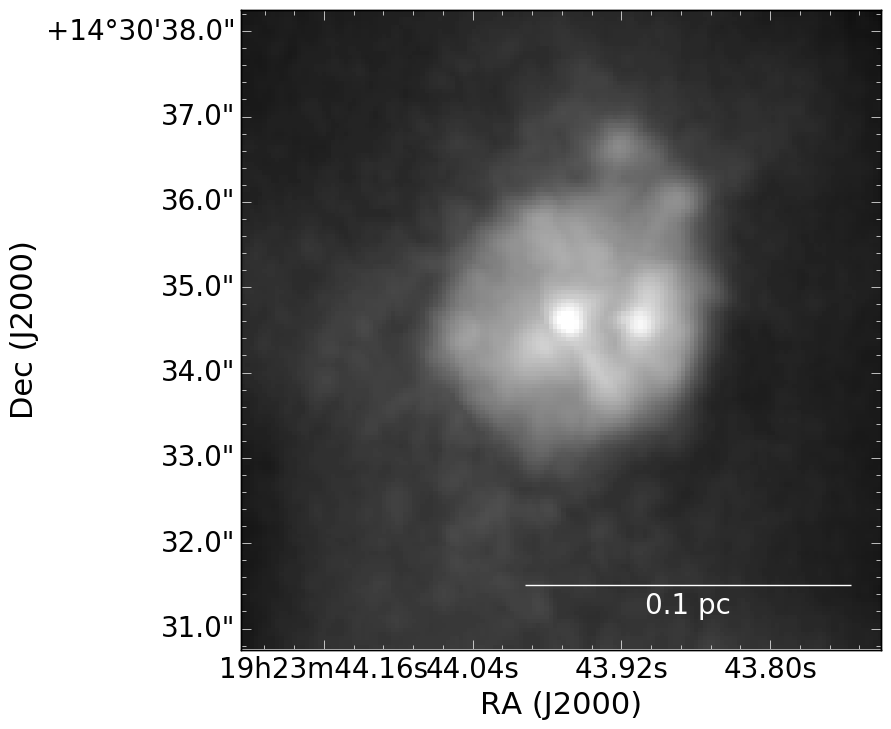
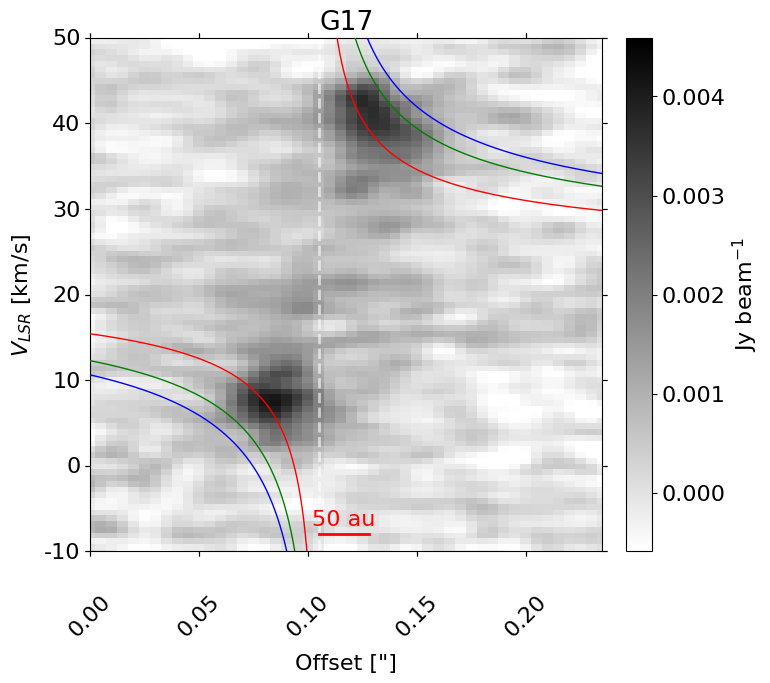
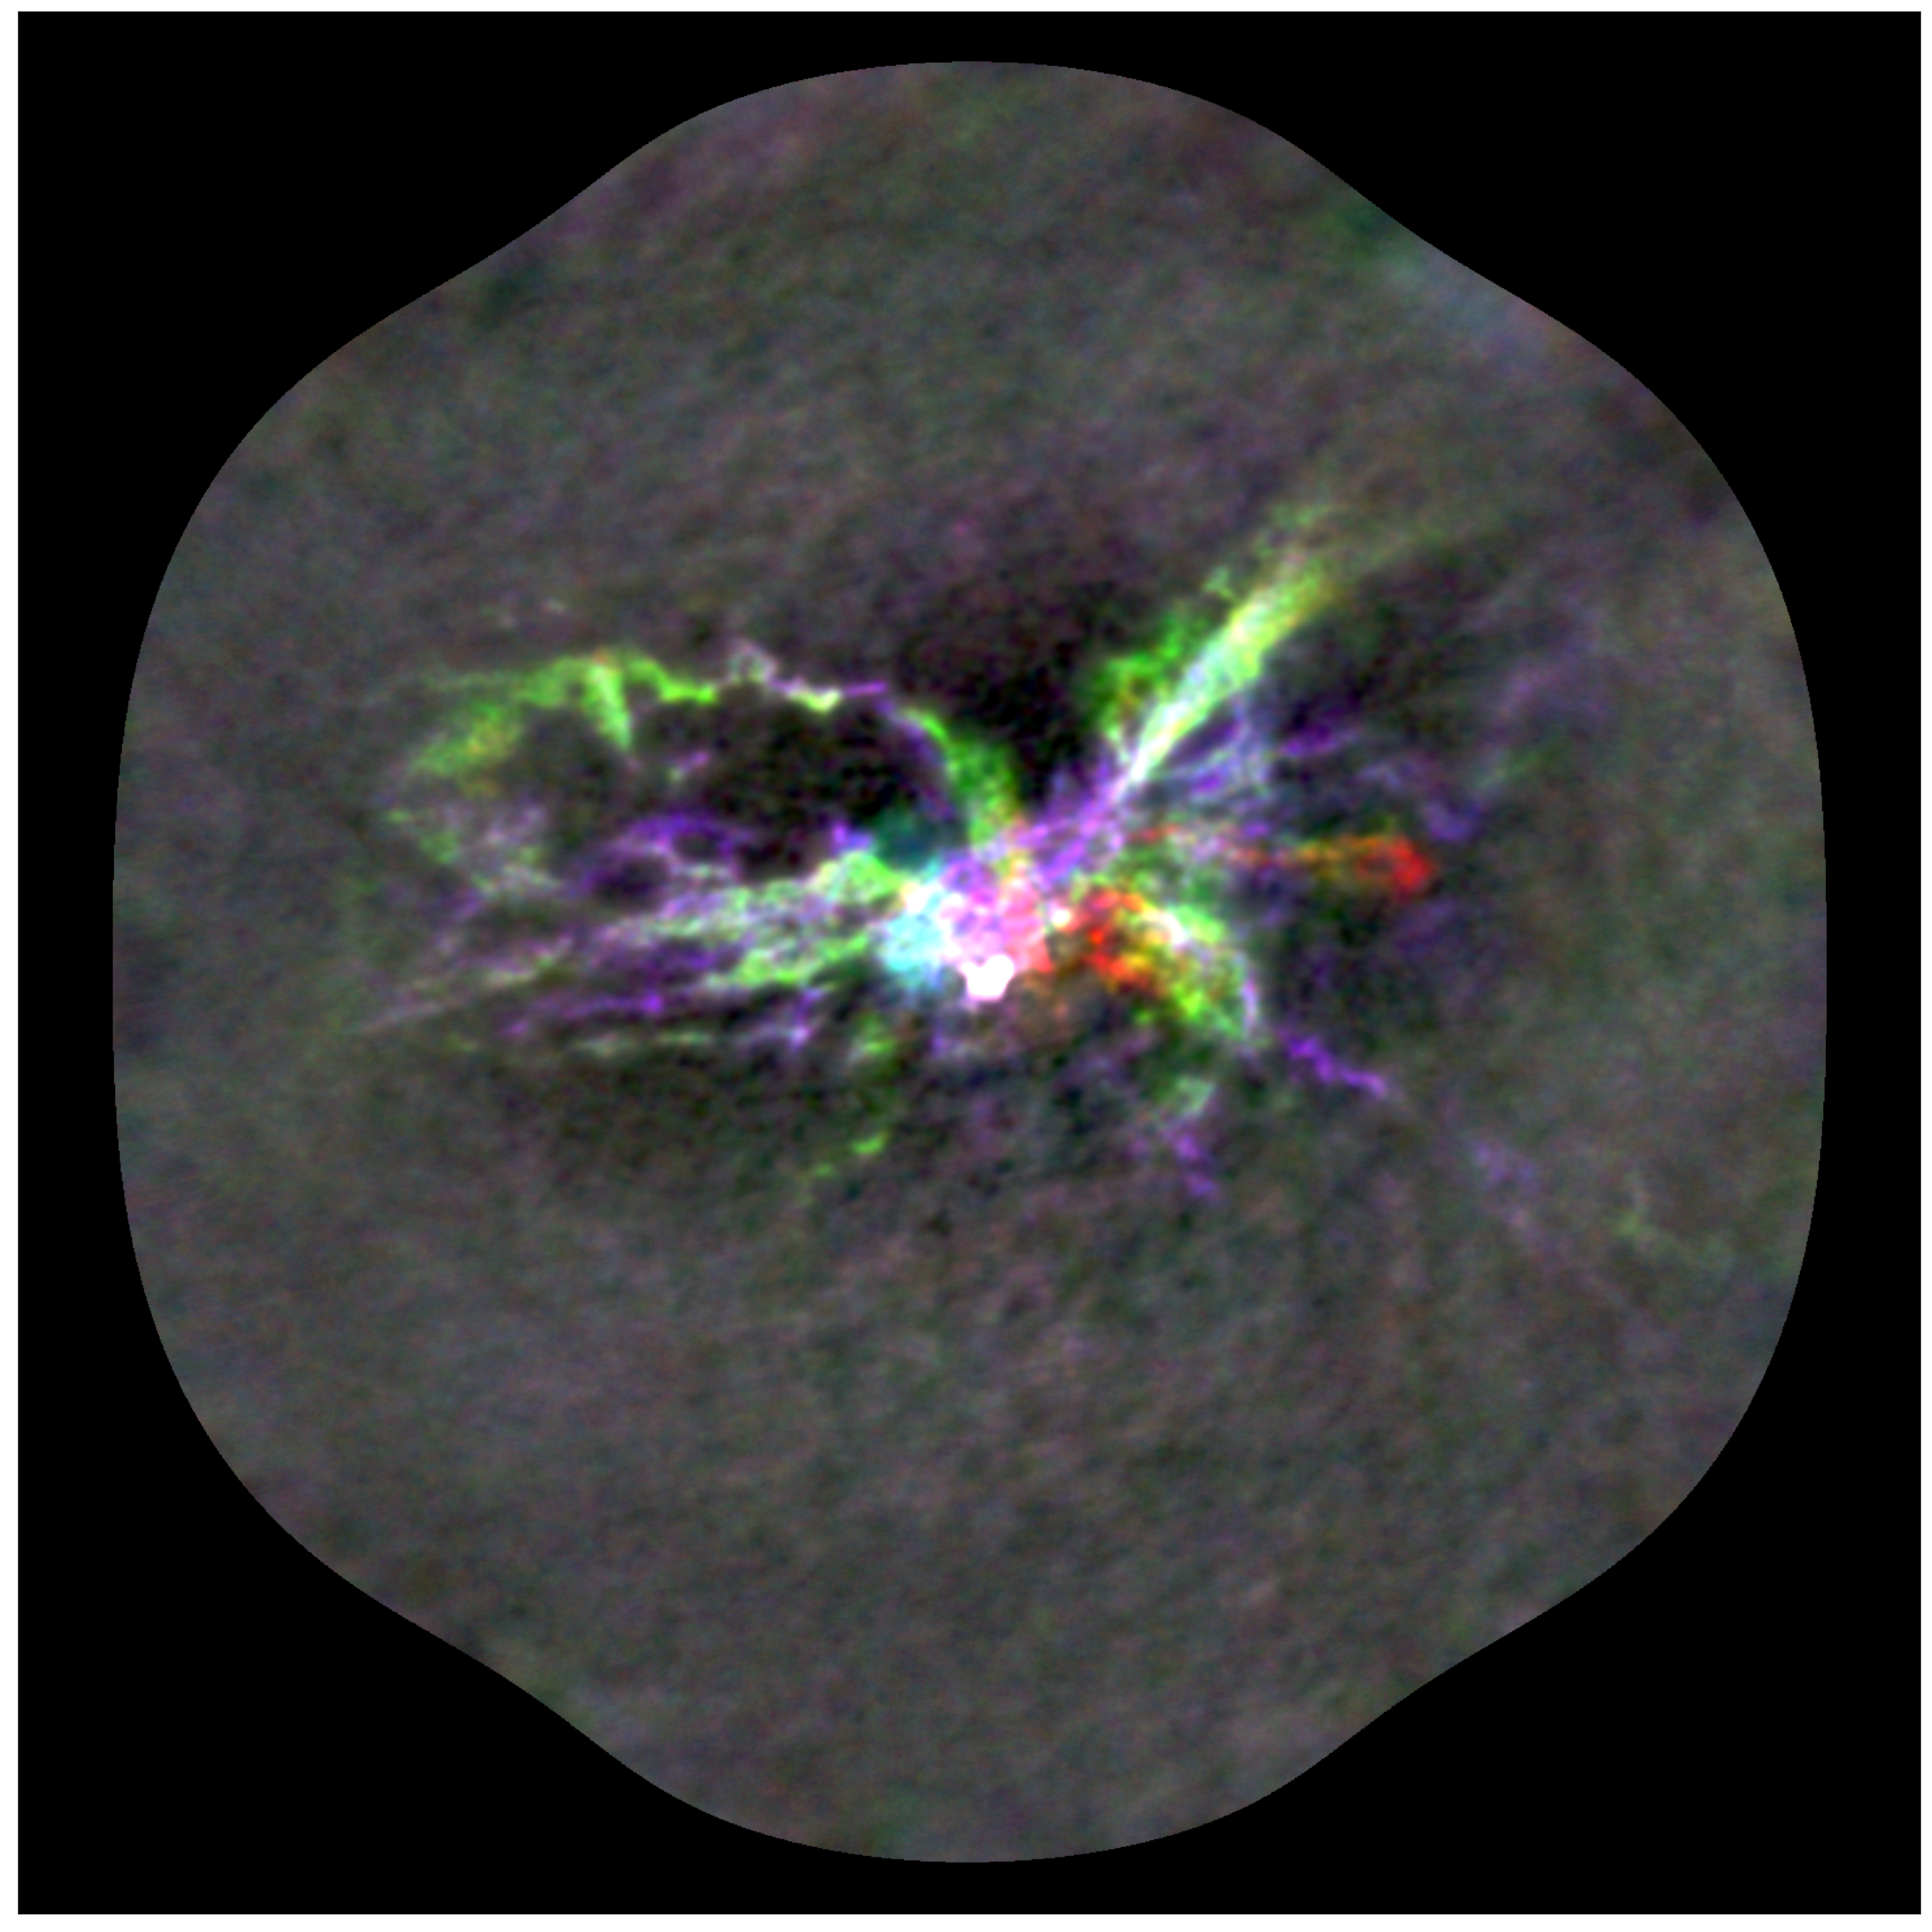
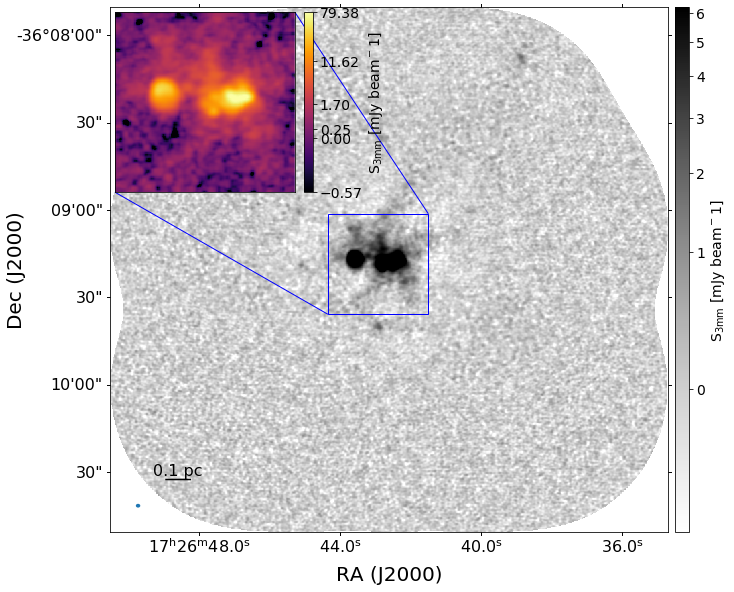
W51 e2e: Massive YSO
CS v=0 J=1-0 and v=0 J=2-1 masers may trace the disk?
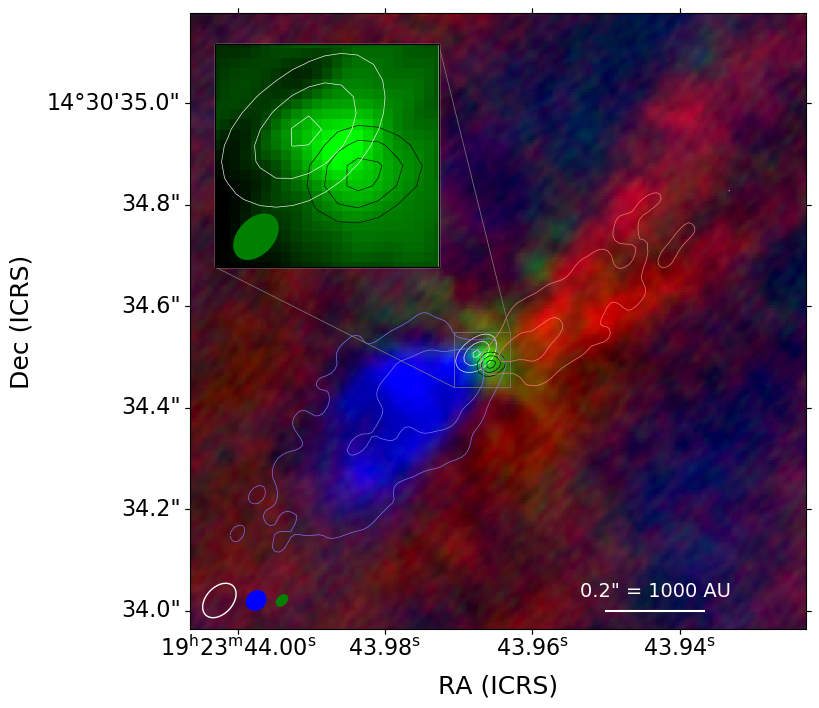
M = 24-10+12M⊙
if the masers trace a disk
if the masers trace a disk
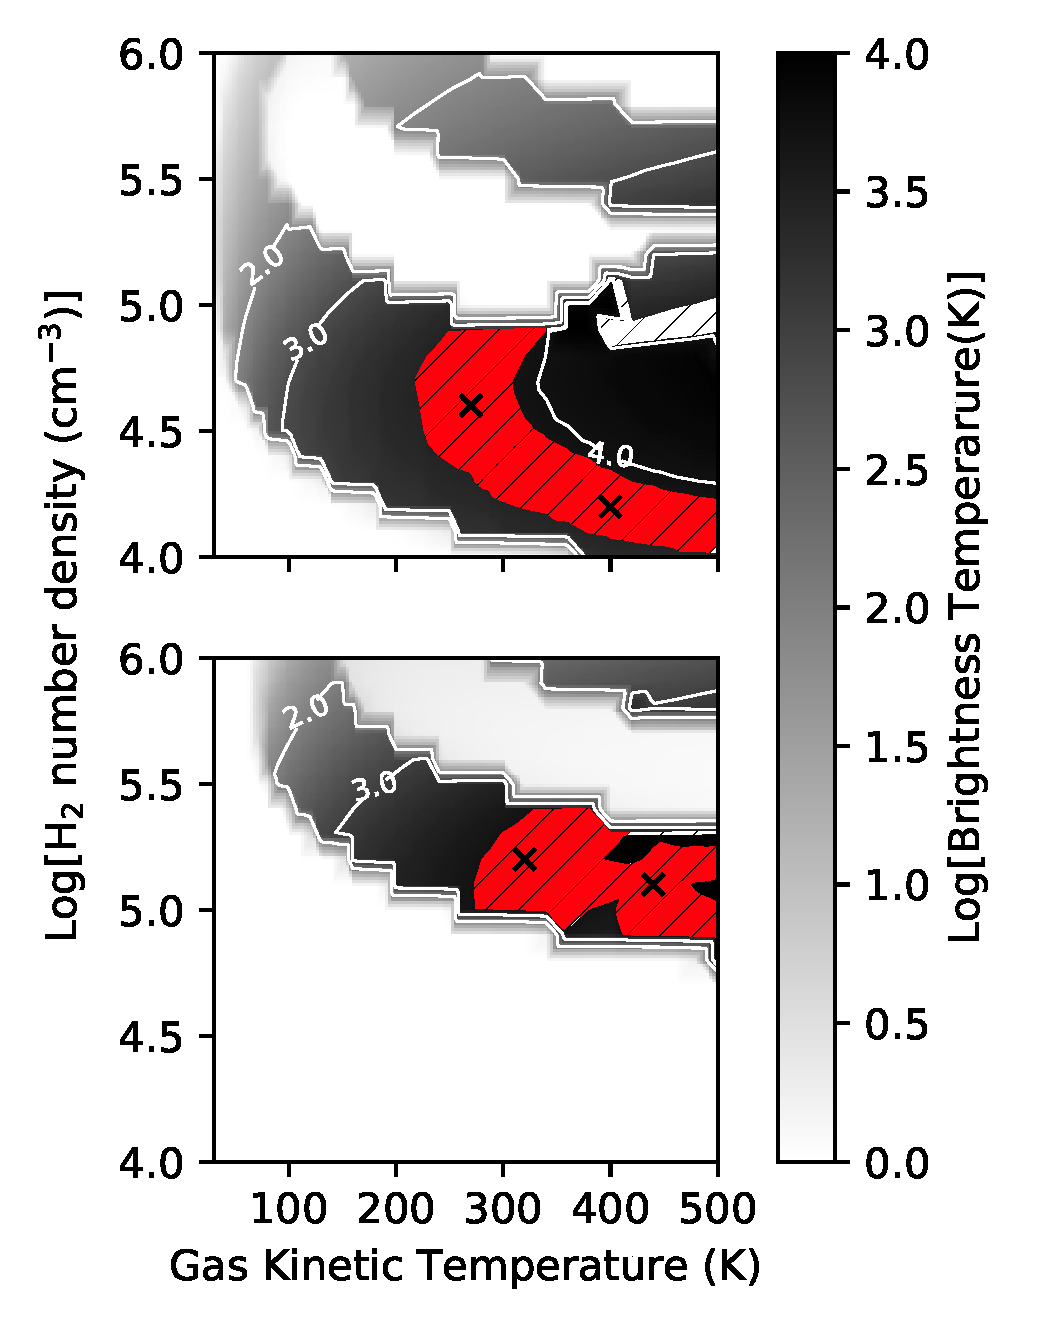
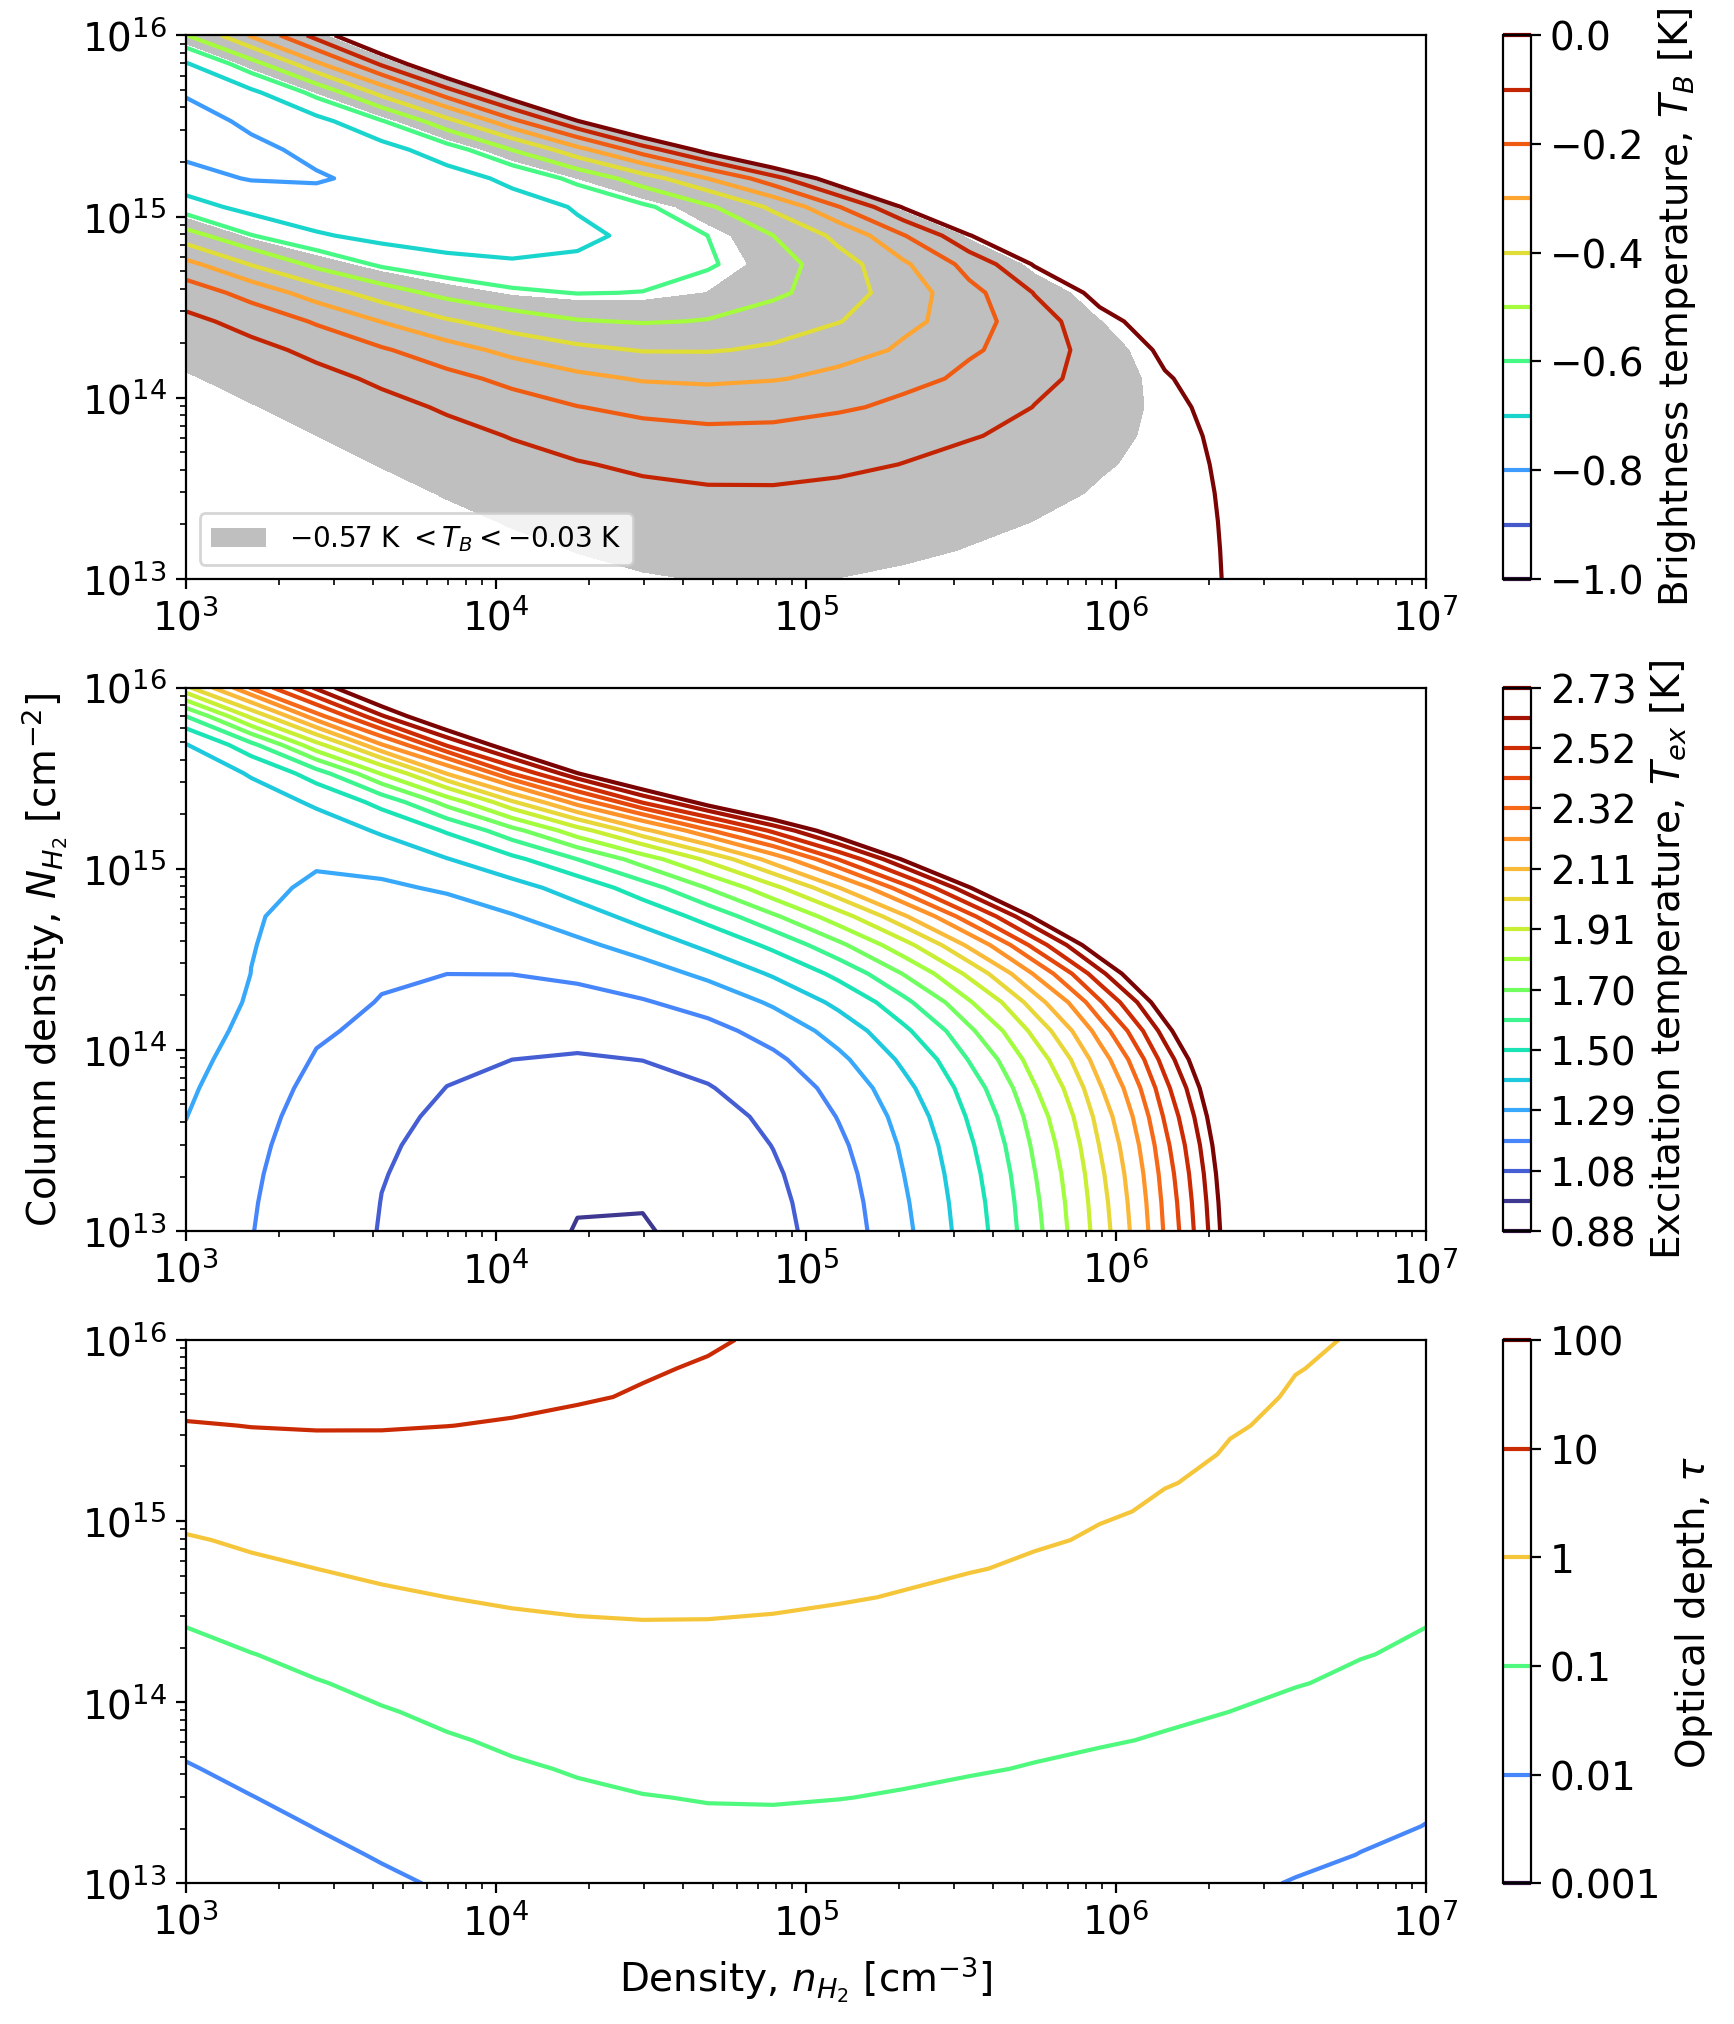
CS maser conditions
van der Walt+ 2020- Top: CS J=1-0, Bottom: CS J=2-1
- Red: Consistent w/W51e2e observations
- Masers do not coexist; require different specific CS column
(N2-1=1015.6, N1-01016.1 cm-2) - Require high abundance (XCS > 10-5)
- Hot (300-500 K), moderate-density (n~105 cm-3): Disk surface? Or outflow cavity wall?
How does the CMF become the IMF?
Some cores fragment, some disappear
Taehwa Yoo+: fragmentation
toward W51
toward W51
What's inside the cores?
What's inside the cores?
What's inside the cores?
Top-heavy IMFs occur in clusters...
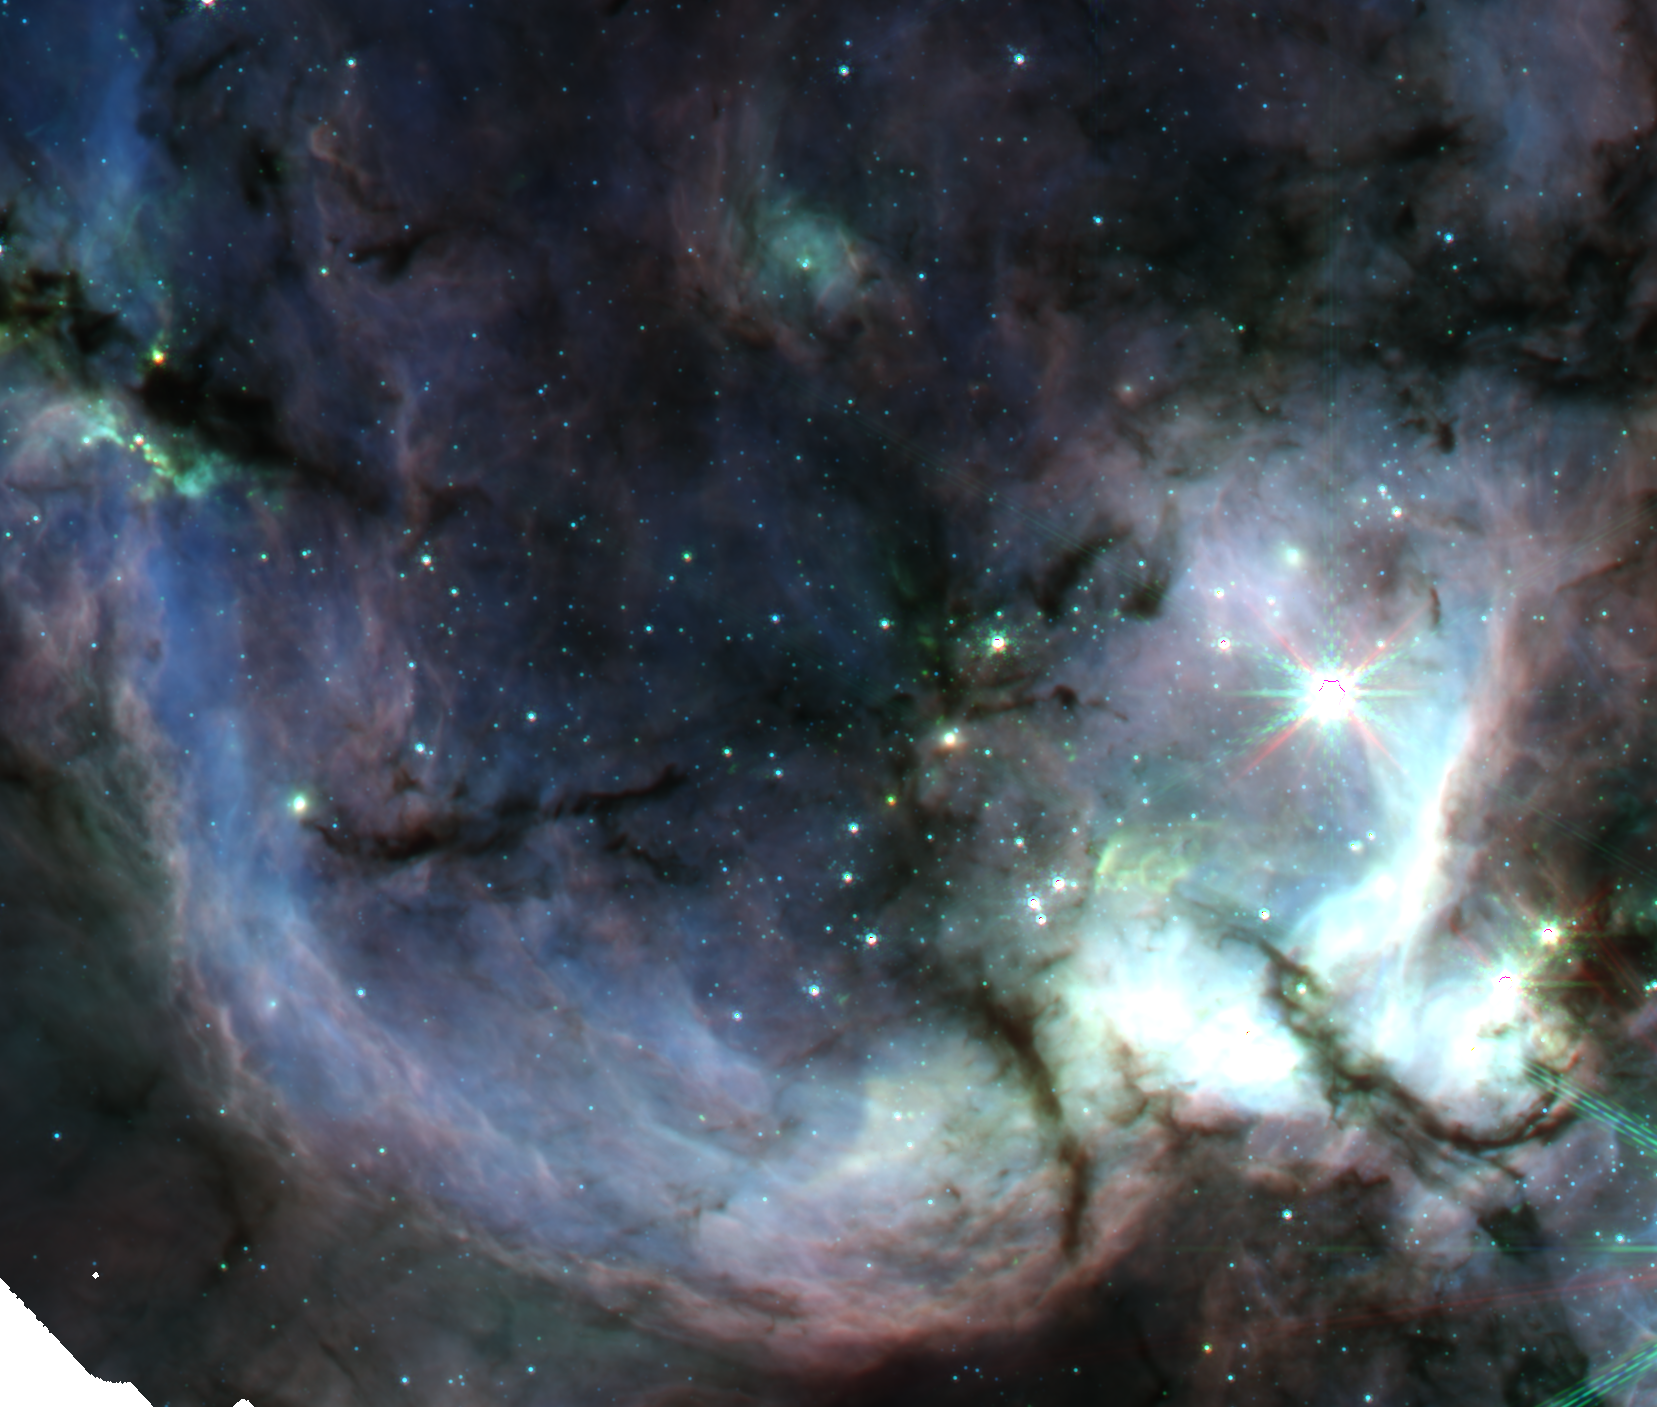
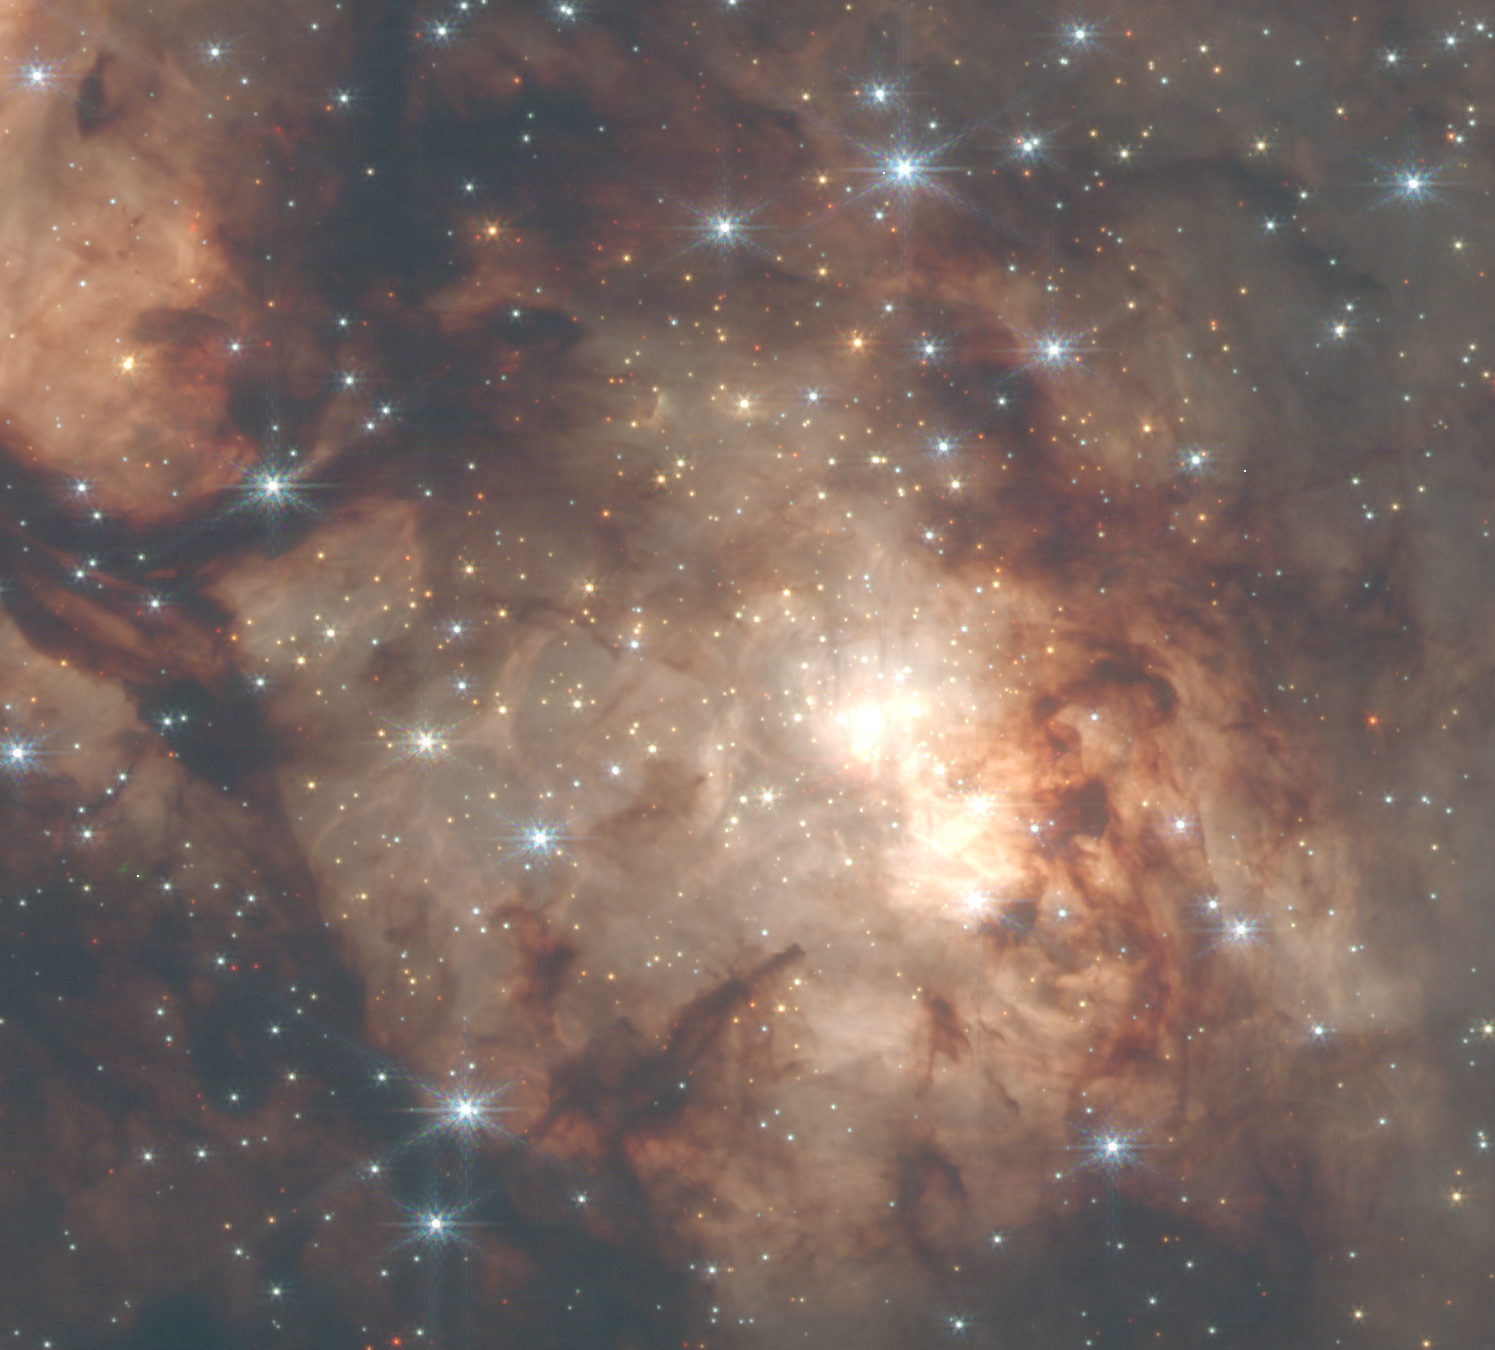
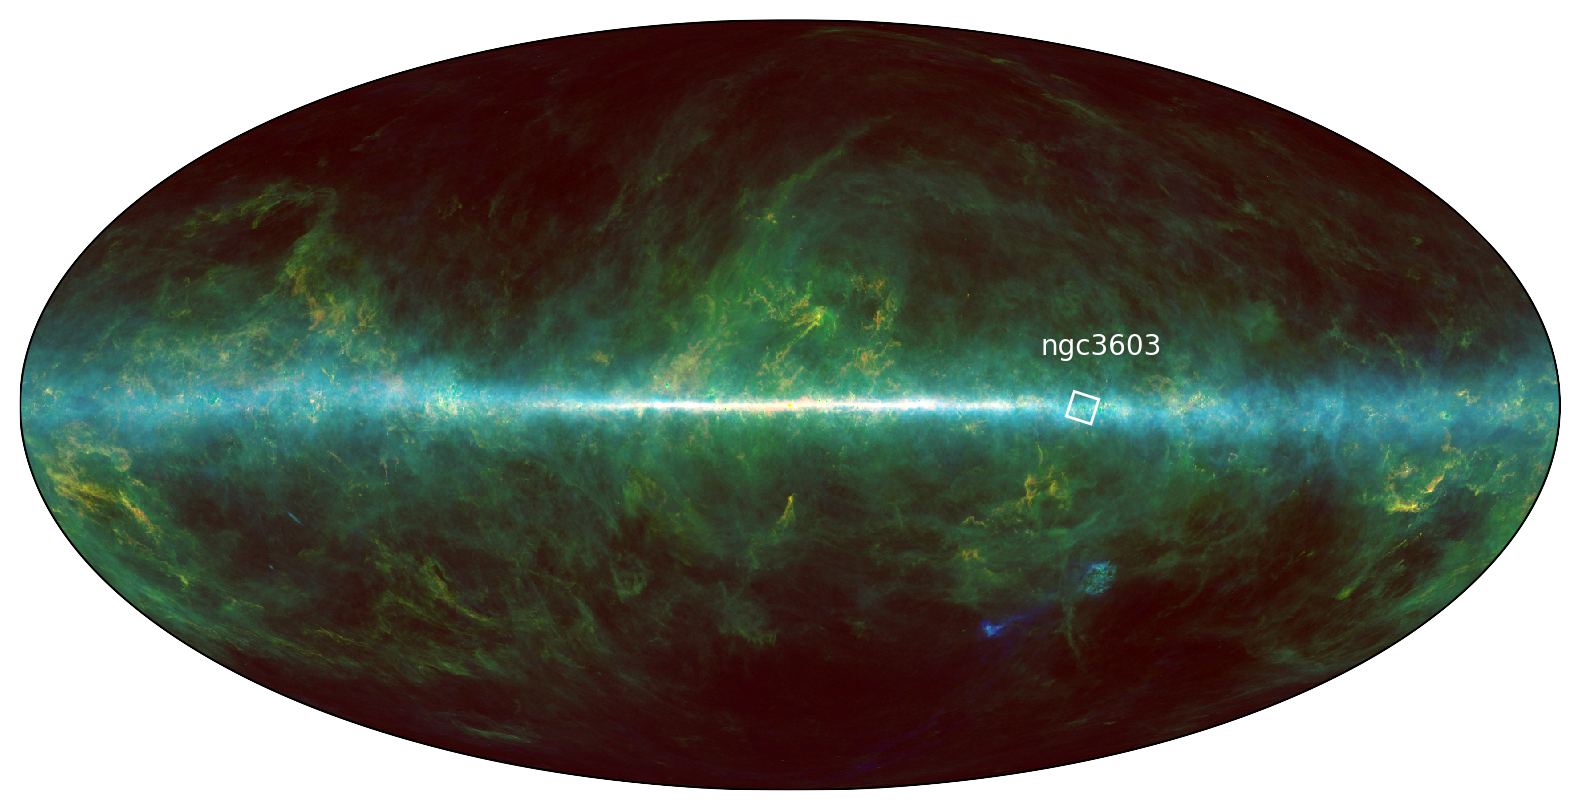
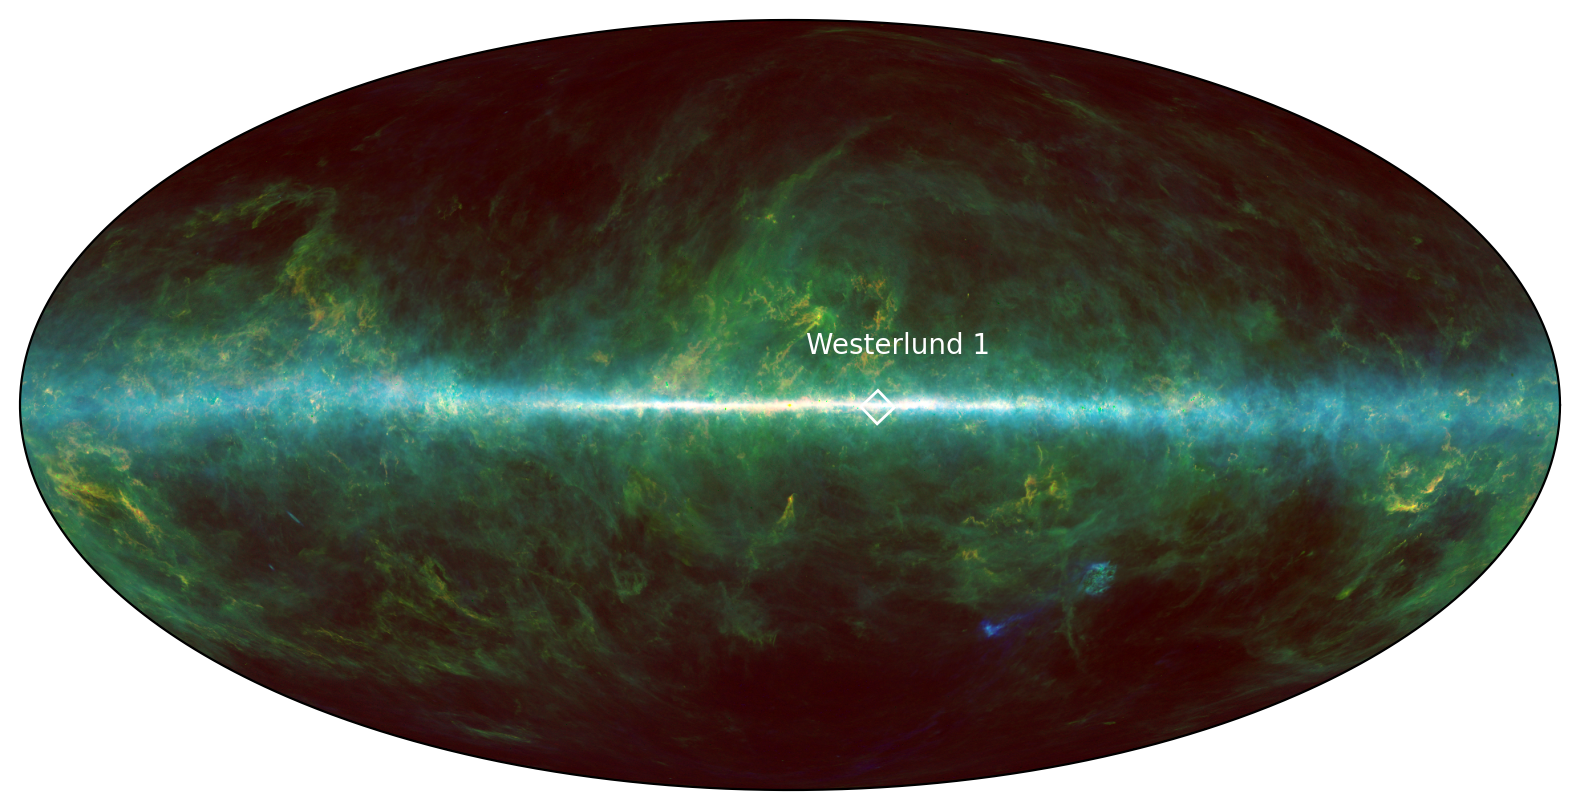
NGC 3603 & Westerlund 1
SSCs are common in starburst nuclei and drive galactic outflows
NGC 253 protoclusters (Leroy+2018)
NGC 4945 protoclusters (Emig+2020)

Star formation drives the evolution of the universe
Most stars in most galaxies formed long ago
Galaxies were smaller & denser back then
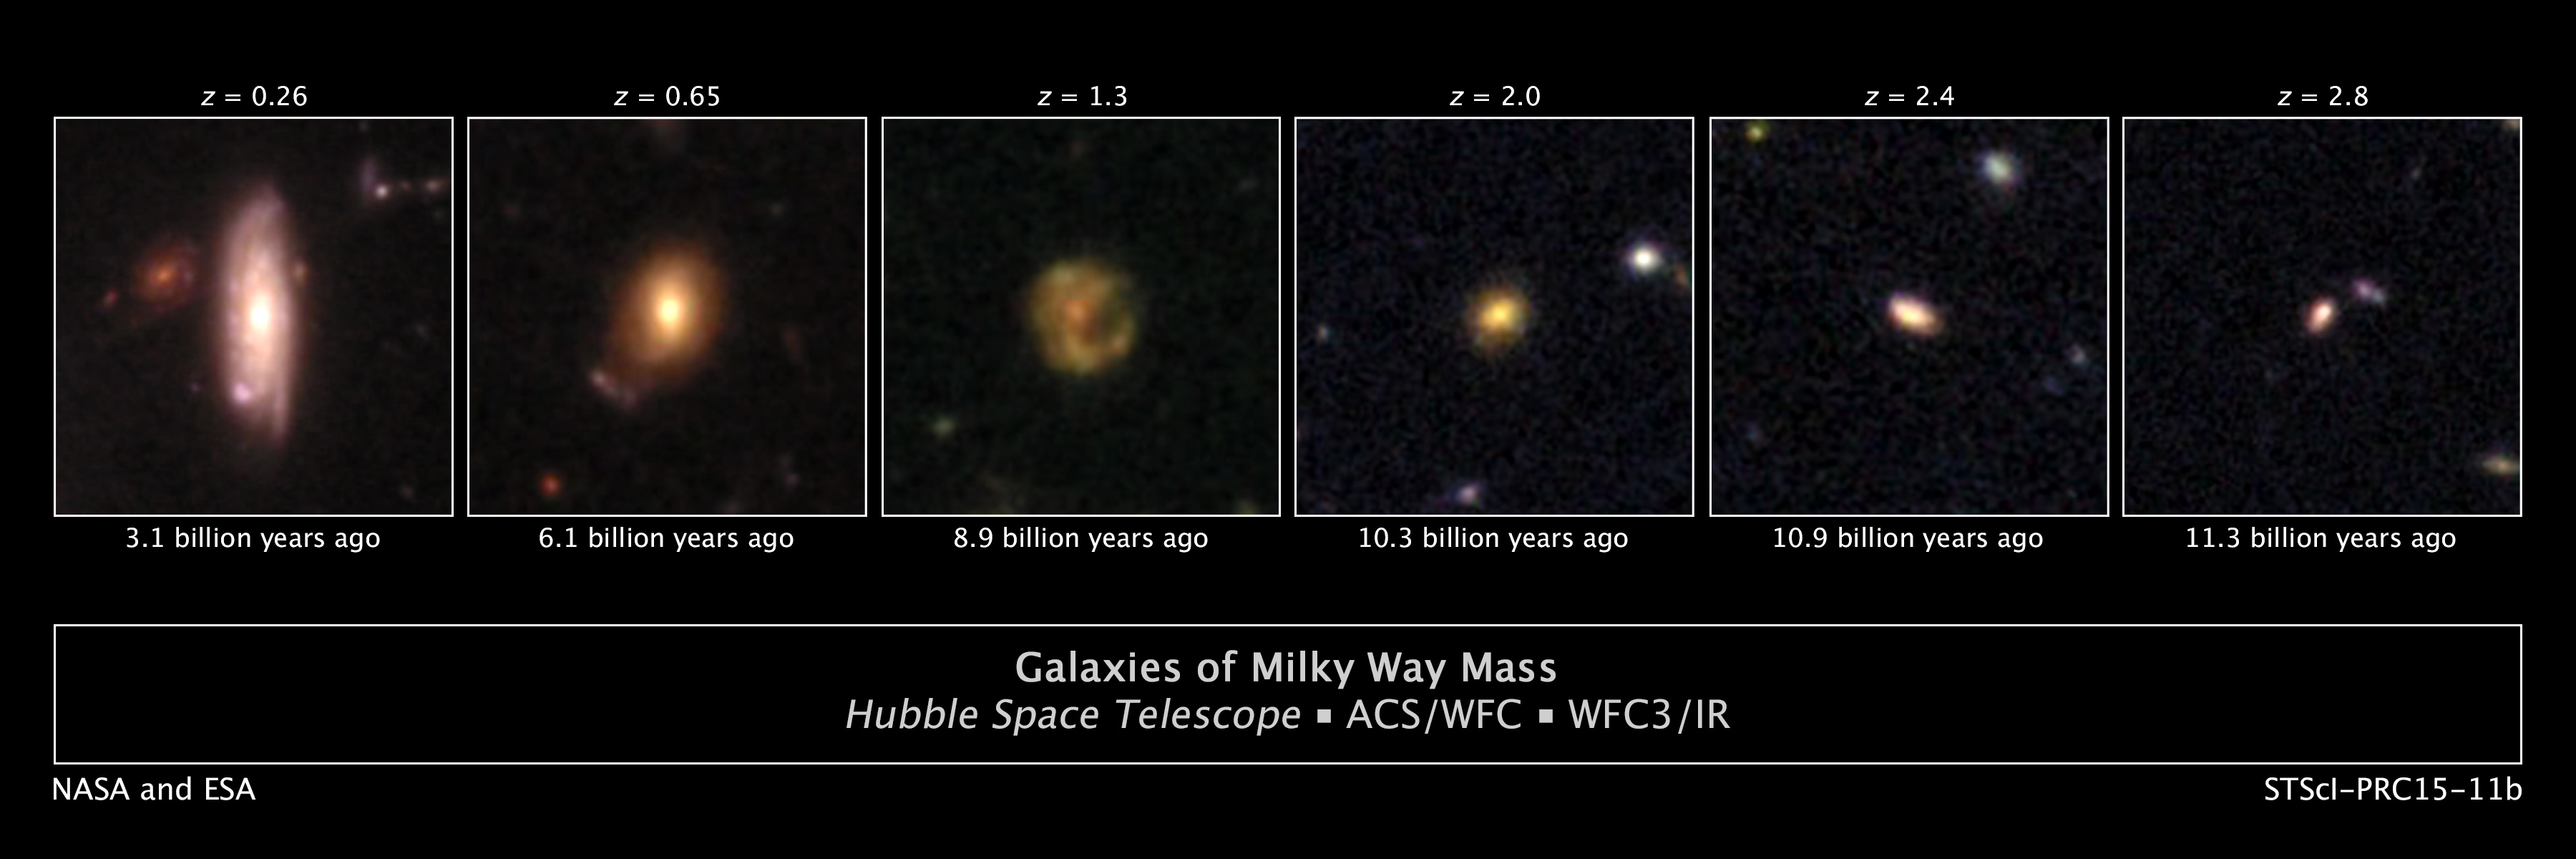 STSCI; Pappovich, Ferguson, Faber, Labbe
ALMA-IMF:
The CMF is shallow (top-heavy) in HMSFRs
ALMA-IMF:
The CMF is shallow, and steepens with time?
Louvet+, subm
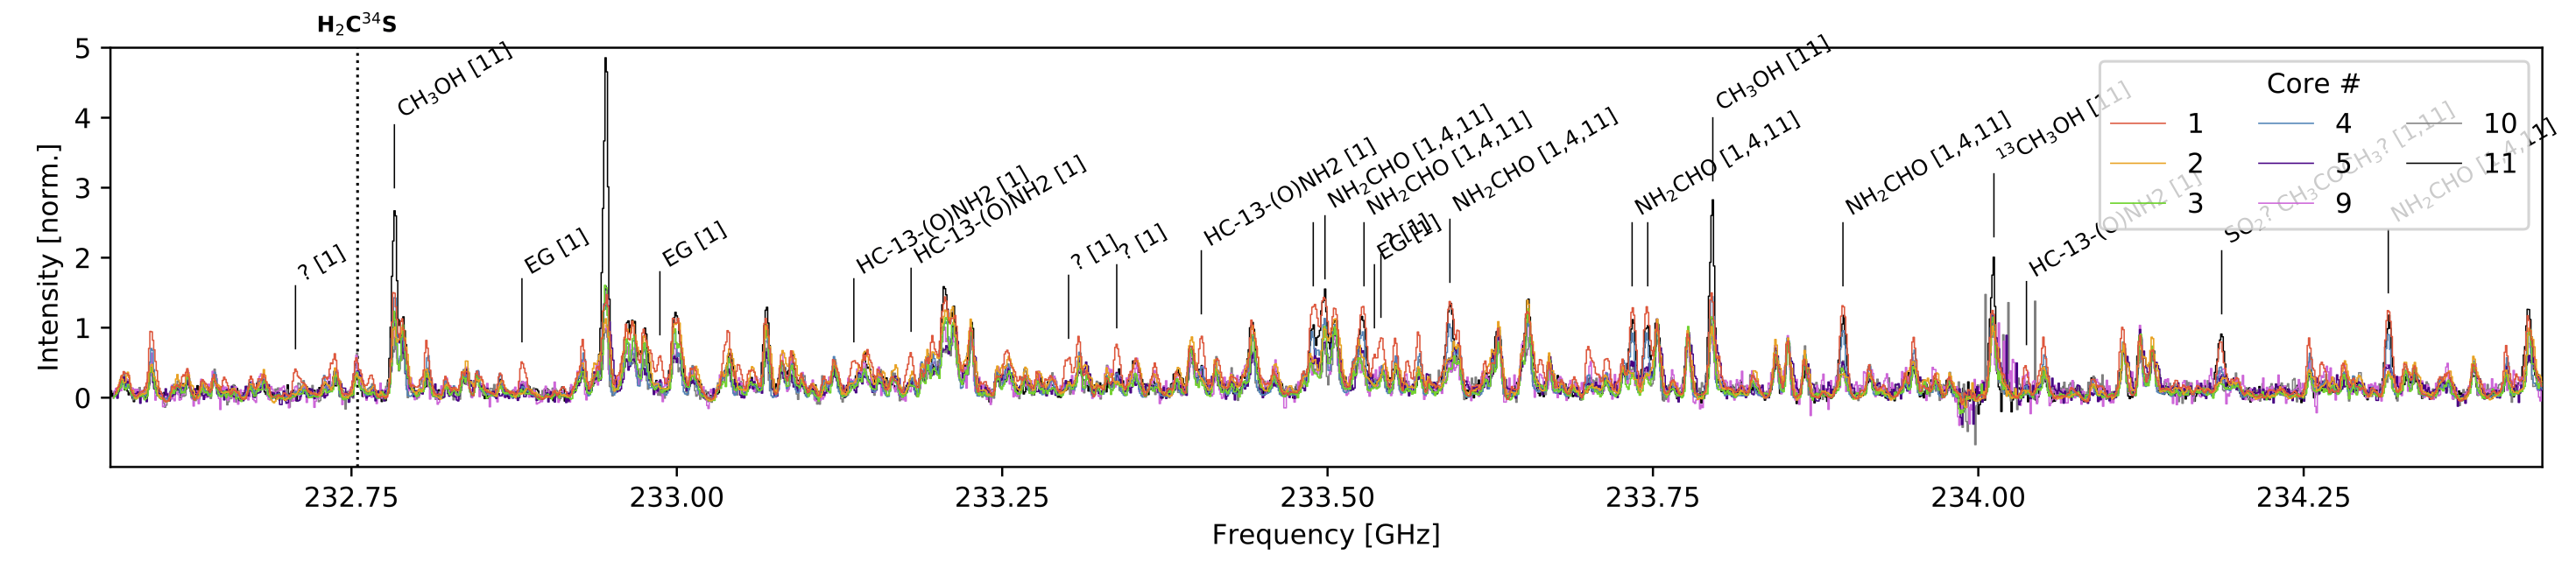
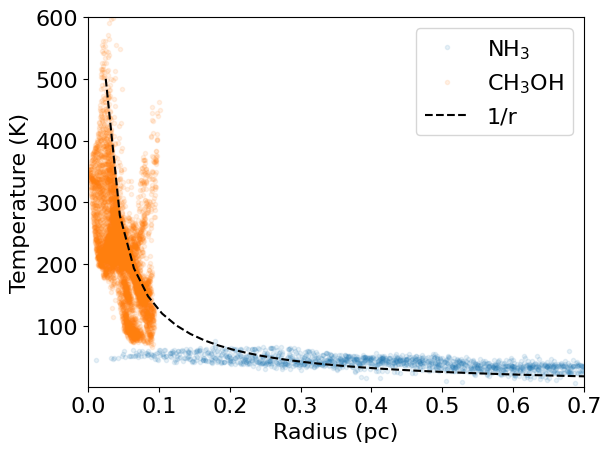
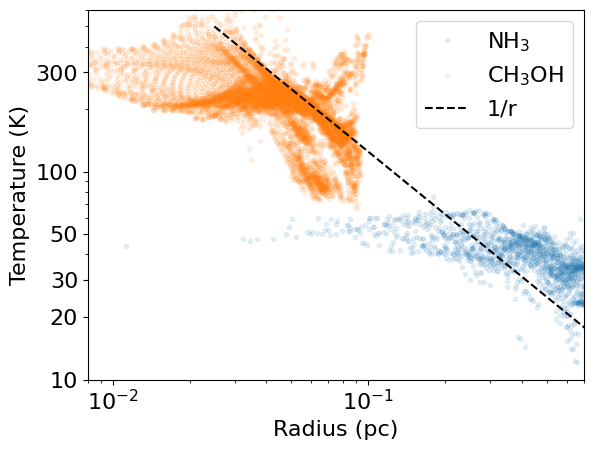
ALMA-IMF Line Data: CH3CN, CH3CCH
Temperature measurements with per-pixel rotation diagrams
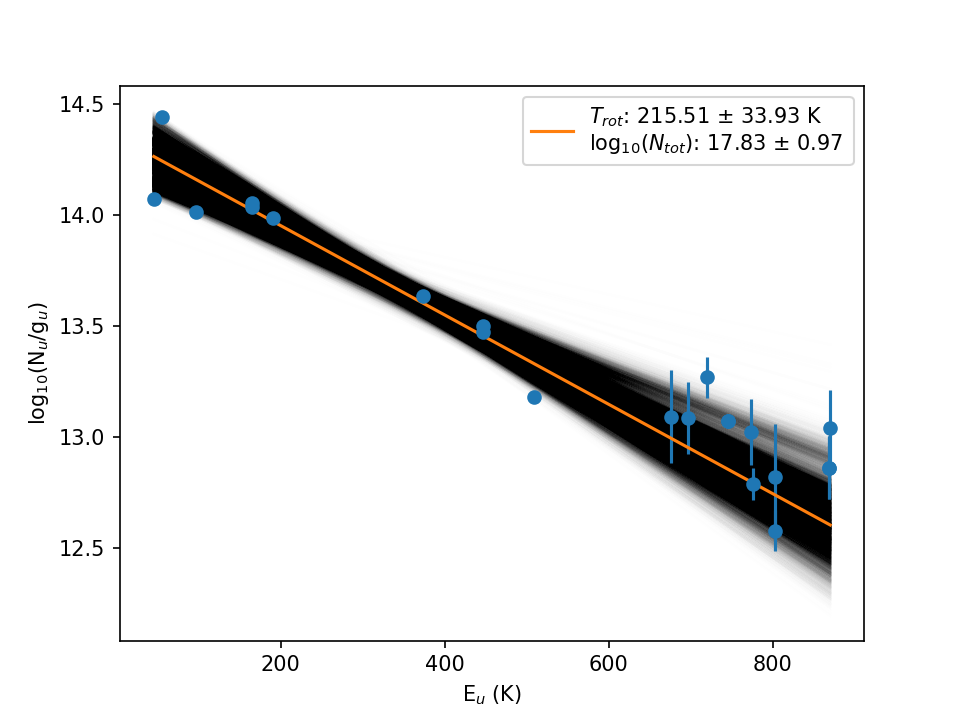
Jeff+ 2024 (CH3OH in CMZ), Wyrowski+ in prep (CH3CN in ALMA-IMF)
Hot cores in ALMA-IMF: From rare objects to a population
Cores with line forests
TD>50 K
TG ≳100K
TD>50 K
TG ≳100K
Hot core overview:
- 9 HCs in W43-MM1 (Brouillet+ 2022)
- ~60-70 HCs in ALMA-IMF sample from CH3OCHO (Bonfand+ 2024; left)
- ~10% of continuum cores are within hot cores
- CH3CN temperature maps (Wyrowski+ in prep)
ALMA-IMF Key Results summary
- Rich, science-ready data (Ginsburg+ 2022, Cunningham+ 2023)
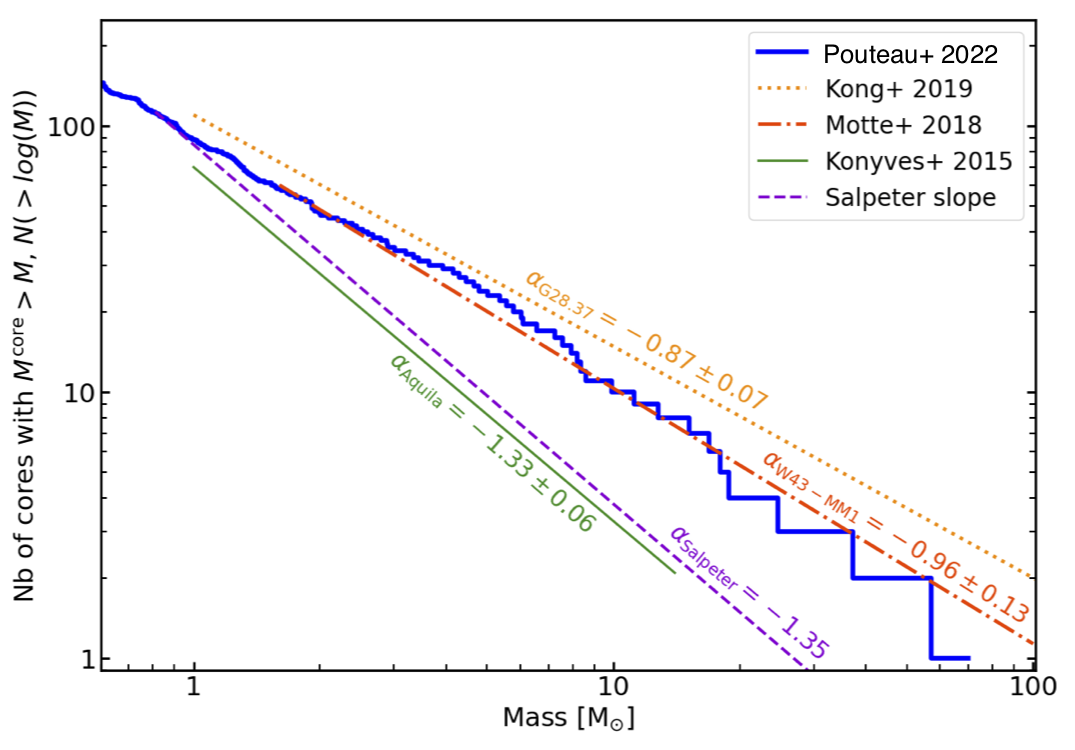
- CMF is top-heavy in HMSFRs (Pouteau+ 2022, Louvet+ 2024)
- Core fragmentation is not 1-to-1 [WIP] (Budaiev+ (CMZ), Yoo+ (W51), Louvet+ (W43), ...)
- 10% of $M\gtrsim1\mathrm{~M}_\odot$ cores are hot cores (Brouillet+ 2022, Bonfand+ 2024, Wyrowski+)
- Outflow feedback builds over time, sets initial conditions for many cores (Nony+ 2022, Towner+ 2023)


More Brinary disks
Ginsburg+ 2023: New sample. Miriam Garcia Santa-Maria is following up
Briny chemistry:
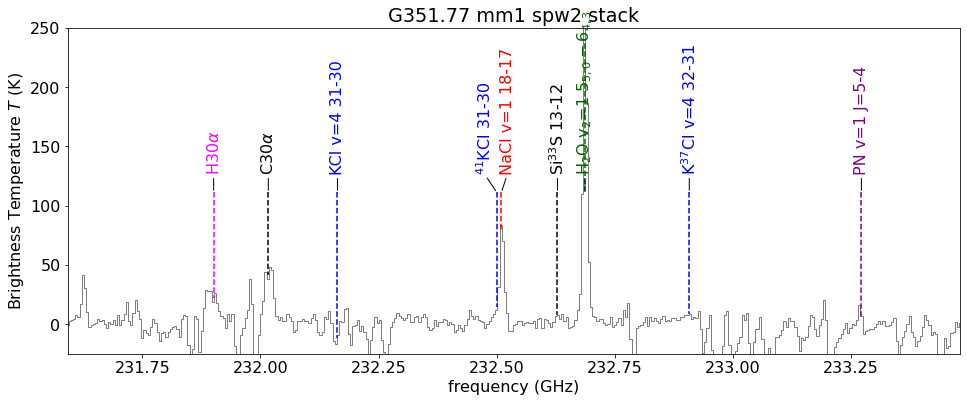
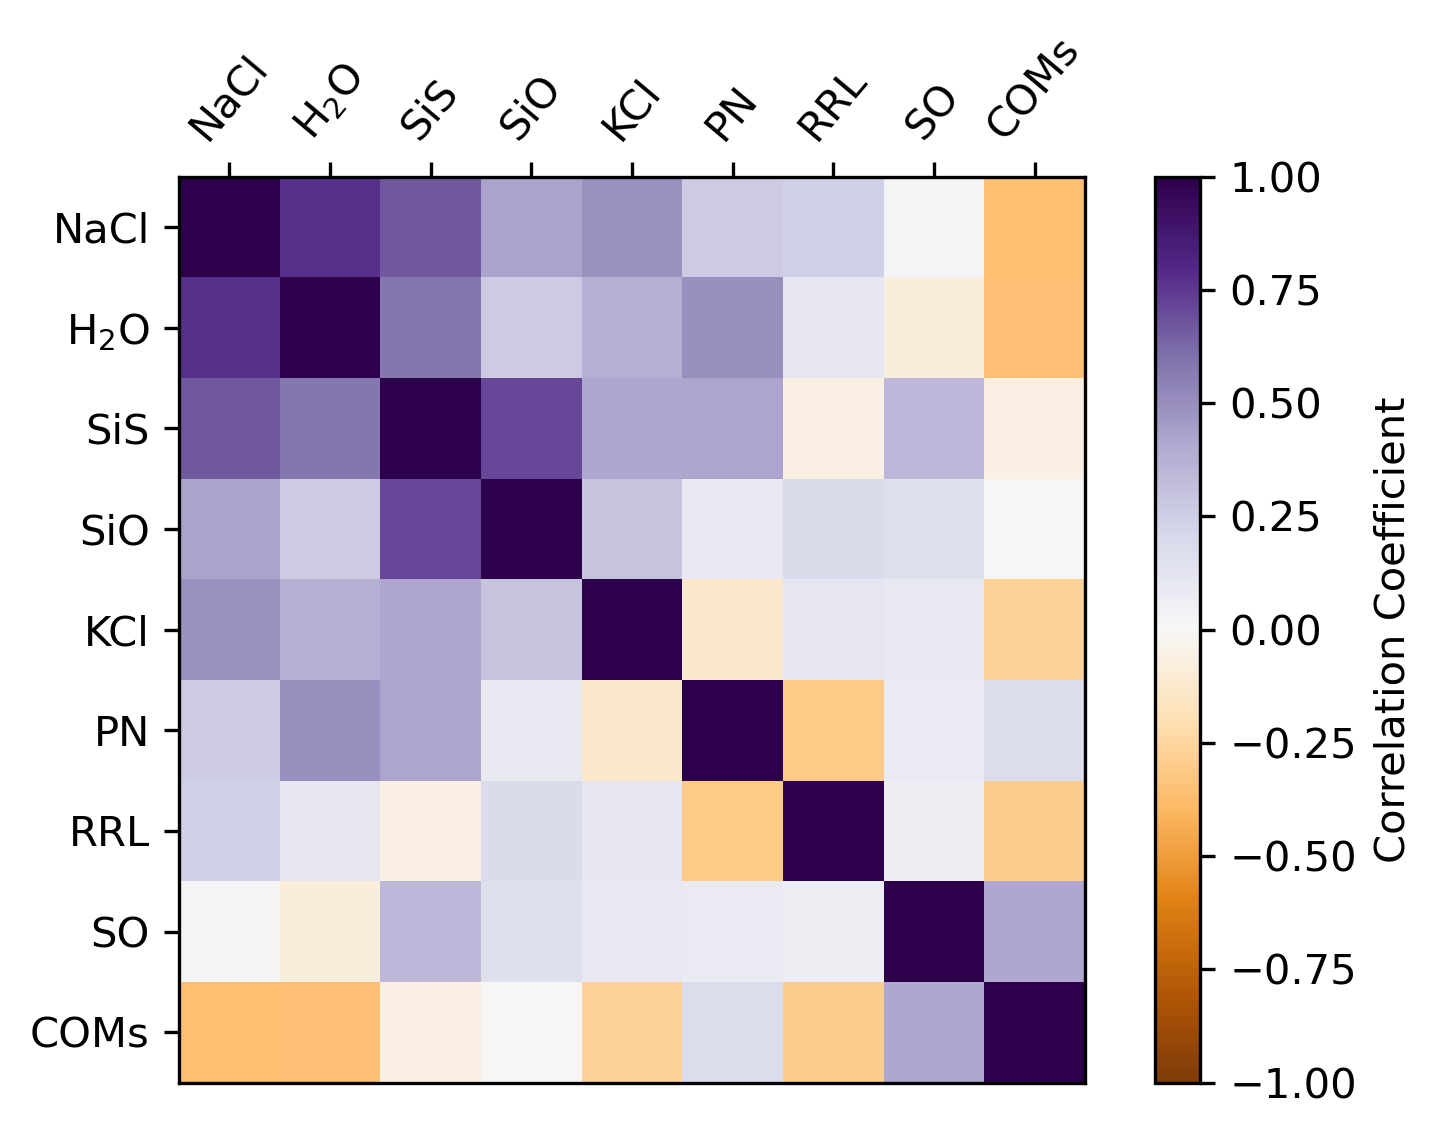
Salts, SiS, SiO, and PN are seen together [but limited spectral coverage]
Clusters are sites of interactions & collisions
The BN/I/x interaction is the poster case of accretion ended by dynamical interaction.

...even though Orion is only a medium-mass proto-open-cluster
Classic model: a "core mass function" maps to the IMF

Many alternatives, no consensus on which is best
≠
Cores change states
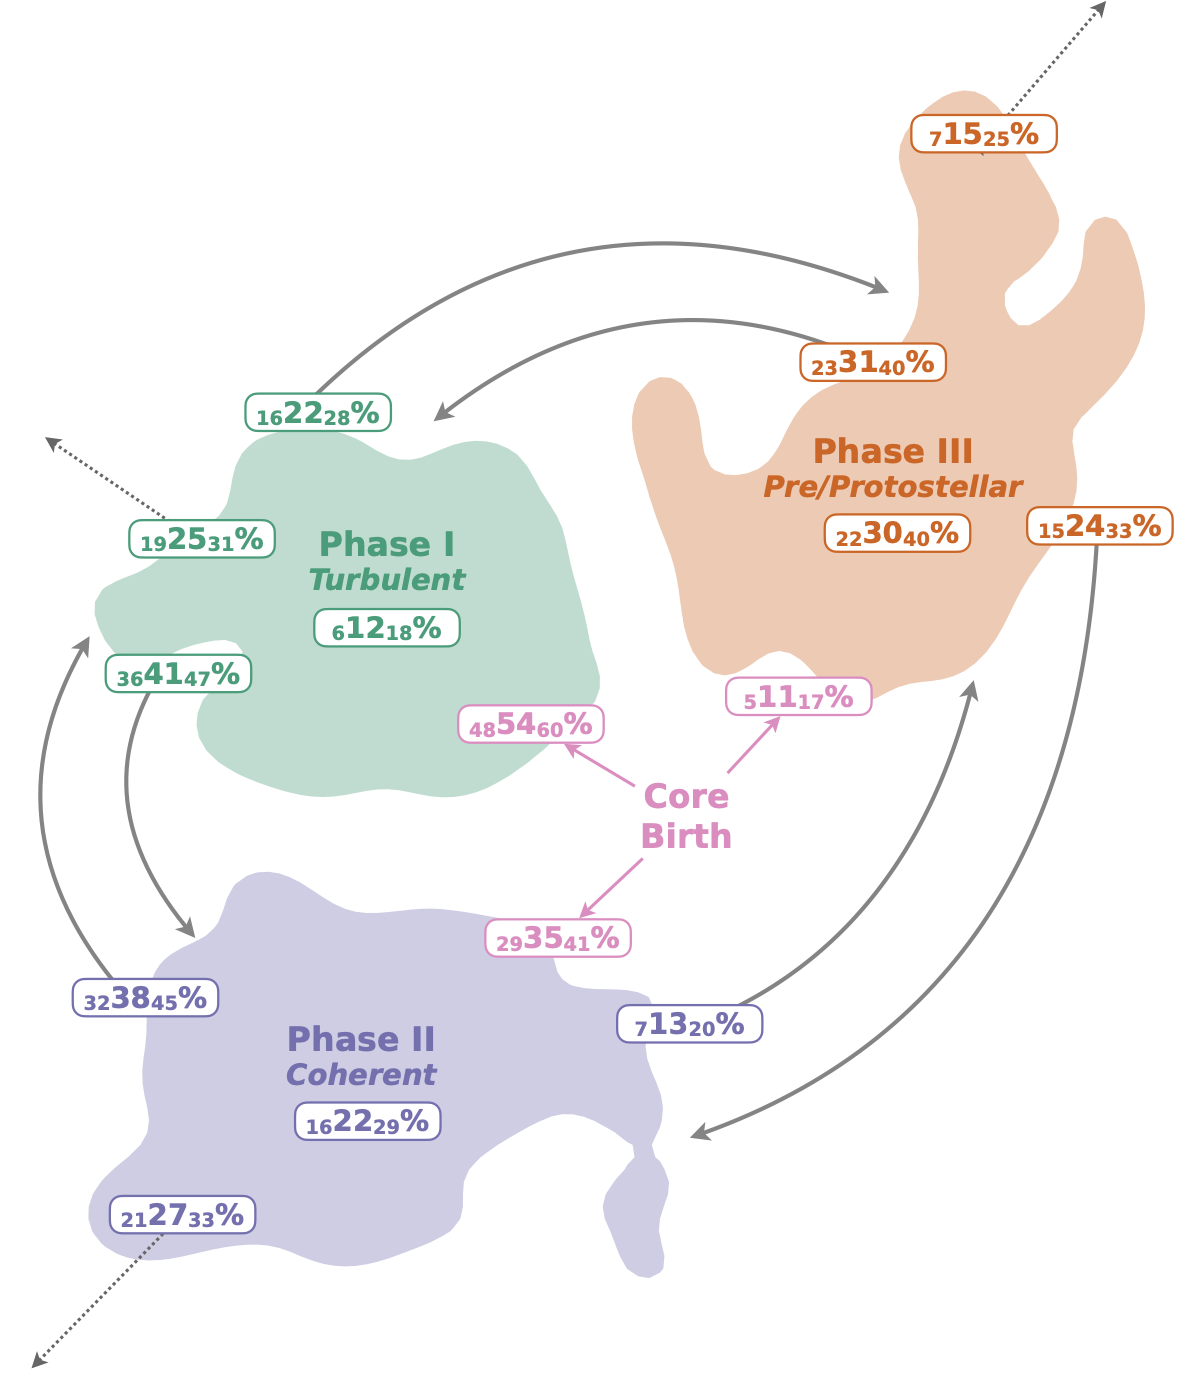
...but the naïve version doesn't work
ALMA-IMF "Core" Mass CDF
The CMF in protoclusters is shallower than the IMF
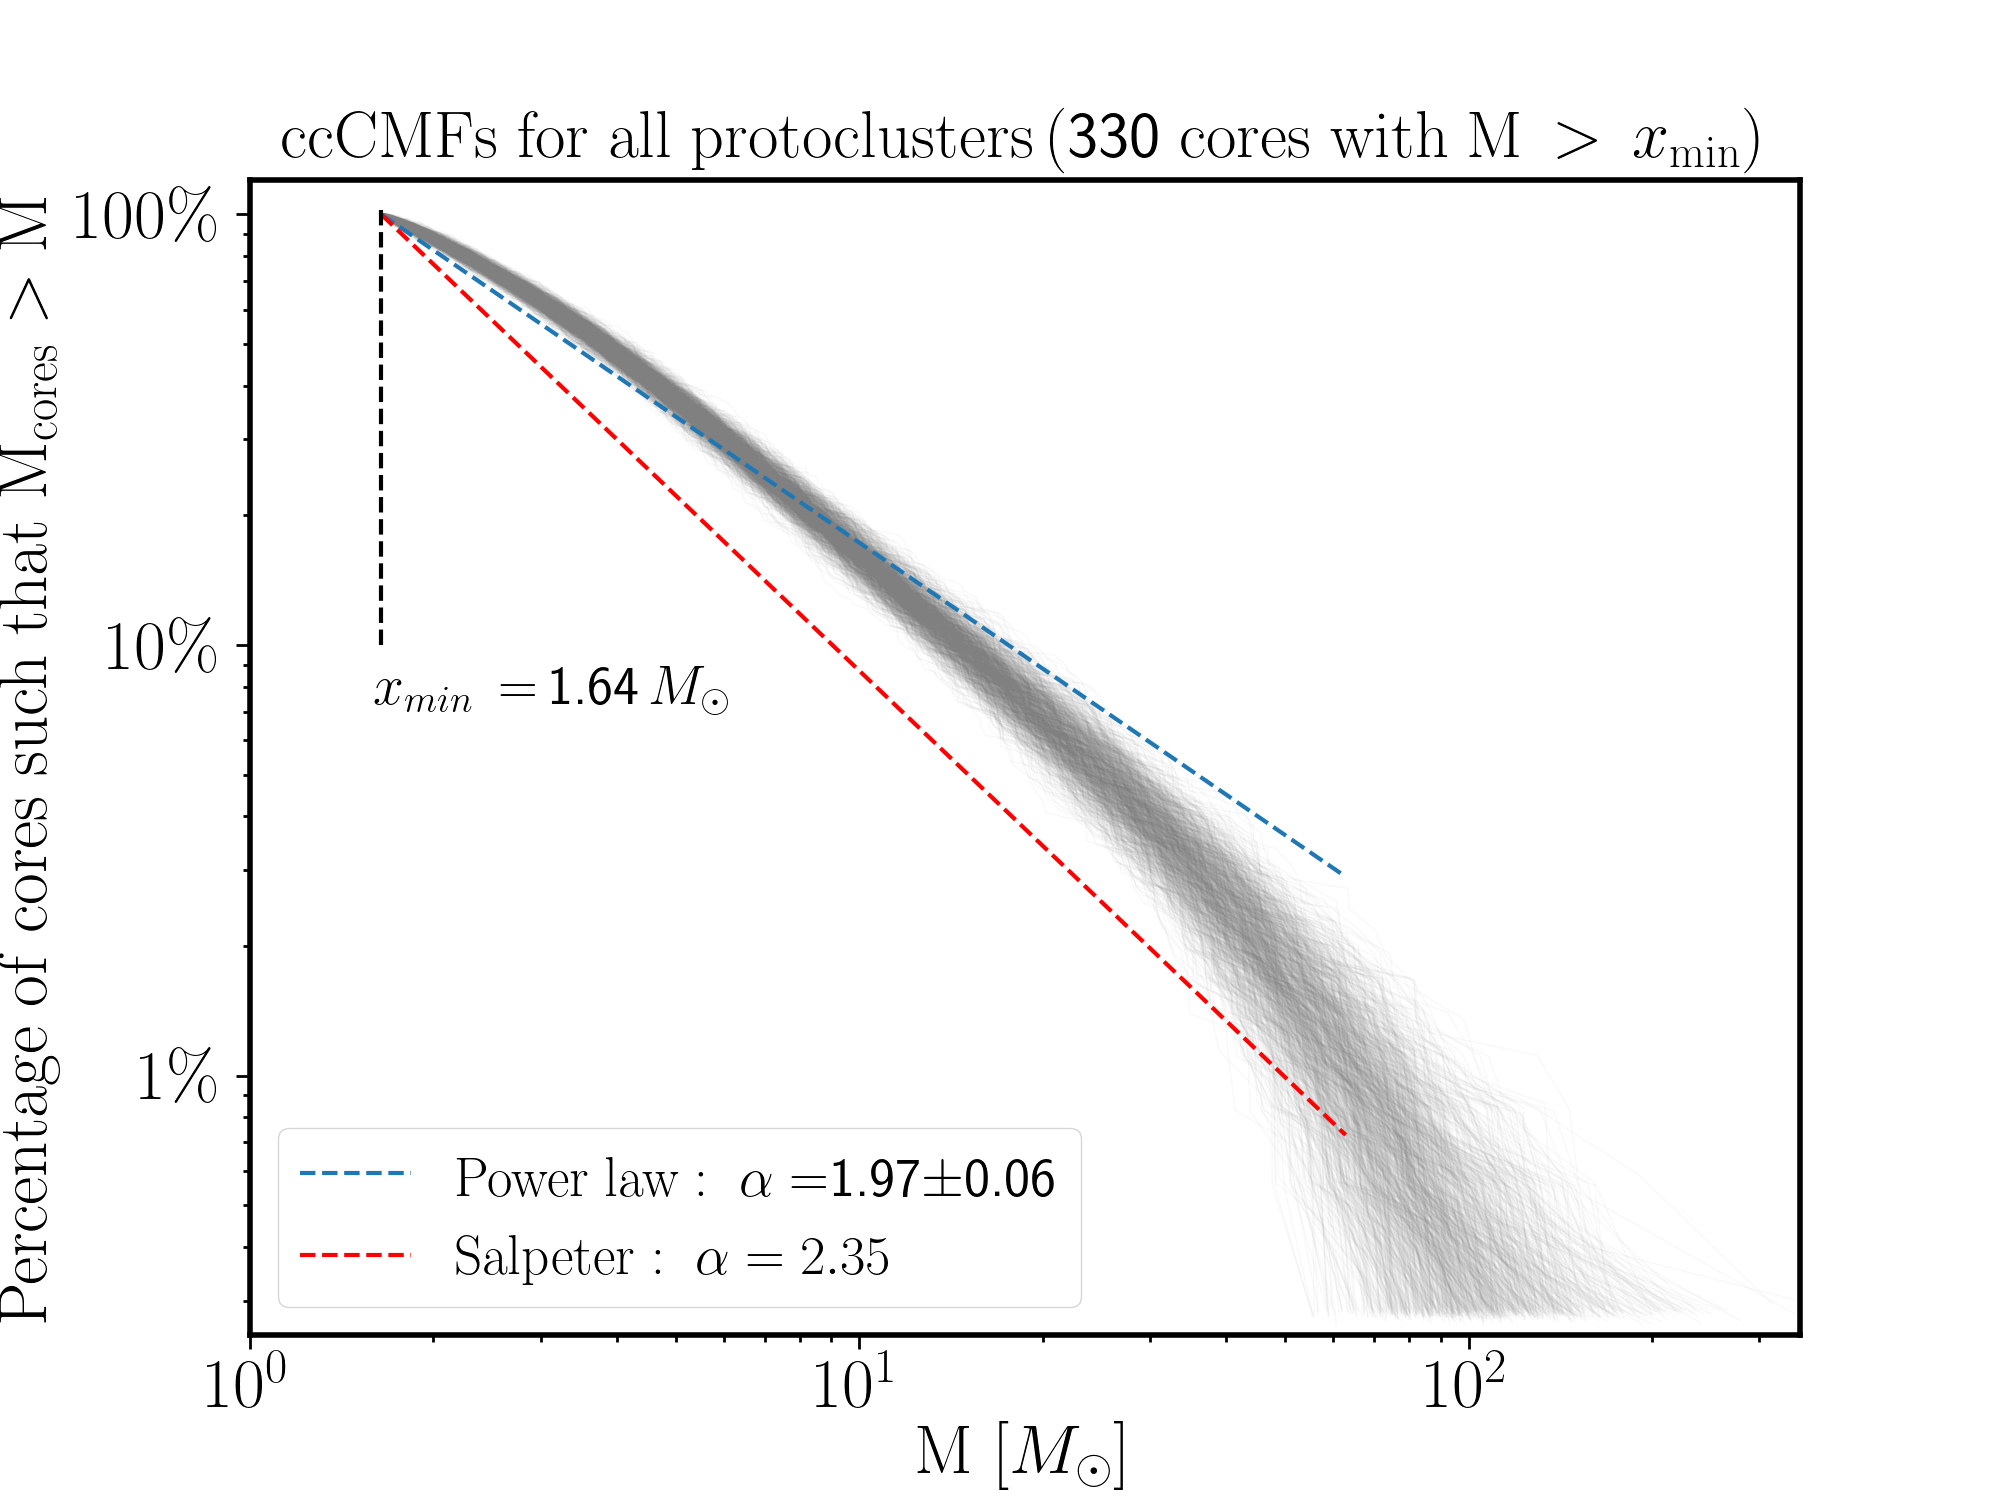
Louvet+ 2024
Many! Differ in: resolution, algorithm, selection.
Nearby surveys are only-starless; more distant are starless + protostellar
| Publication | Distance | Ncores | Mmin | Mmax | Resoln [au] | Slope | "stage" | Figure |
|---|---|---|---|---|---|---|---|---|
| Louvet+ 2024 | 2-6 | 330 | 1.64 | 200 | 2000 | 0.97 | HM | |
| Zhang+ 2024 | 0.4 | 927 | 0.3 | 20 | 8000 | 1.4 | LM | 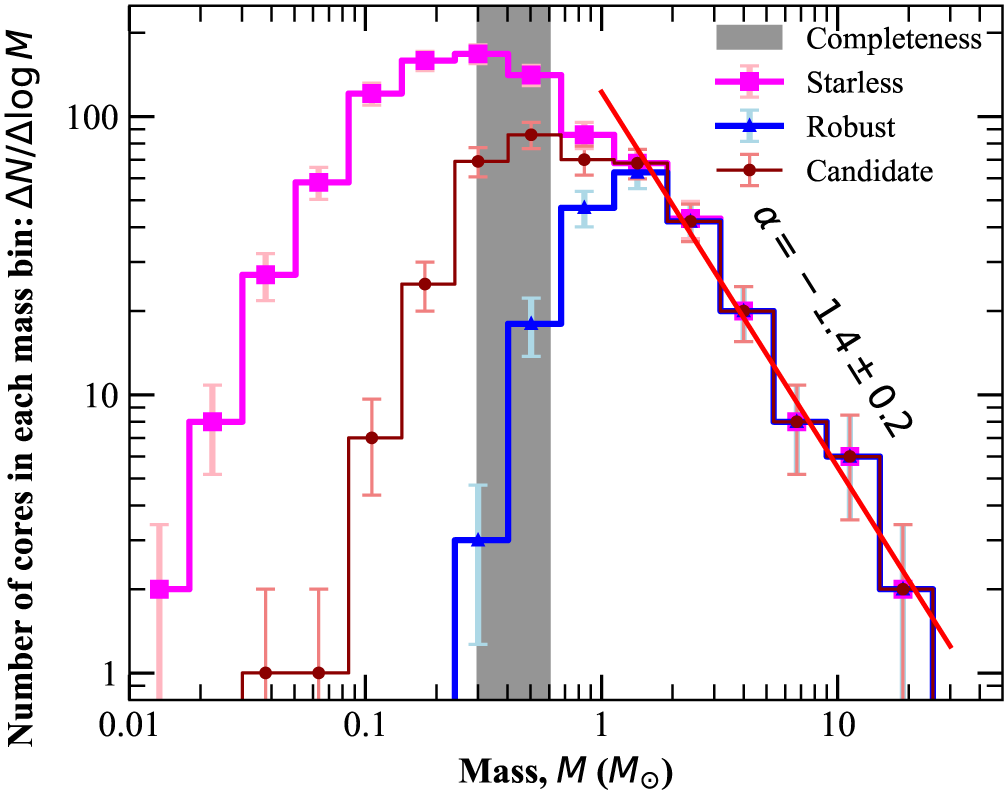 |
| Armante+ 2024 | 2.4 | 80 | 0.03 | 13.2 | 2000 | 1.44 | HII | 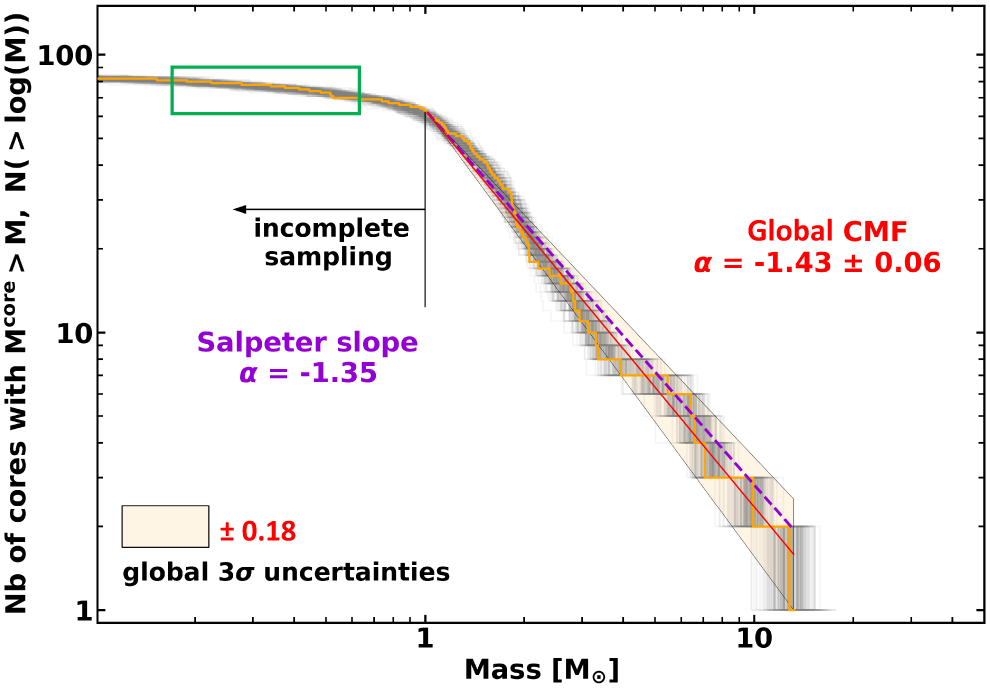 |
| Cheng+2024 | 4.5 | 183 | 0.5 | 10 | 3000 | 1.15 | HM |  |
| Pouteau+ 2023 | 6 | 205 | 0.8 | 70 | 2500 | 0.93 | HM | 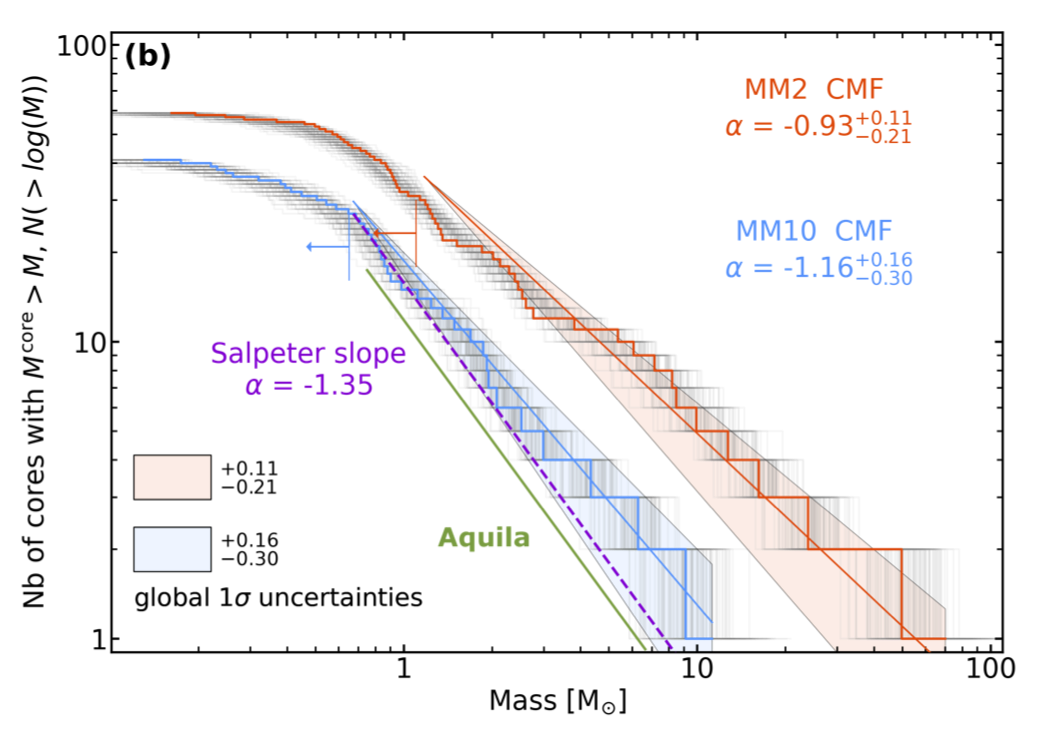 |
| Li+ 2023 | 0.7 | 570 | 4 | 200 | 15000 | 1.35 | LM |  |
| Suárez+ 2021 | 7.1 | 40 | 2.0 | 59 | 1000 | 1.11 | HII |  |
| Könyves+ 2020 | 0.4 | 292 | 0.2 | 20 | 8000 | 1.33 | LM | 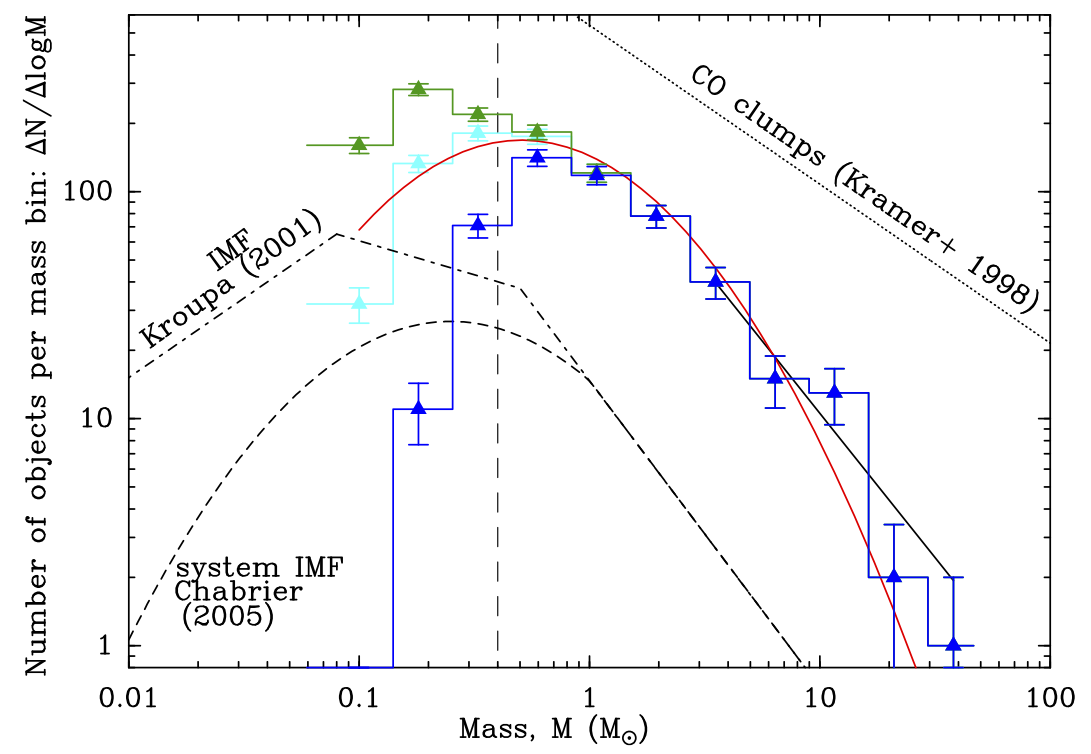 |
| ... | ||||||||
How does the CMF become the IMF?
Many cores are protostellar - so there's a mass correction
The path to better mass measurement:

 Theo Richardson
The path to better mass measurement:
Theo Richardson
 Desmond Jeff+ 2024
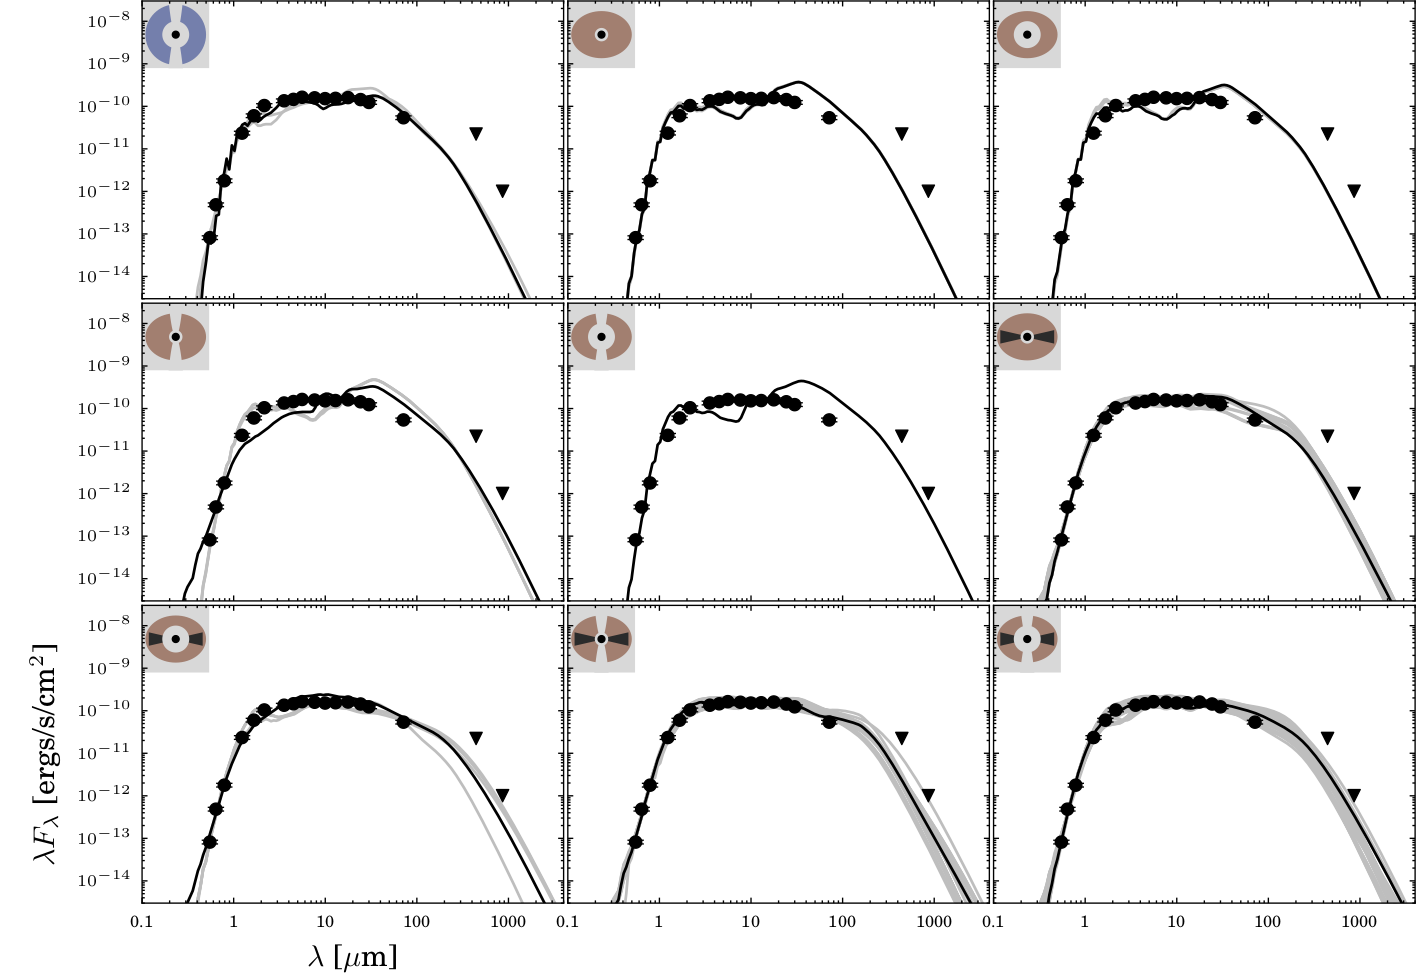
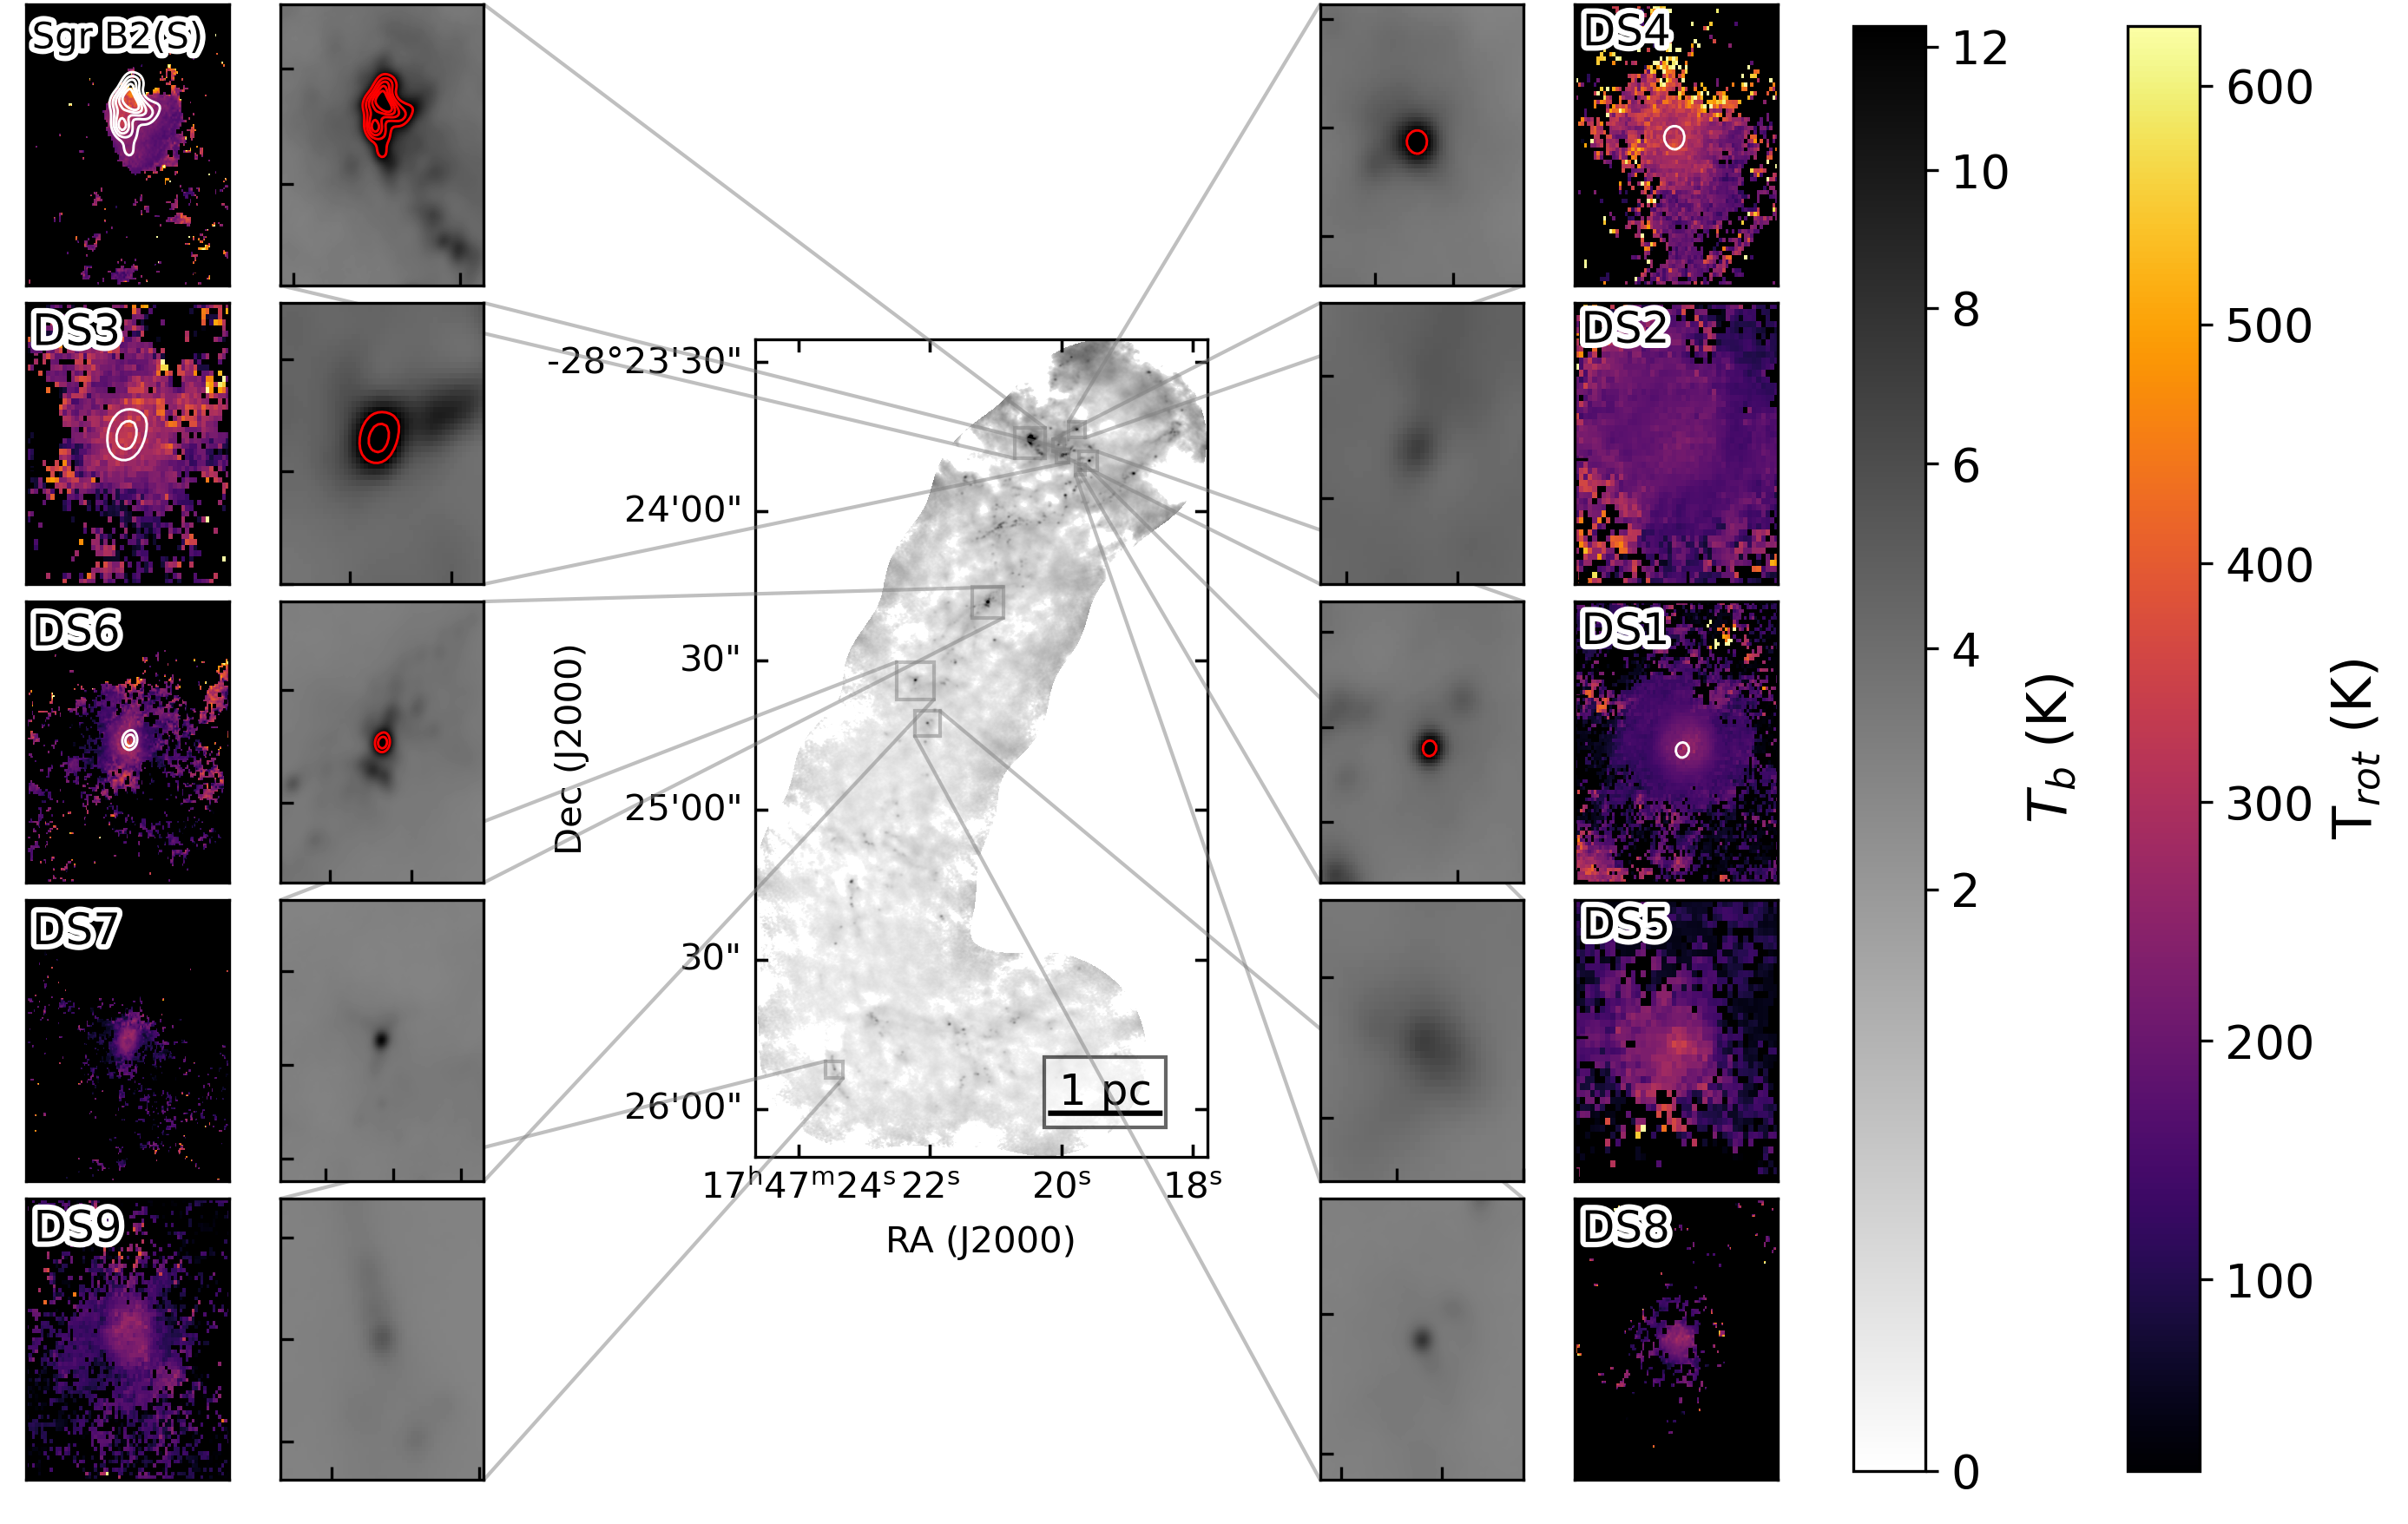
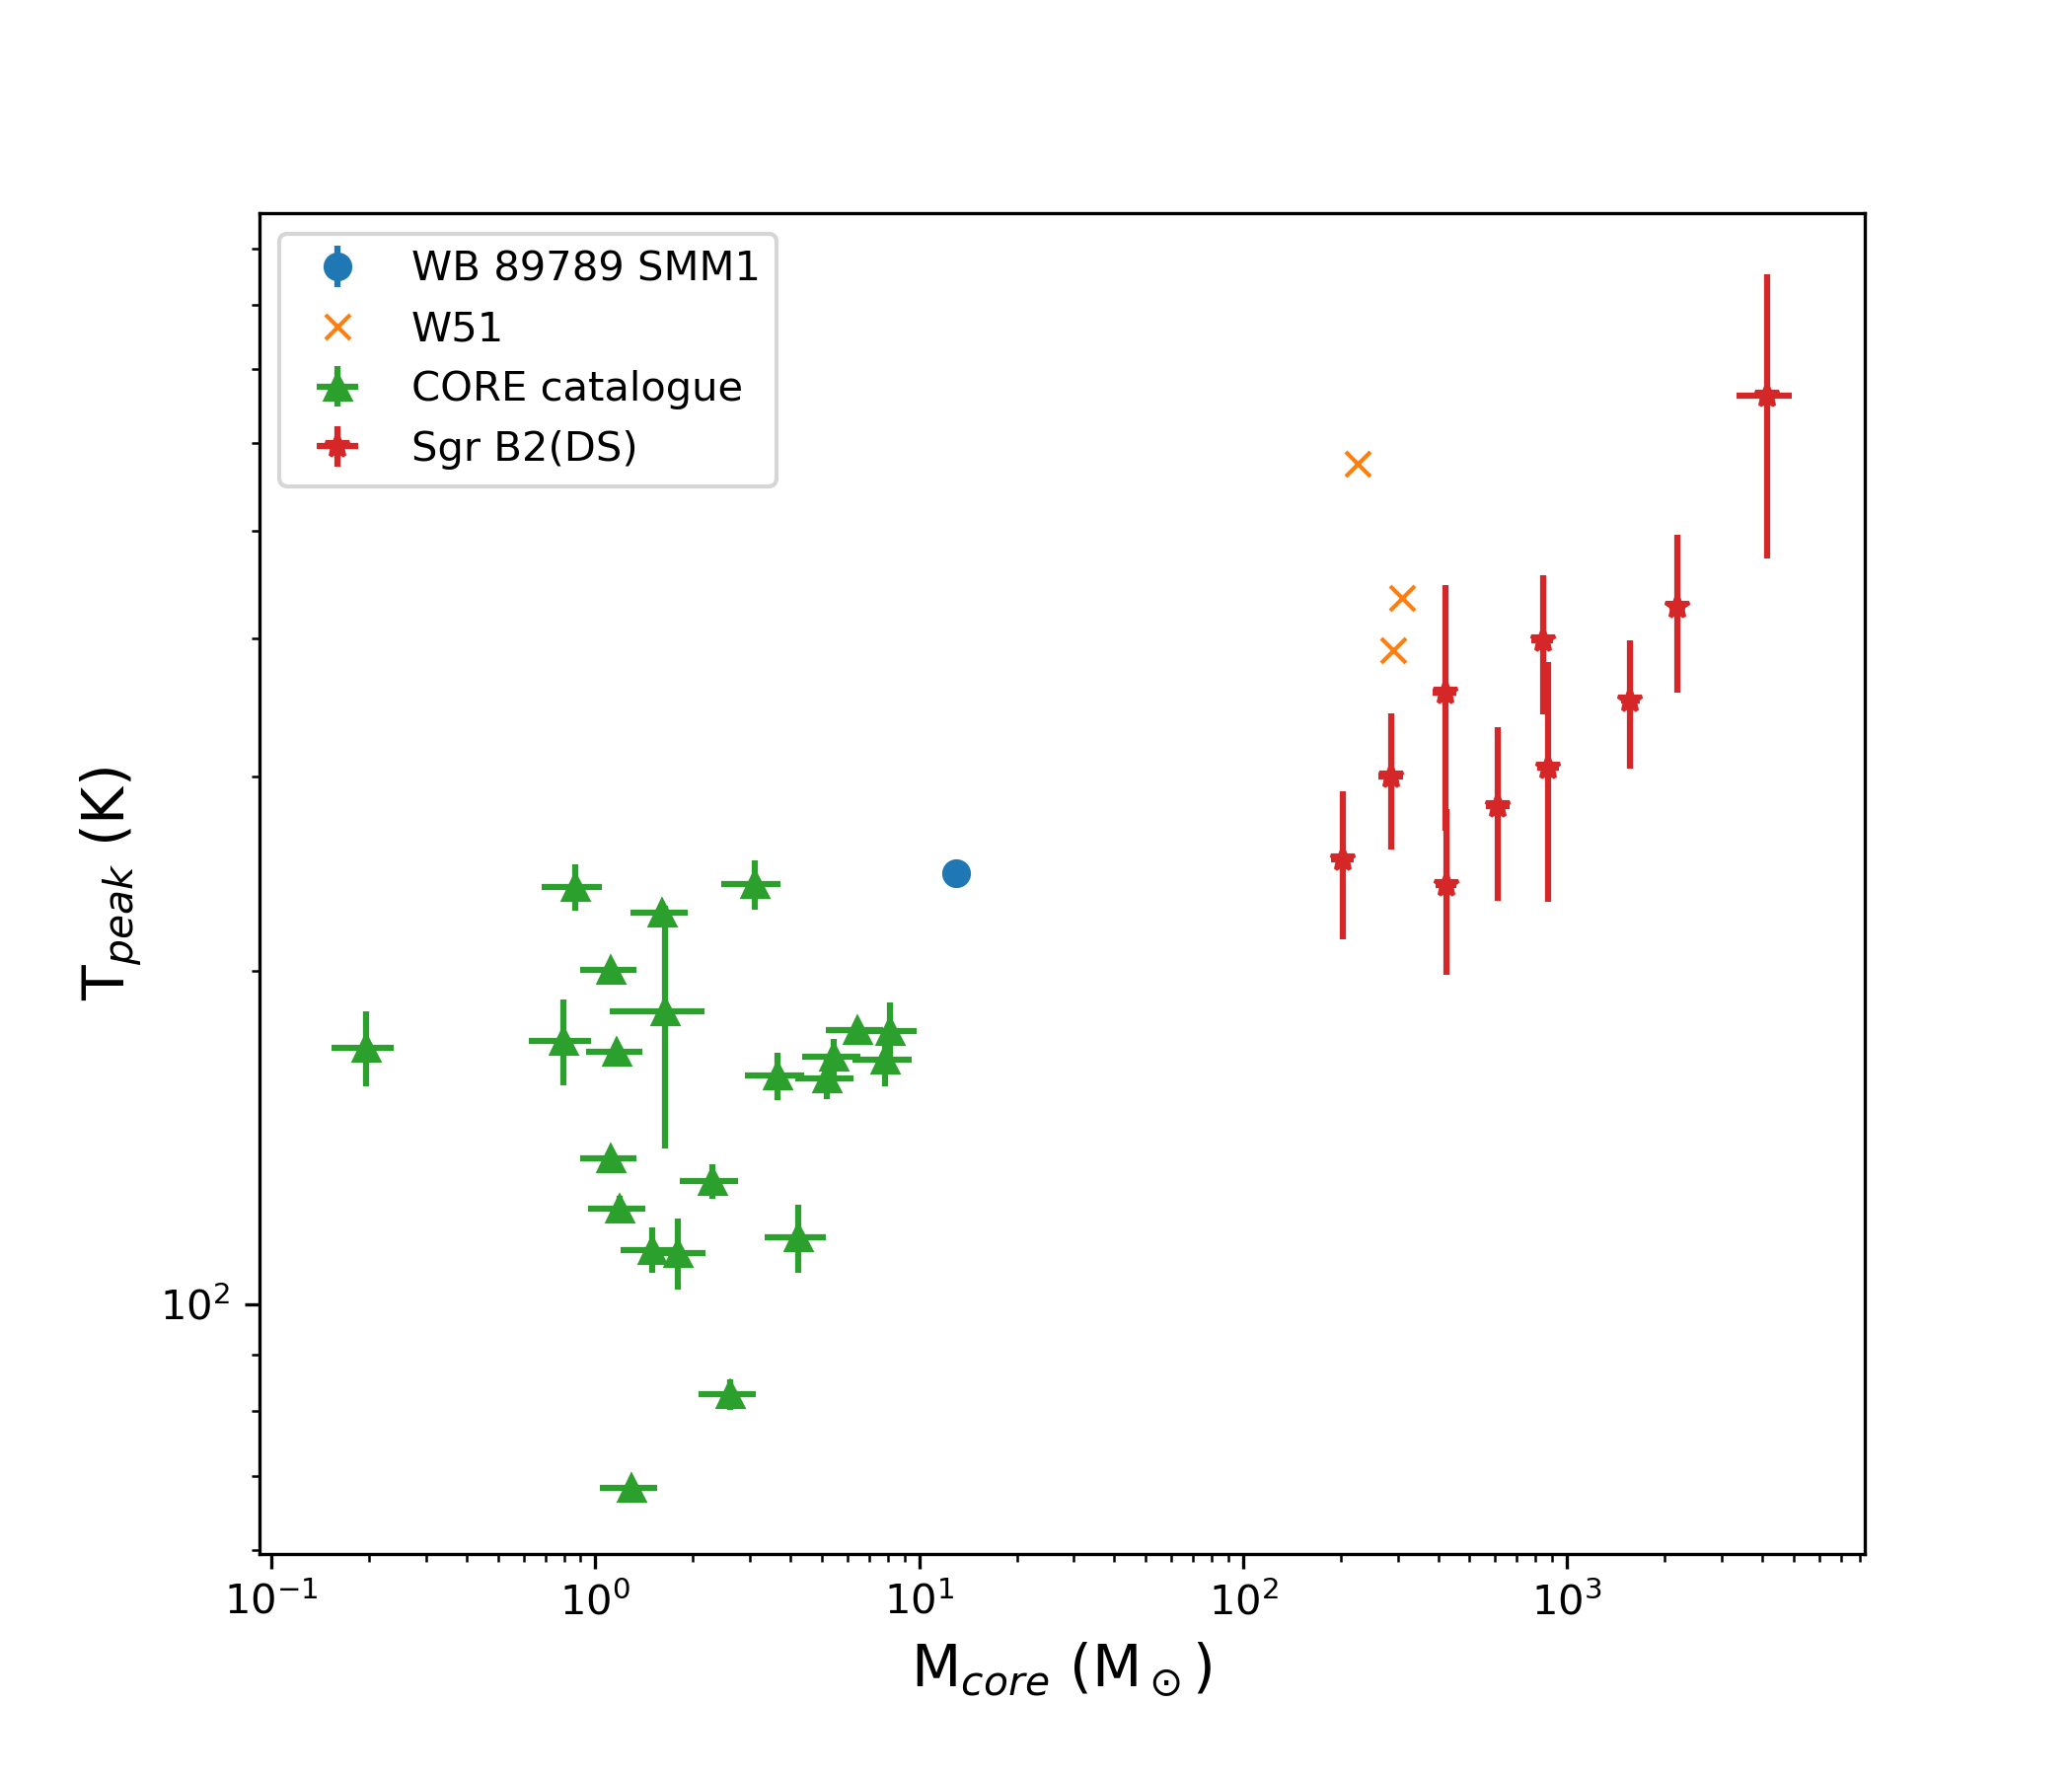
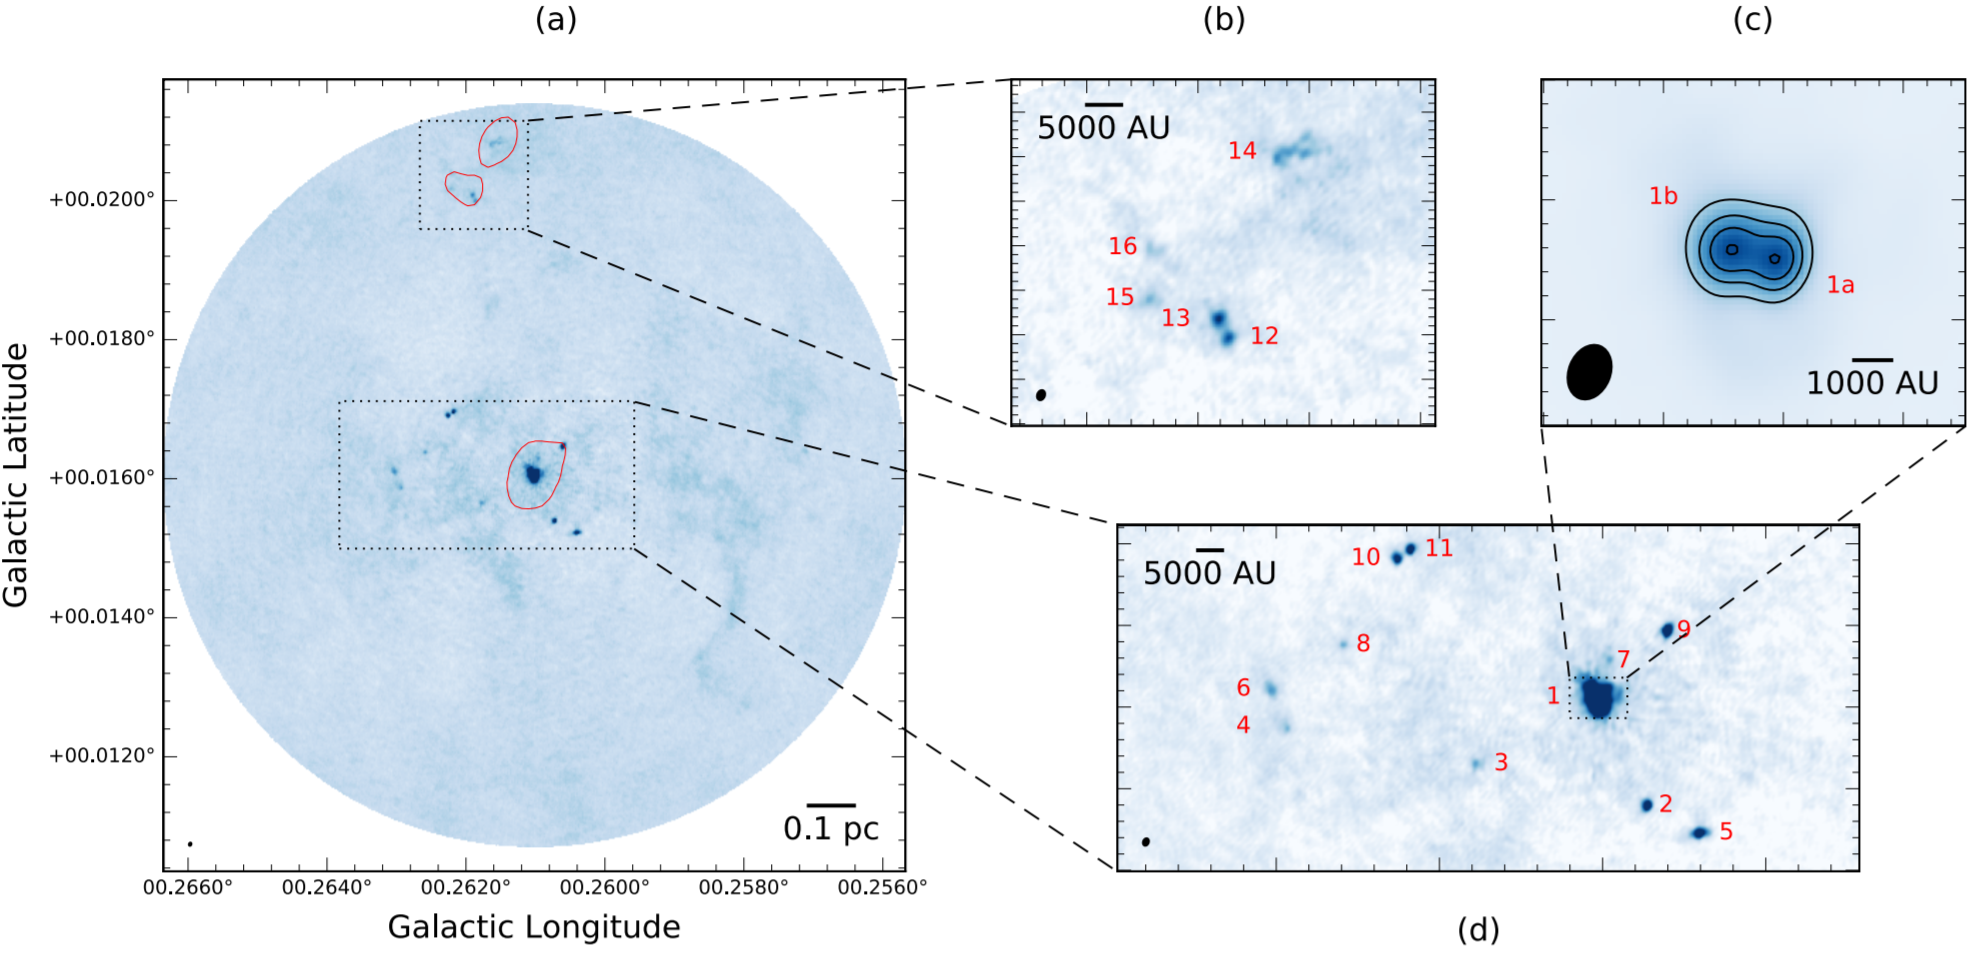
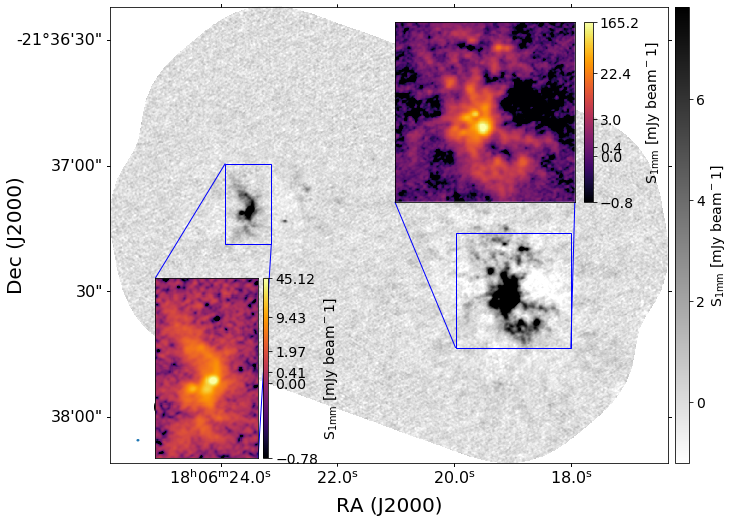
Ten hot cores in Sgr B2 DS
outside the massive clusters

Classic HII region feedback:
The Jeans Mass MJ is the mass where gravity and thermal pressure are balanced.
MJ ∝ T3/2 ρ−1/2


Is star formation different in other environments?
Is star formation different in other environments?
Is star formation different in other environments?
Is star formation different in other environments?
Is star formation different in other environments?
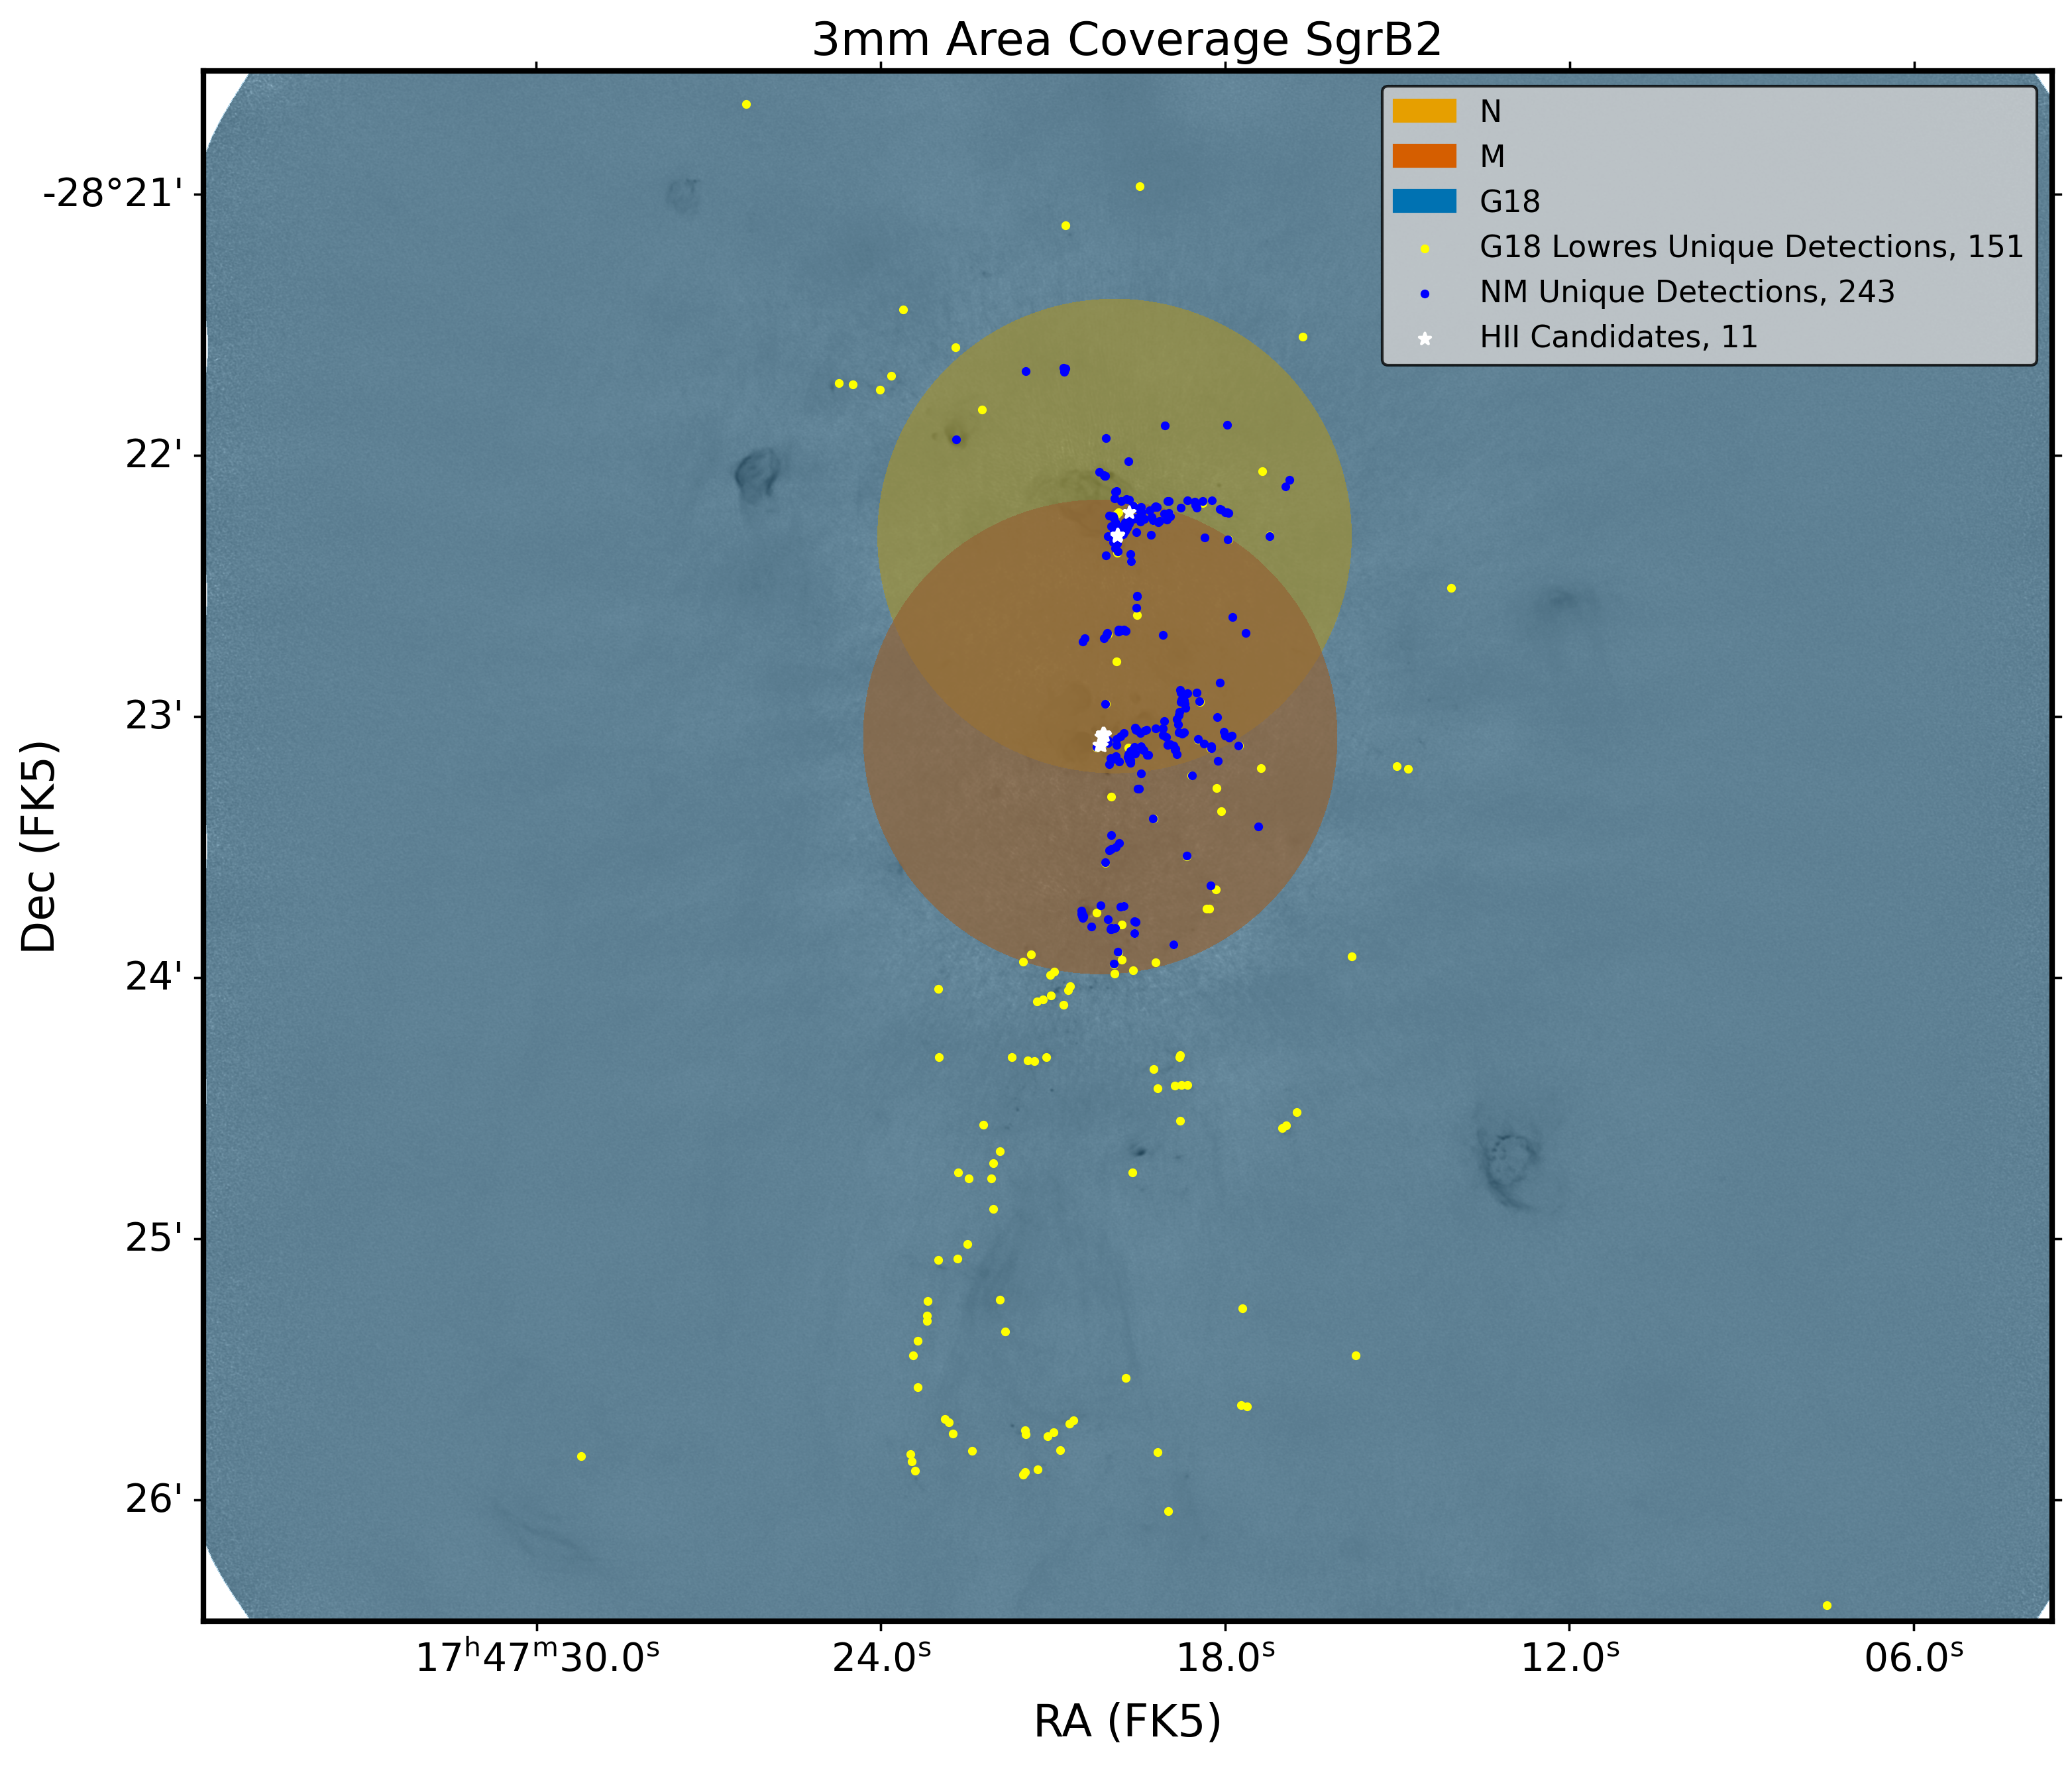
Comparison of Sgr B2 (one cloud, 200 pc2) with

ALMA enables protostar counting in
The path to better mass measurement:
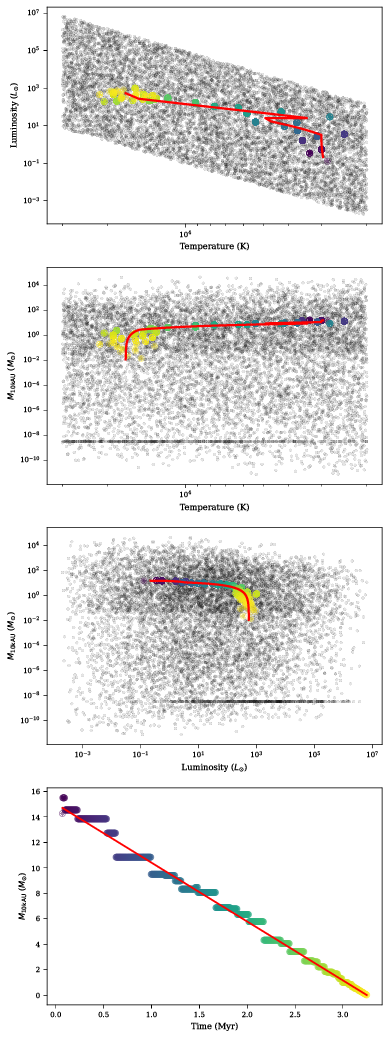
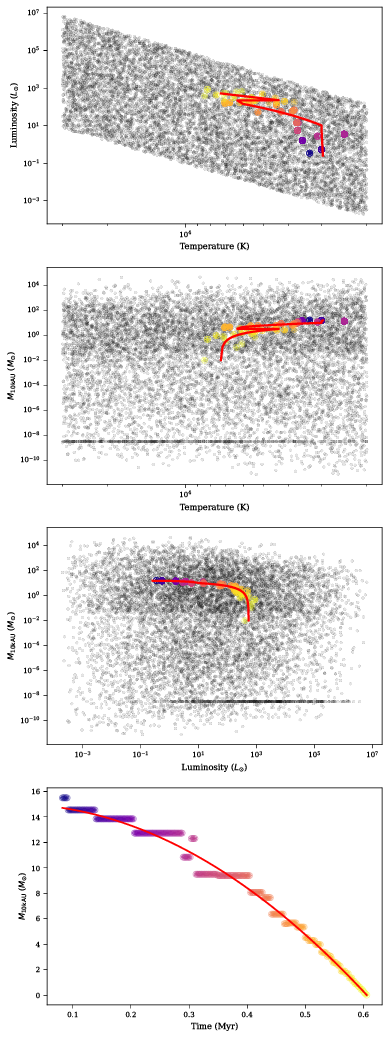
YSO modeling → luminosity functions
Richardson, Ginsburg, Indebetouw, Robitaille 2024 (2401.12810)
NSF 2008101:
"How are stellar masses set?"
"How are stellar masses set?"
Theo Richardson
The path to better mass measurement:
YSO modeling → luminosity functions
Theo Richardson
Hot cores in the Galactic center: Distributed MYSOs
Desmond Jeff+ 2024
Ten hot cores in Sgr B2 DS
outside the massive clusters
TG ~ 200-500 K
M ~ 200 - 2900 M⊙
(proto-O-stars / clusters)
~5% of cores are hot cores
M ~ 200 - 2900 M⊙
(proto-O-stars / clusters)
~5% of cores are hot cores
Sgr B2 DS: More massive cores than the Disk
Several different scenarios: mix of mechanisms
How is star formation in high-mass clusters different?
- Feedback from one star affects many in clustered regions
- IMF depends on density, feedback, global conditions (e.g., Jones & Bate 2018, Narayanan & Dave 2012)
- Total star formation efficiency is higher.
- Collisions assemble the most massive stars?
(e.g., Fujii+ & PZ 2013, but see Moeckel & Clarke 2011)
Cartoon of high- and low-mass star formation
Main difference: massive stars affect their surroundings
Classic HII region feedback:
O-stars clear out their environment
Accreting massive young stars affect their environment
Accreting massive young stars affect their environment
Accreting massive young stars affect their environment
The characteristic fragmentation scale
The Jeans Mass MJ is the mass where gravity and thermal pressure are balanced.
MJ ∝ T3/2 ρ−1/2
The characteristic fragmentation scale is larger
Jeans Mass
MJ ∝ T3/2 ρ−1/2
Feedback affects dense gas
ALMA + VLA + GBT together give multiple temperature probes on multiple scales.
High-mass protoclusters are filled with gas warmed by feedback.
Ginsburg+ 2017, Machado+ in prep
The cartoon in the context of HMSF
These high mass cores suppress low-mass star formation (LMSF) in their vicinity.
They reduce or prevent LMSF in the cores of stellar clusters.
More extreme: 'cooperative accretion'
With enough high-mass stars forming concurrently, massive stars may prevent fragmentation entirely.
If they still have enough gravity to bind the gas, the remaining gas is forced onto the most massive gravitational sinks.
If they still have enough gravity to bind the gas, the remaining gas is forced onto the most massive gravitational sinks.
Is star formation different in other environments?
In the Galactic Center?
Is star formation different in other environments?
In the Galactic Center?
Is star formation different in other environments?
In the Galactic Center?
Is star formation different in other environments?
In the Galactic Center?
Is star formation different in other environments?
In the Galactic Center?
The CMZ
$\sim10^8$ M$_\odot$ of gas in $\sim200$ pc, 10% of Galactic star formationThe Central Molecular Zone of the Galaxy represents one extreme of star forming conditions in the Galaxy
The proto-Super Star Cluster Sgr B2 dominates SF in the CMZ
Two $>10^4$ M$_\odot$ clusters within $<3$ pc; $10^6$ M$_\odot$ of gas in $\sim10$ pcIn denser (parts of) galaxies, more stars form in clusters
Γ is the fraction of stars forming in bound clusters
Galaxy averages
The "Bound Cluster Fraction" is predicted higher in the CMZ
Γ is the fraction of stars forming in bound clusters
Galaxy averages
CMZ prediction
The "Bound Cluster Fraction" is higher in CMZs
Γ is the fraction of stars forming in bound clusters
Galaxy averages
CMZ prediction
Sgr B2 data
Sgr B2 data
The "Bound Cluster Fraction" was higher in the past
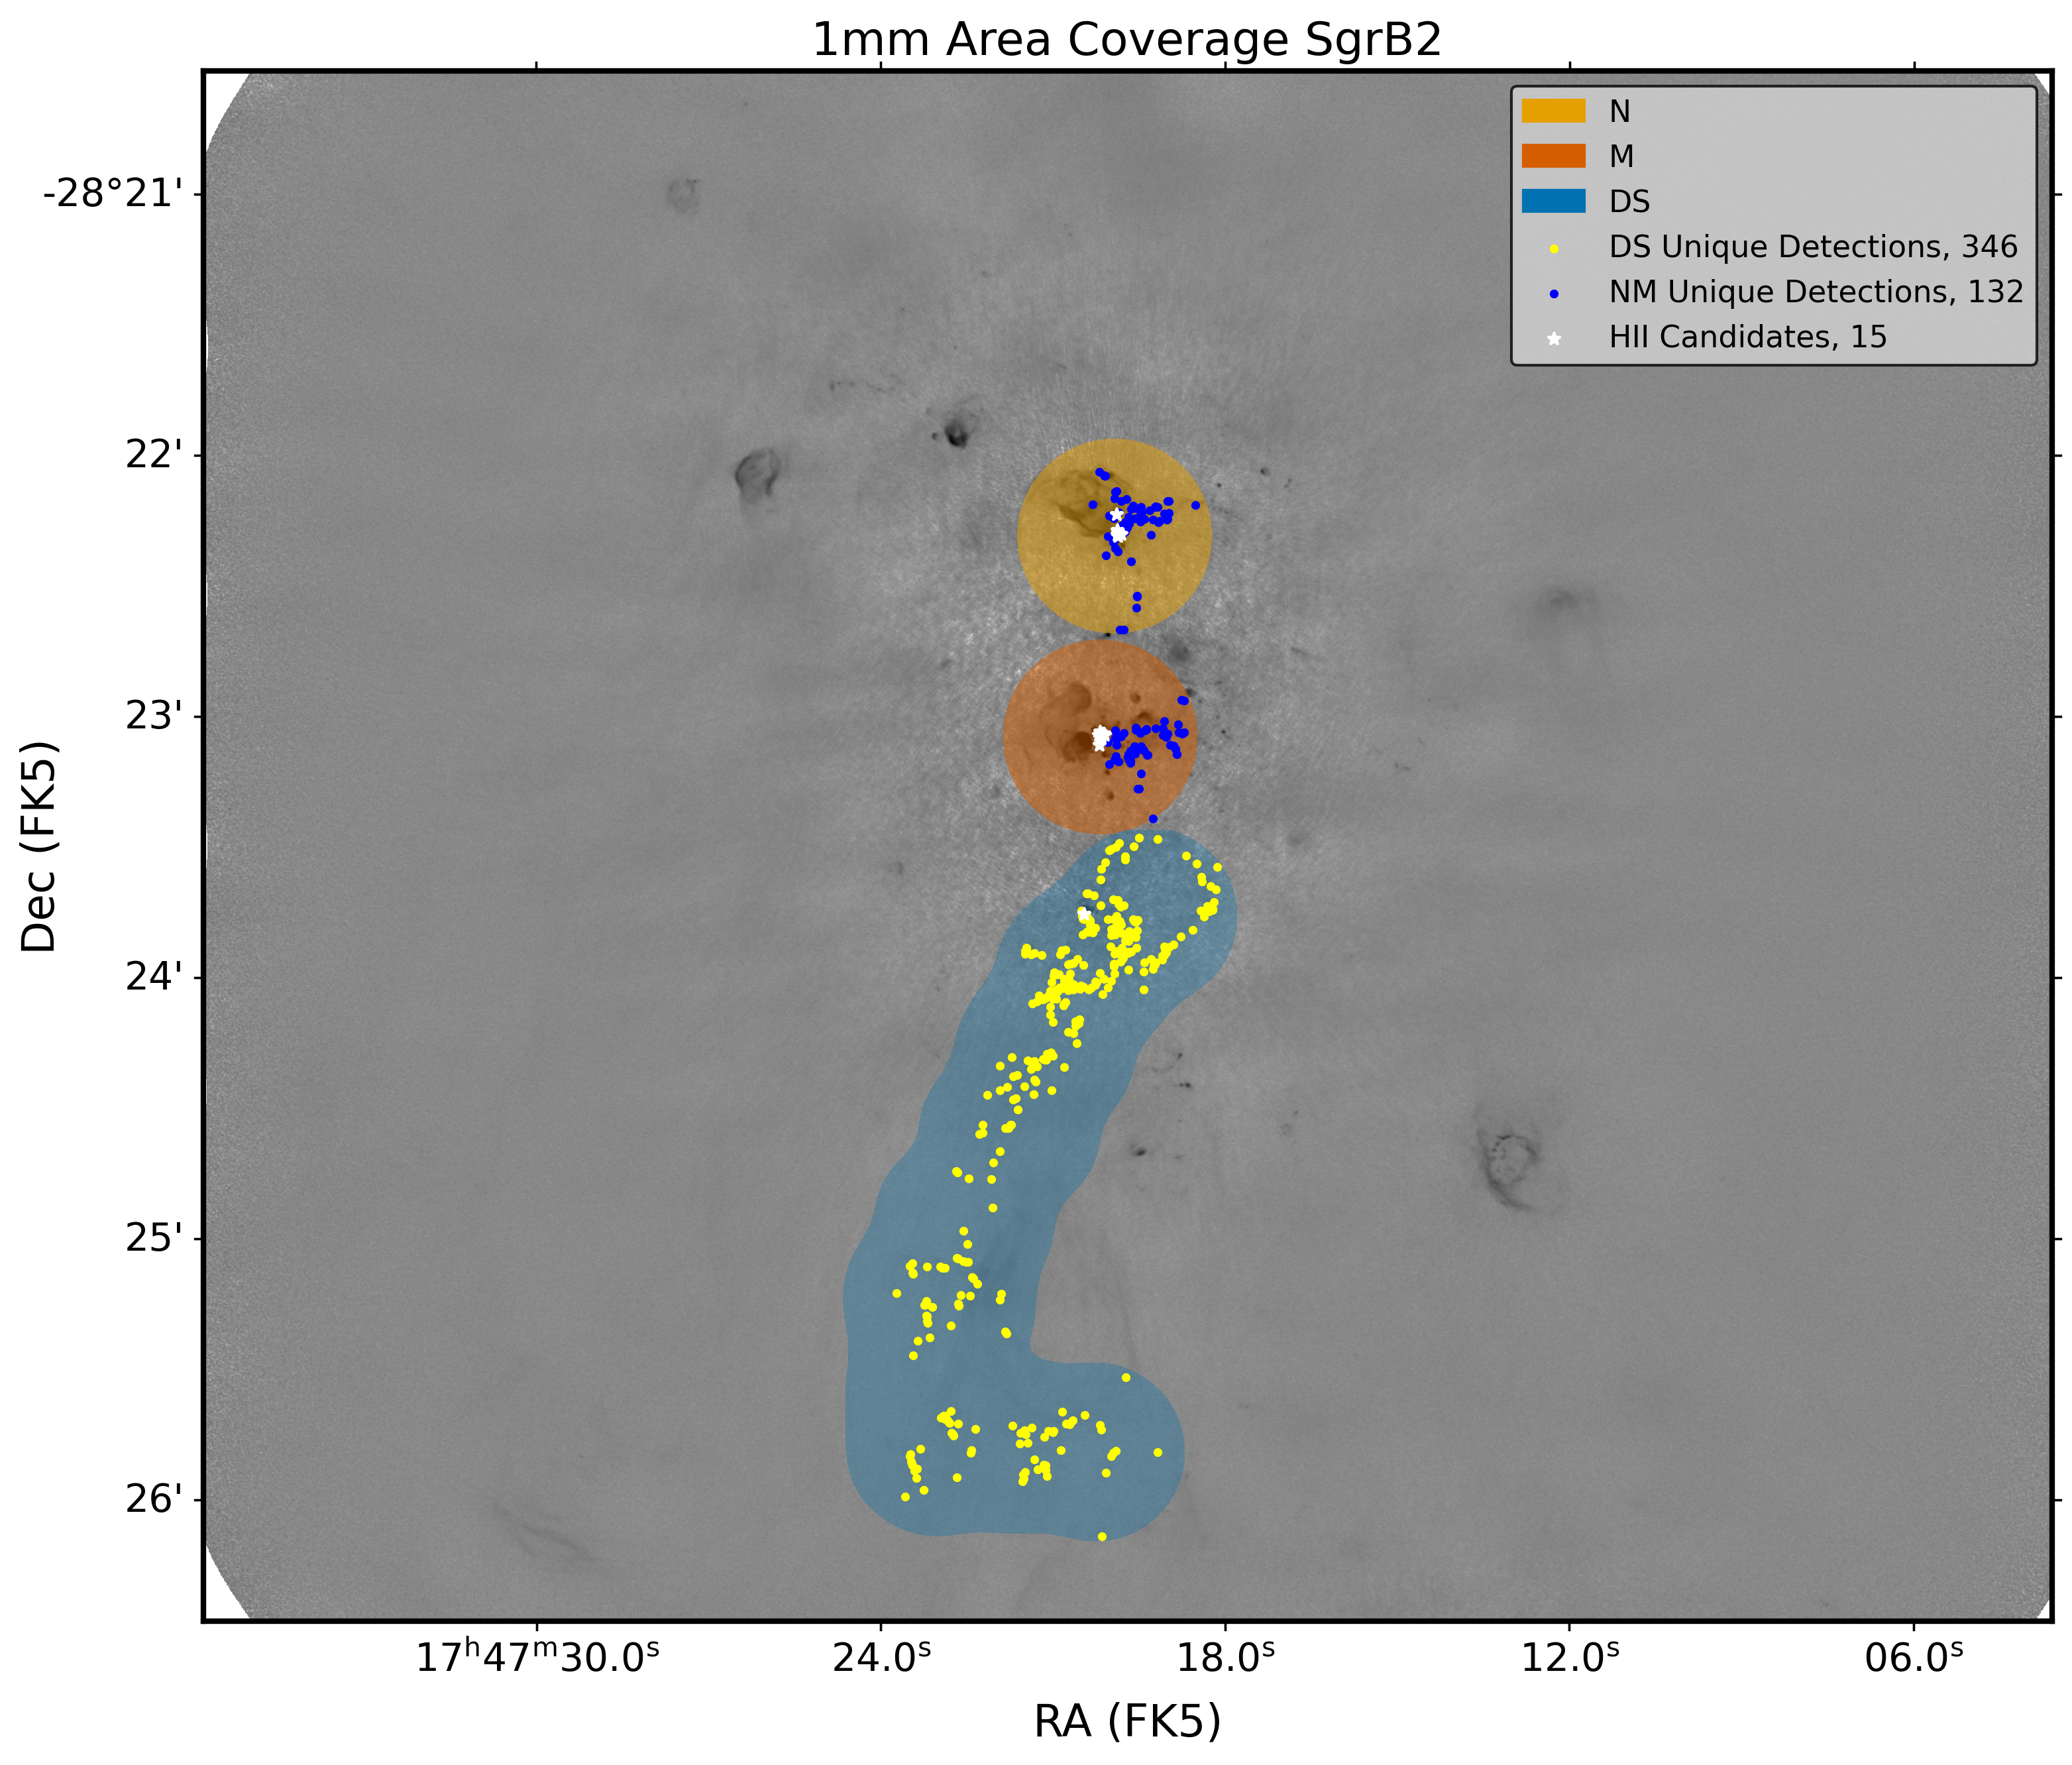
Zoom in to Sgr B2
The proto-Super Star Cluster Sgr B2 dominates SF in the CMZ
Two $>10^4$ M$_\odot$ clusters within $<3$ pc; $10^6$ M$_\odot$ of gas in $\sim10$ pcThe proto-Super Star Cluster Sgr B2 dominates SF in the CMZ
Two $>10^4$ M$_\odot$ clusters within $<3$ pc; $10^6$ M$_\odot$ of gas in $\sim10$ pcComparison of Sgr B2 (one cloud, 200 pc2) with
ALMA-IMF (15 SFRs, 53 pc2)
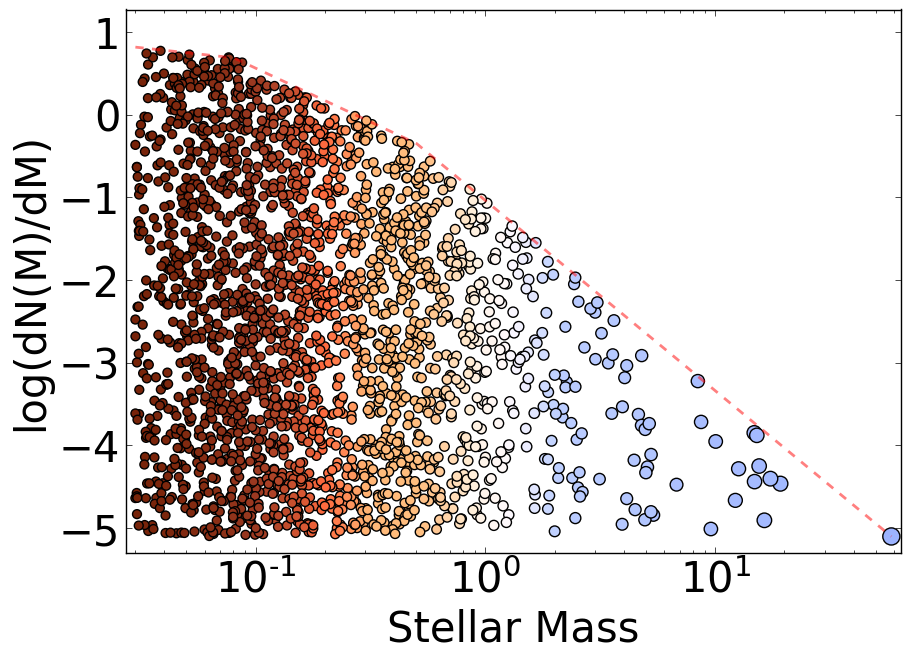
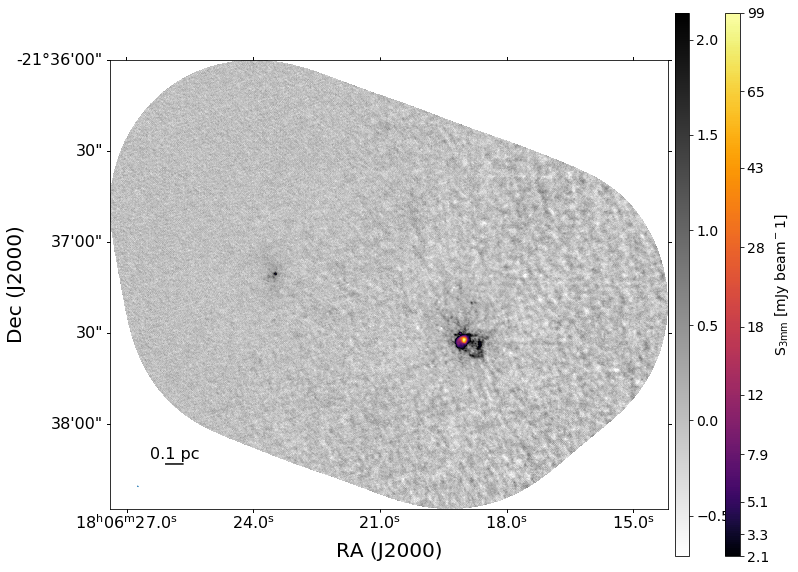
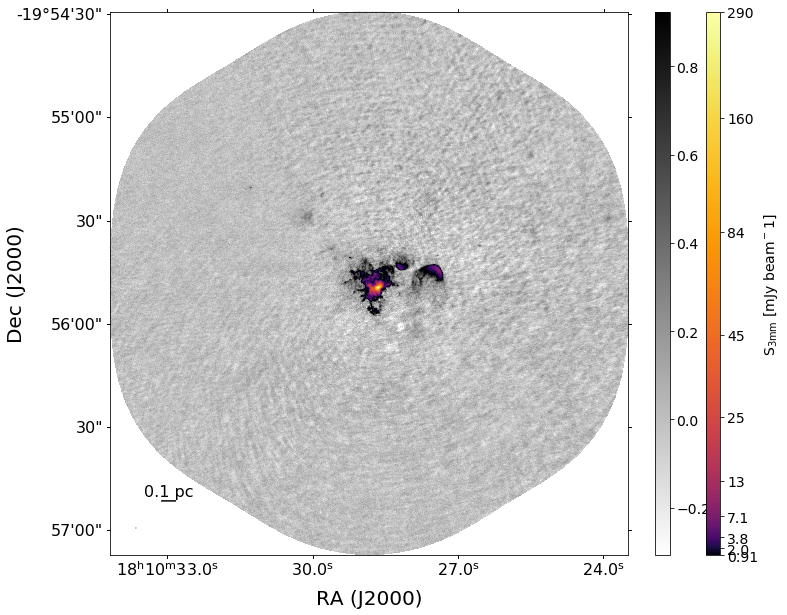
3mm catalog → Simplistic mass inferences
At this sensitivity, all are M>8⊙ YSOs
Mtot = 8 M⊙
∫0∞ M N(M) dM
∫8∞ M N(M) dM
∫8∞ M N(M) dM
= 96 M ⊙
The "Bound Cluster Fraction" is higher in CMZs
Γ is the fraction of stars forming in bound clusters
Galaxy averages
CMZ prediction
Sgr B2 data
Sgr B2 data
The CMZ: ACES
The first complete survey of the CMZ with 2.4" resolution (previous best was ~15")
between ~2 microns and 10 cm.
between ~2 microns and 10 cm.
Results forthcoming! Continuum, line data papers, catalogs, kinematic analyses, filament identifications all in prep....
... but the first result is unrelated (?) to star formation:
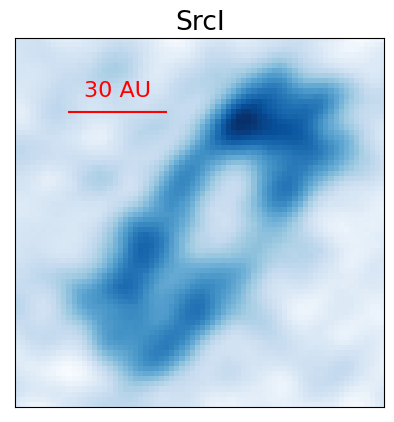
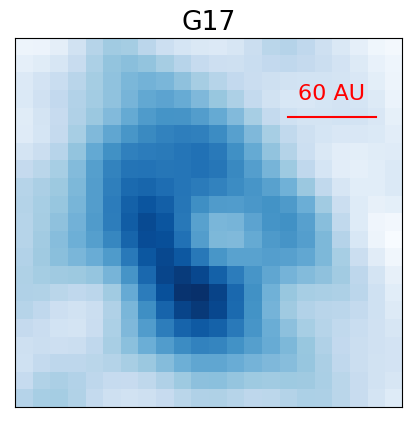
Brinary disks
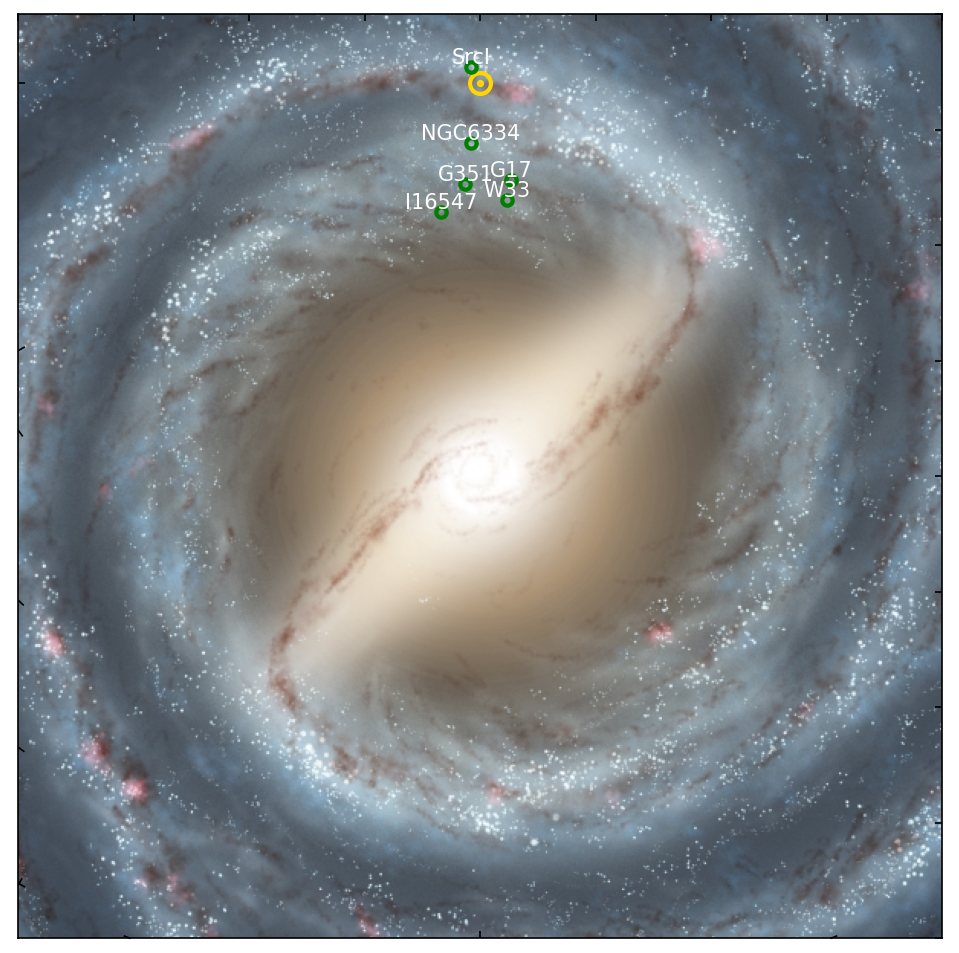
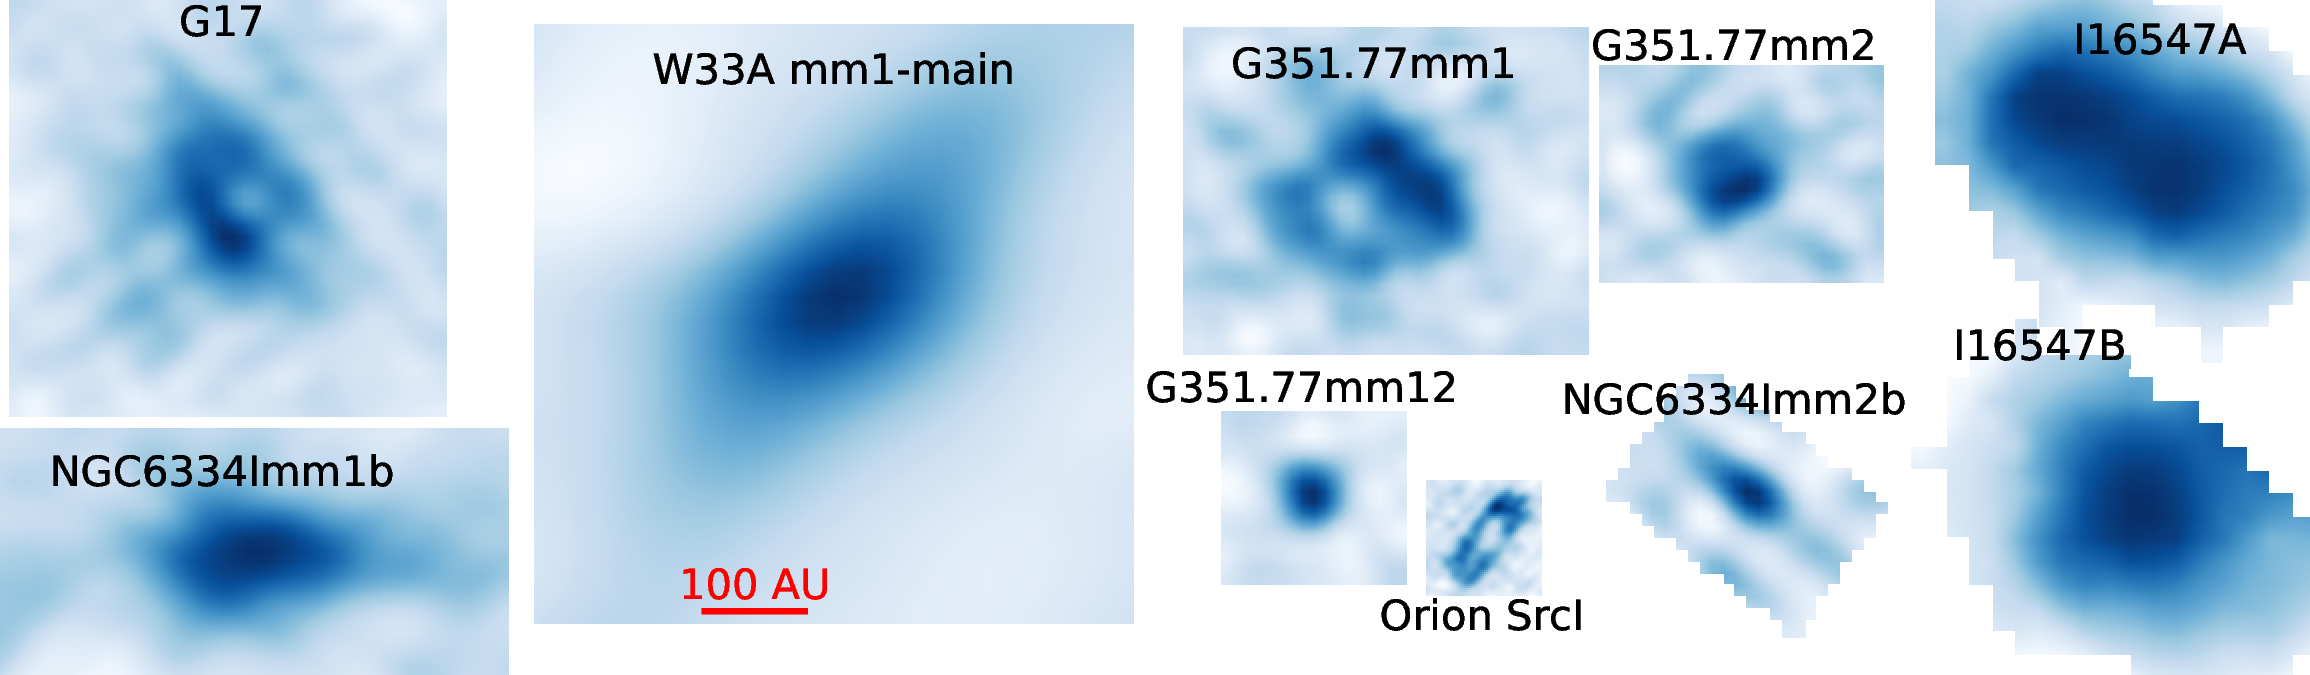
The SrcI disk has gas-phase salt (NaCl, KCl) and water (H2O).
So it's brine.
(blame Adam Leroy for this term)
IRAS16547A/B (Tanaka+ 2020)
have (unresolved) salt water disks
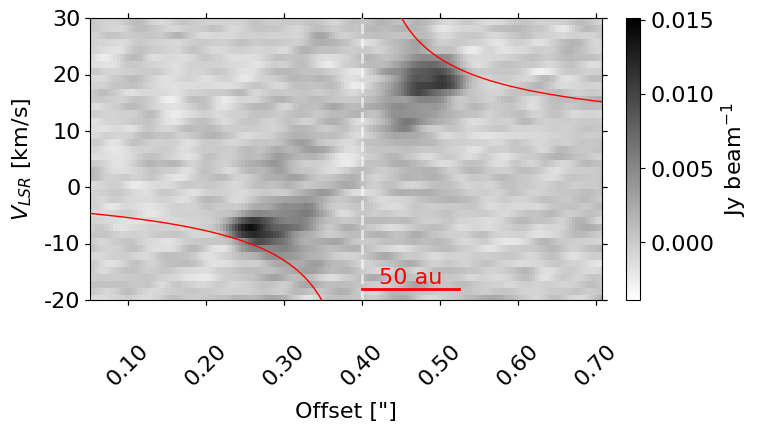
Brine lines measure dynamical mass
NaCl v=1 J=18-17
Stack of v=[0,1] Ju=[18,17]
SrcI
15 M⊙
30 M⊙
40 M⊙
What governs the star formation rate?
Turbulent ISM models
Turbulent ISM models
Turbulent ISM models
ALMA enables protostar counting in
distant, massive clouds
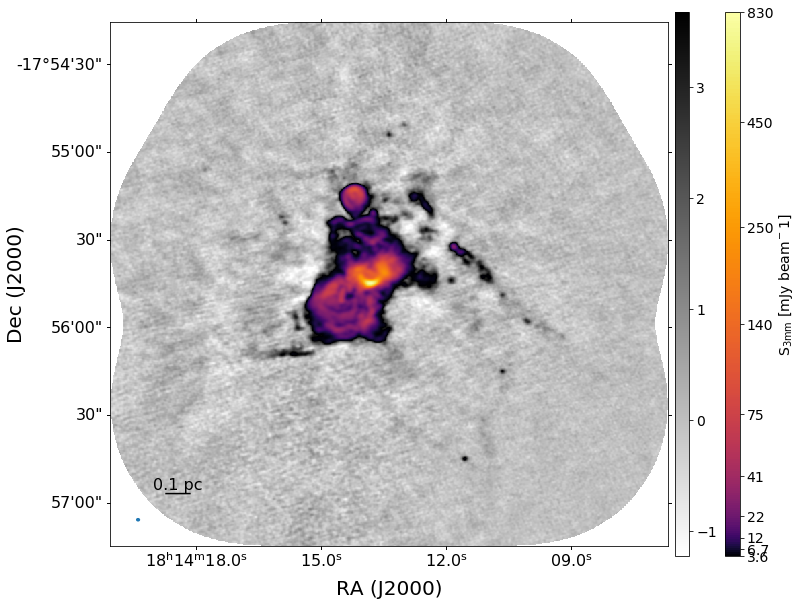
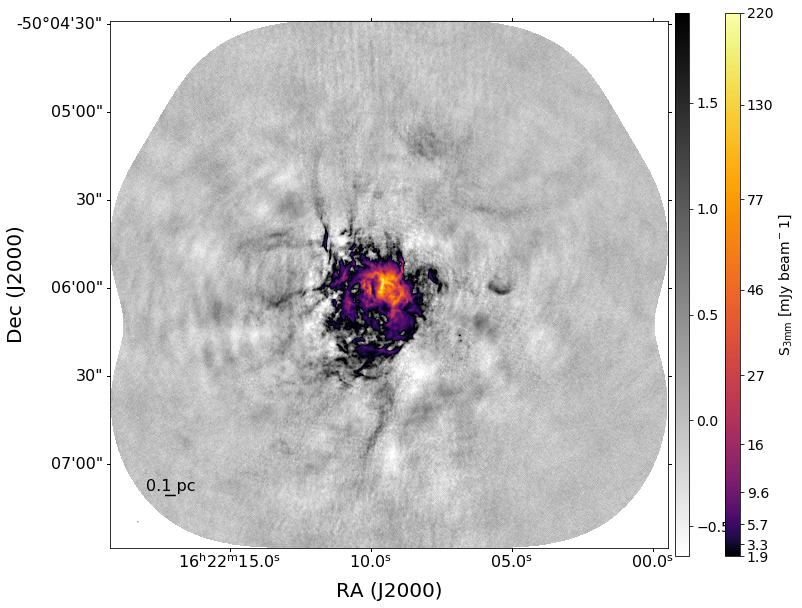
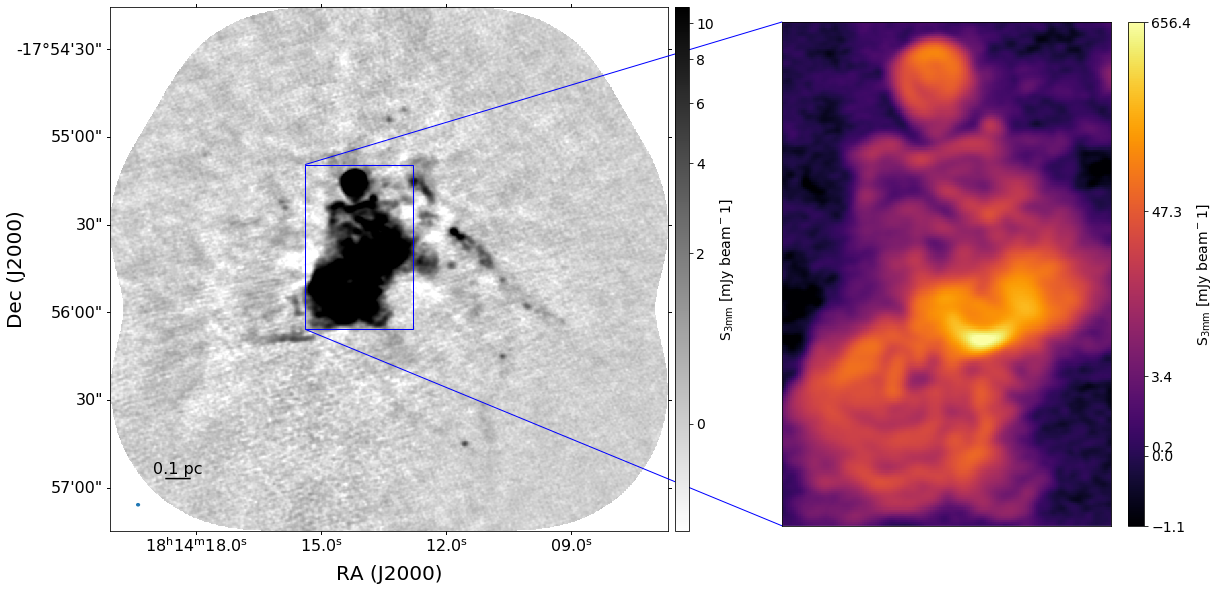
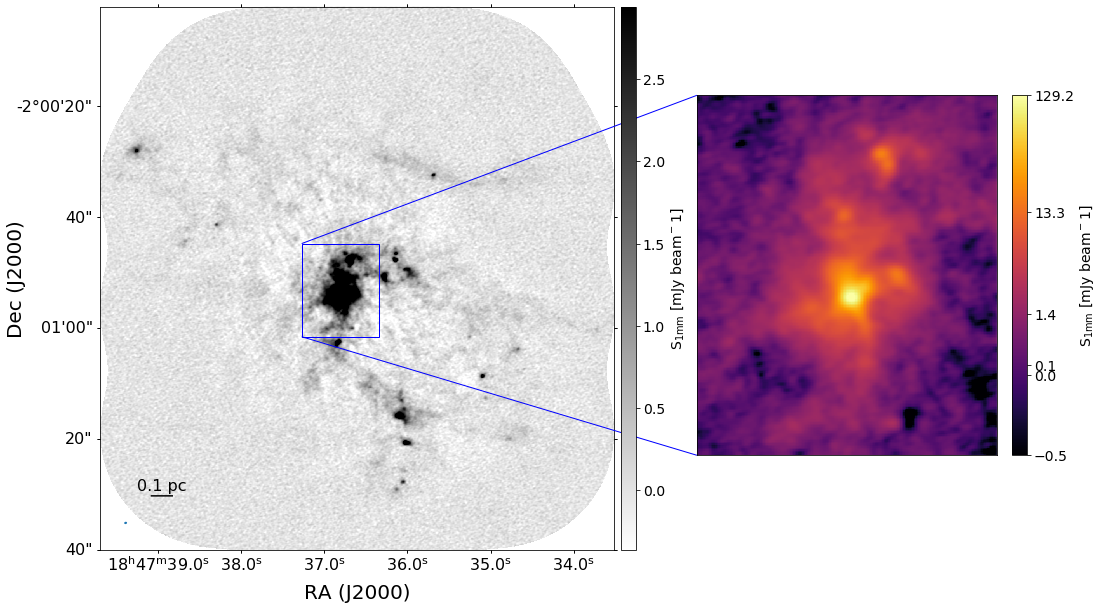
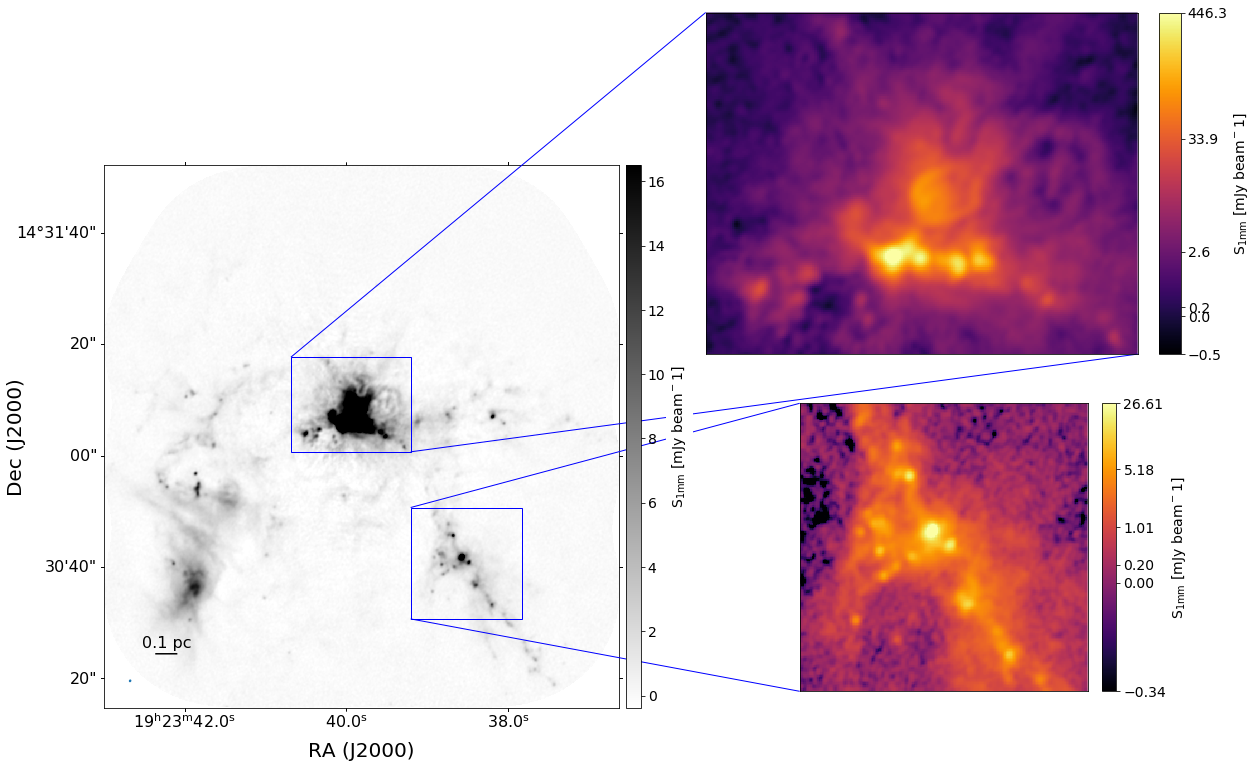
Sgr B2: the most massive & star-forming cloud in the Galaxy
Compare YSO counts in Sgr B2 and the CMC
Is there a threshold?
Is there a threshold?
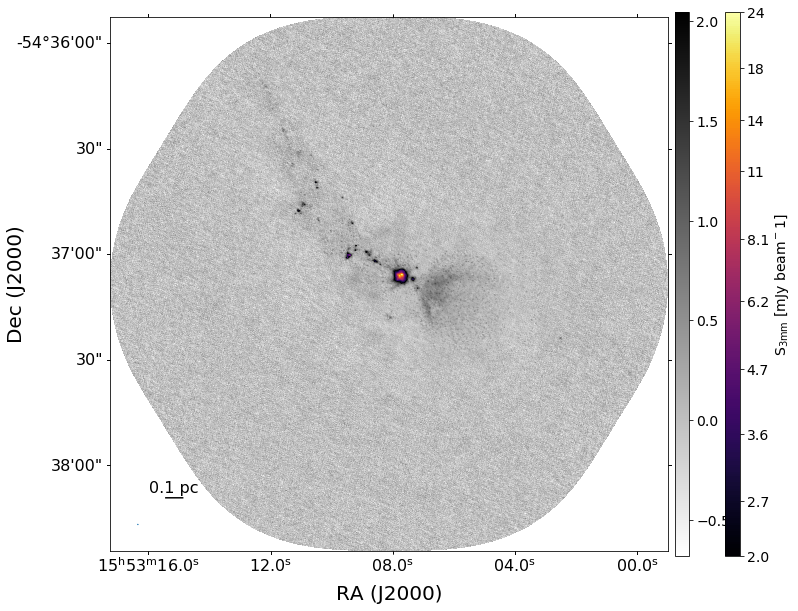
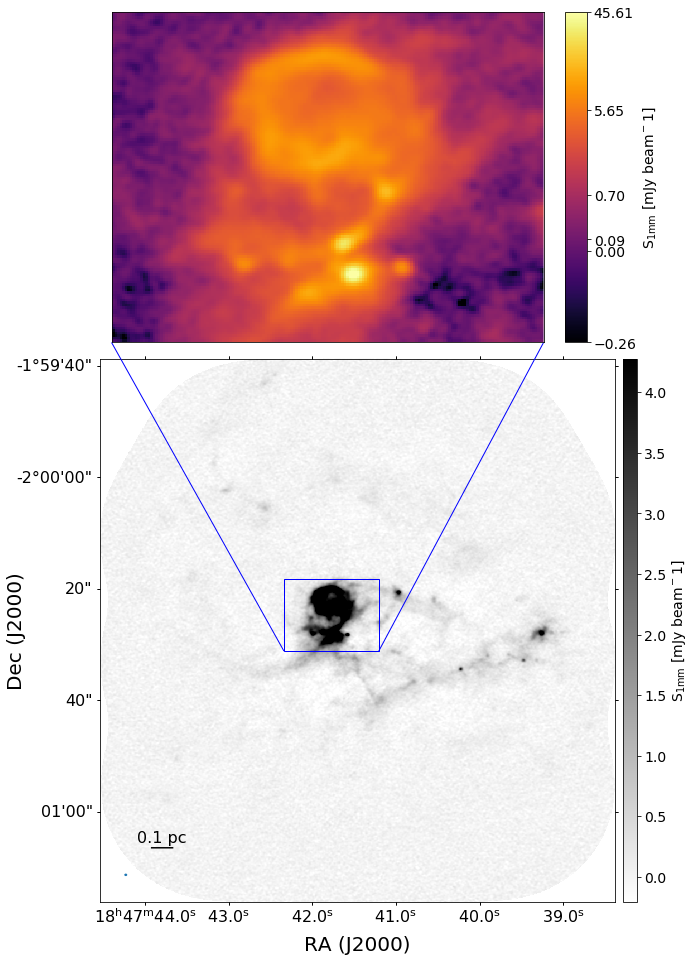
A threshold separates Sgr B2 from The Brick
Walker+ 2021
3mm Luminosity Function
What are the sources?
At this sensitivity, all are M>8⊙ YSOs
Mass measurements: Optically thin, isothermal dust
TD estimated with PPMAP fits to Herschel data
(~6" resolution)
Simple models assuming TD ~ f(M) don't change CMF much
We can do better with YSO models and TG measurements
From YSO counts to the IMF?
How do we measure the CMF if the cores all have YSOs in them?
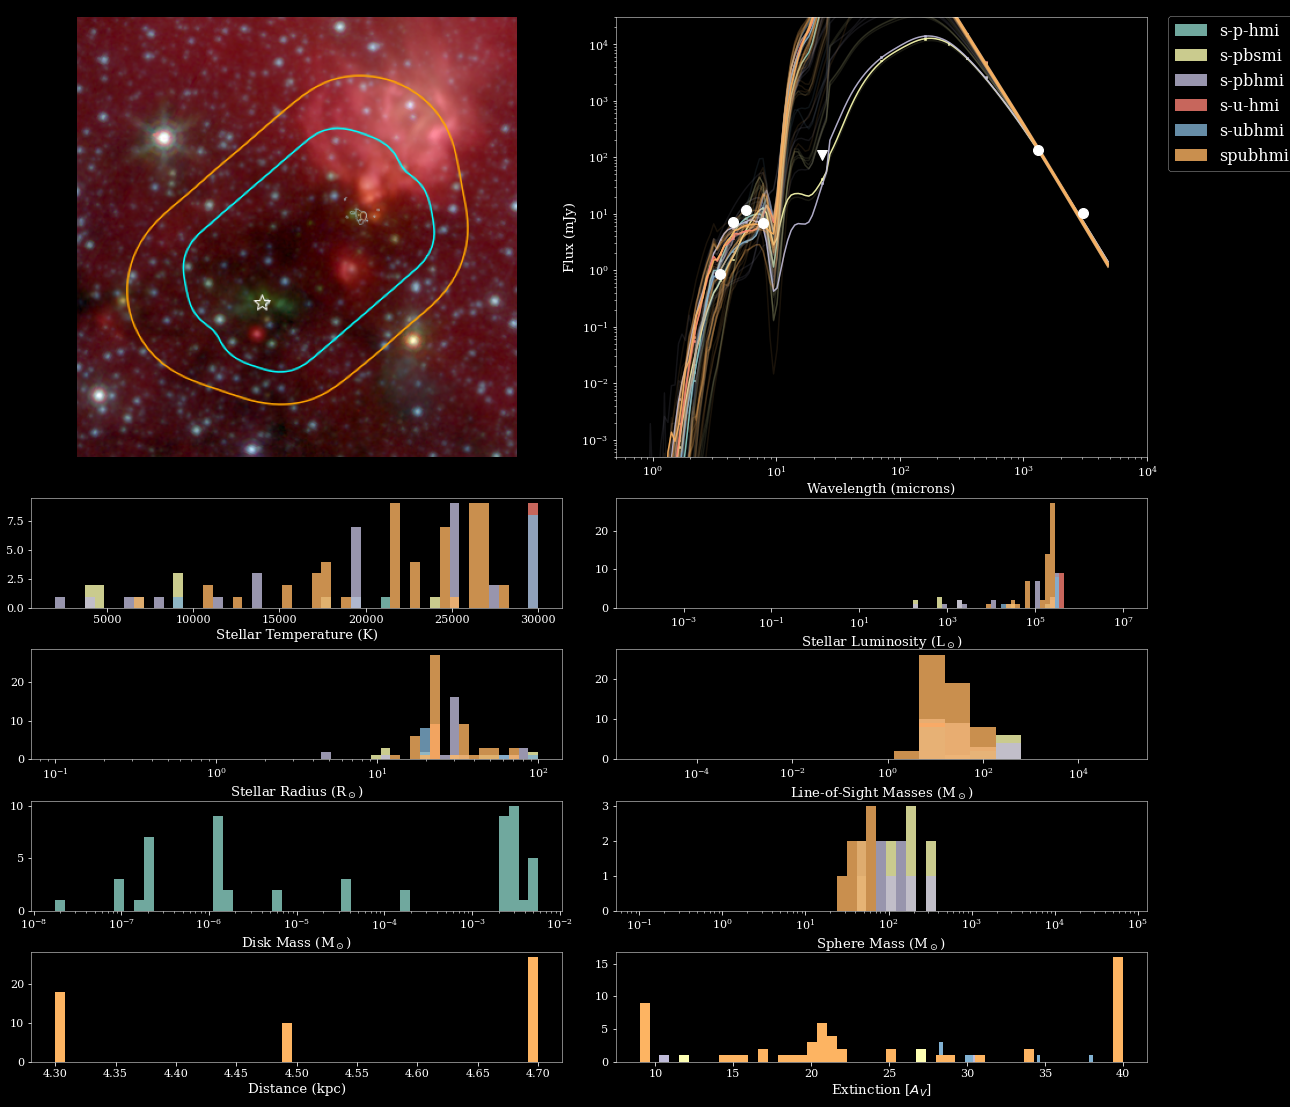
Mapping accretion histories
(left: IS, right: TC)
onto the Robitaille 2017 model grid
Key addition:
Envelope mass!
(left: IS, right: TC)
onto the Robitaille 2017 model grid
Key addition:
Envelope mass!
SPICY-ALMA-IMF:
Bonus slides past here
Hot Cores
Ices
Line Surveys
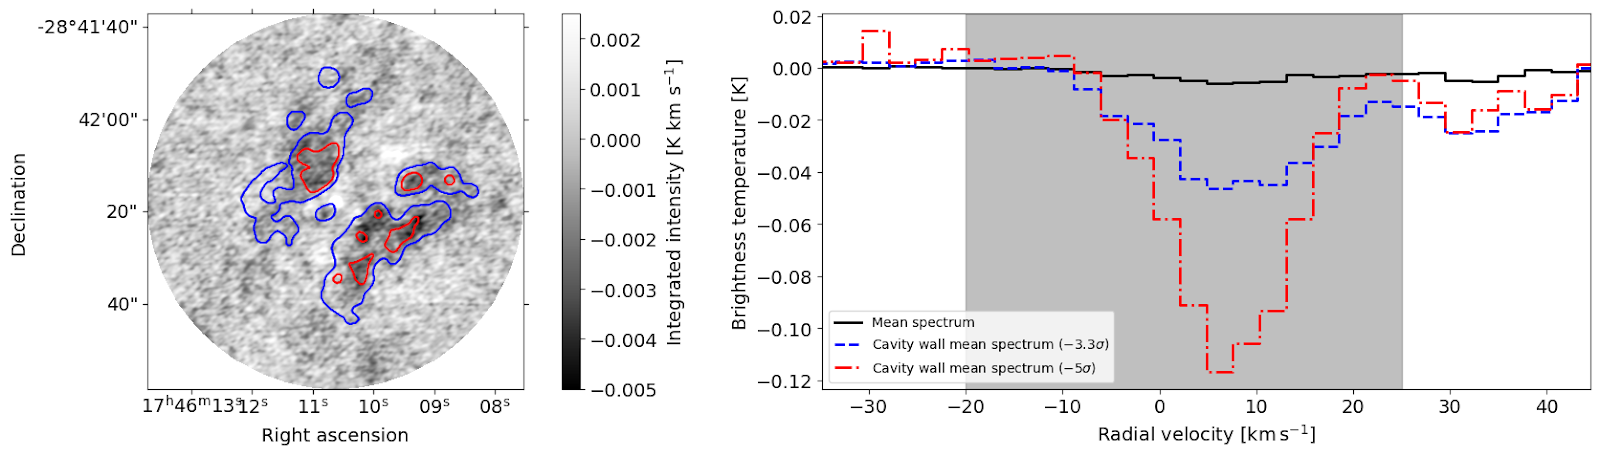
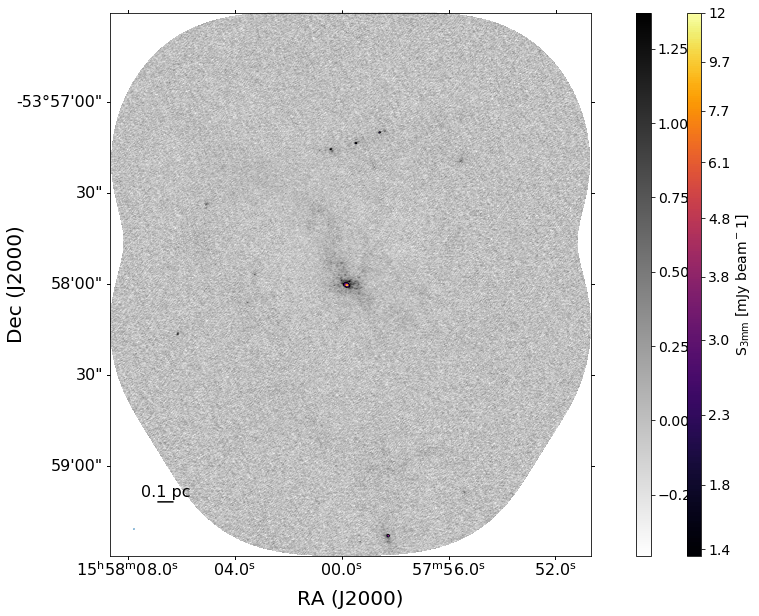
The Brick isn't forming many stars

The Brick is icy
The Brick is icy
Building new tools: Spectral Line Survey of The Brick


Richardson-enhanced Robitaille+ 2017 model grid
fits including ALMA data
UG team:
Sydney Petz
Brice Tingle
Morgan Himes

Brice Tingle
Morgan Himes

Our Galaxy's center, the CMZ, has denser gas than the Galactic average
Cold Dust
Hot, ionized gas
Hot dust/PAHs
Hot, ionized gas
Hot dust/PAHs
Final segment:
Astrochemistry:Hot Cores
Ices
Line Surveys
F187N F182M F150W
F210M F187N F182M
F212N F210M F187W
F300M F212N F210M
F360M F300M F212N
F405N F360M F300M
F410M F405N F360M
F466N F410M F300M
F466N F410M F405N
F480M F410M F360M
F480M F466N F410M
F200W F182M F115W
F212N F200W F182M
F356W F212N F200W
F410M F356W F212N
F444W F410M F356W
F466N F444W F410M
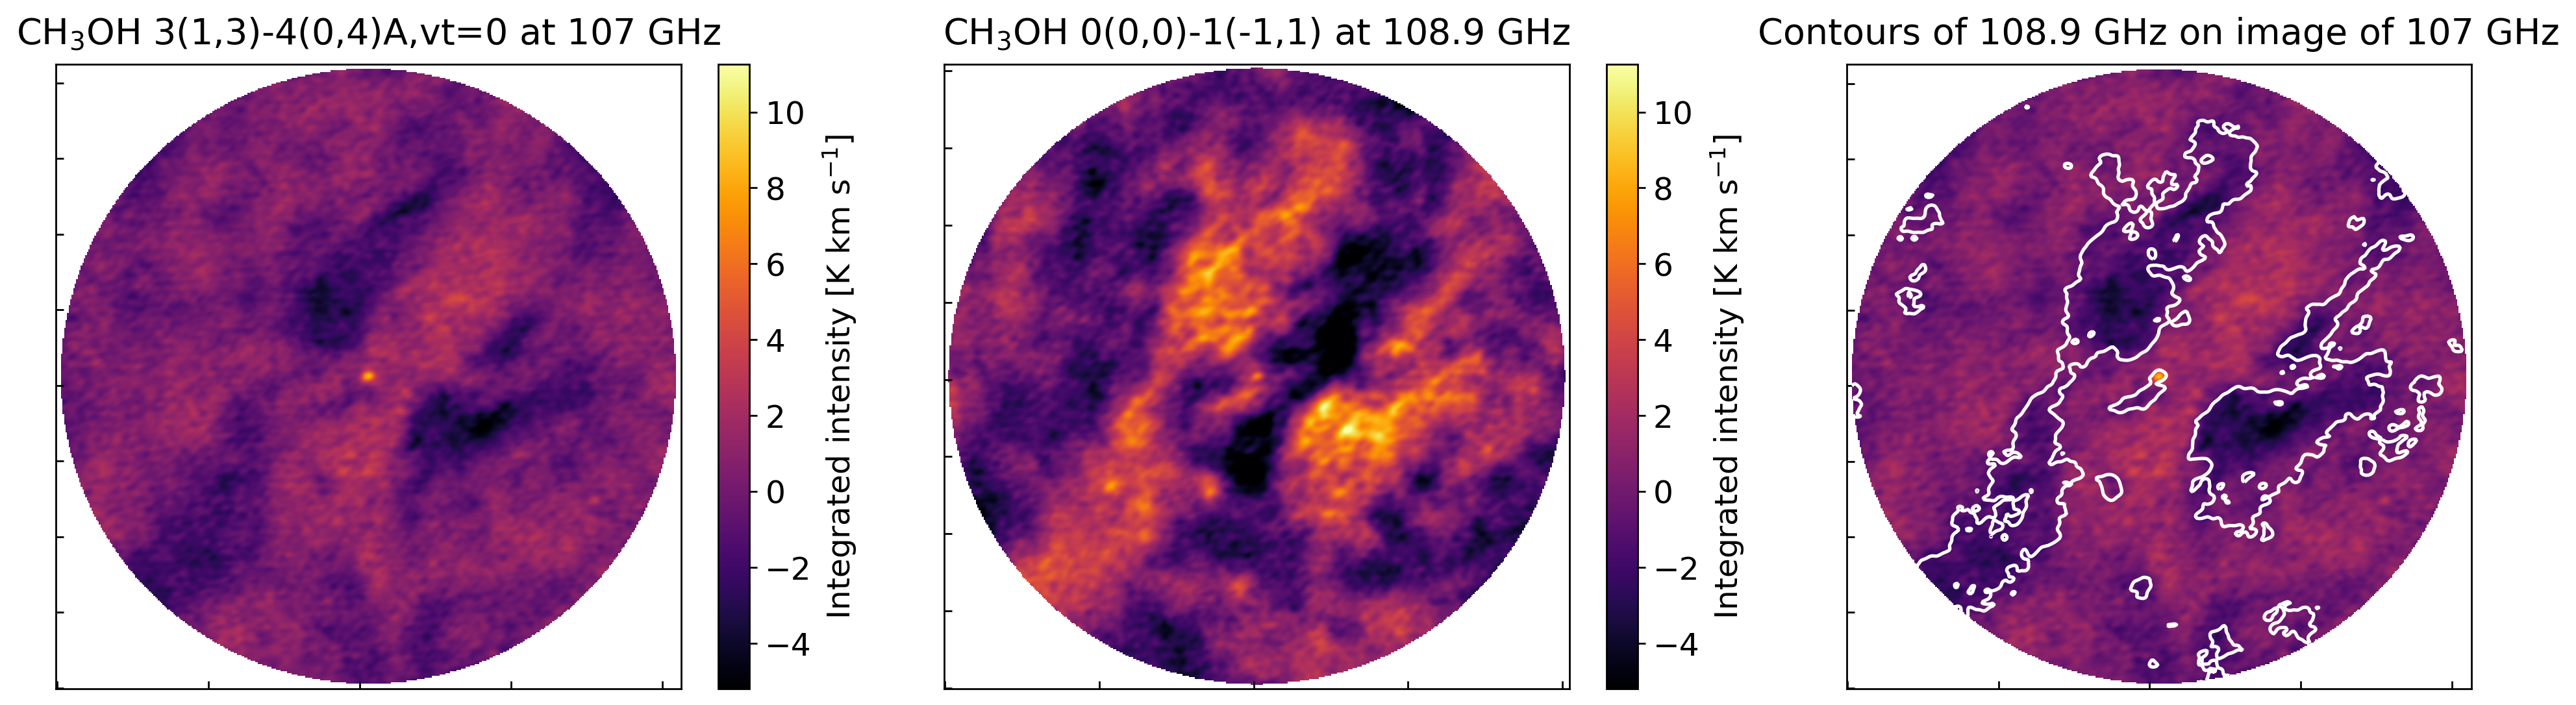
Alyssa Bulatek: Spectral Line Survey of The Brick
- Dasar line at 107 GHz
- CH3OH only in absorption
- Occurs at density $n<10^6 \mathrm{cm}^{-3}$
(me),
Desmond Jeff,
Savannah Gramze,
Theo Richardson,
Nazar Budaiev,
Alyssa Bulatek,
Taehwa Yoo,
Miriam Garcia Santa Maria
Higher CMF + top-heavy cluster IMF = top-heavy CMZ IMF
High-mass clusters (denser regions) have top-heavier IMFs
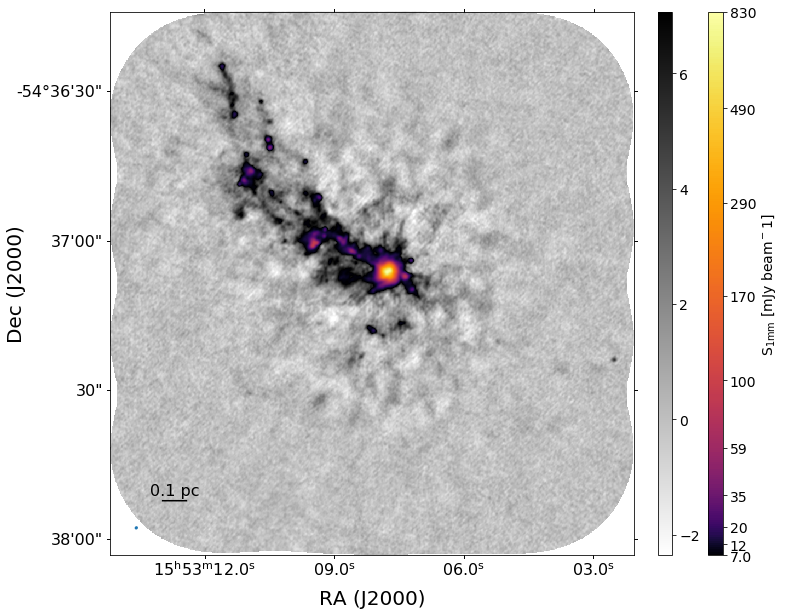
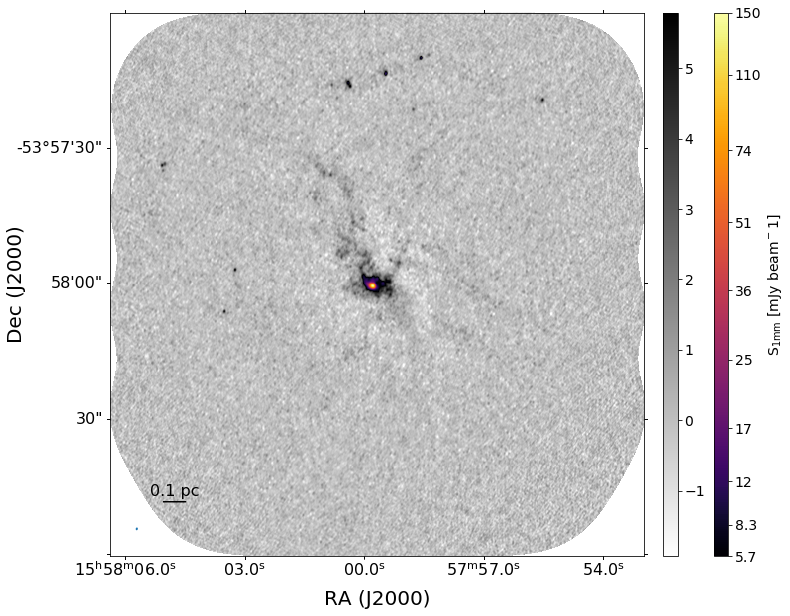
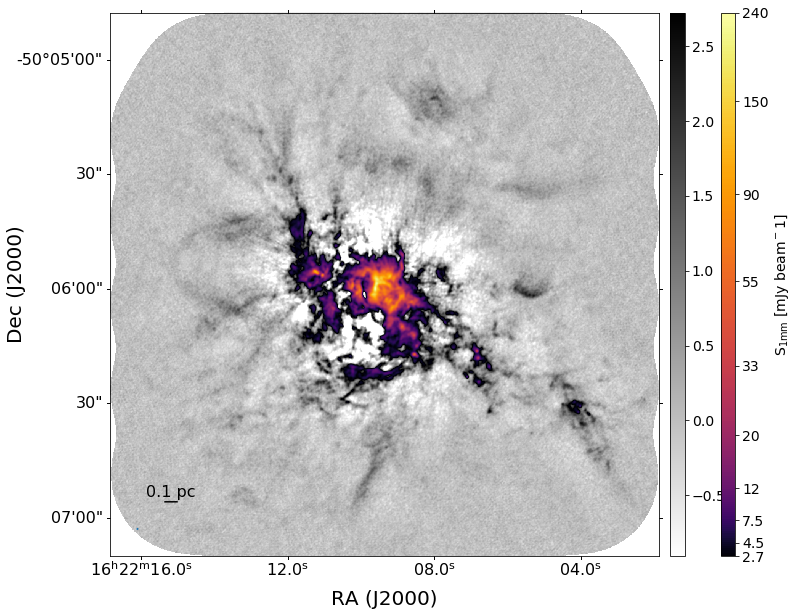
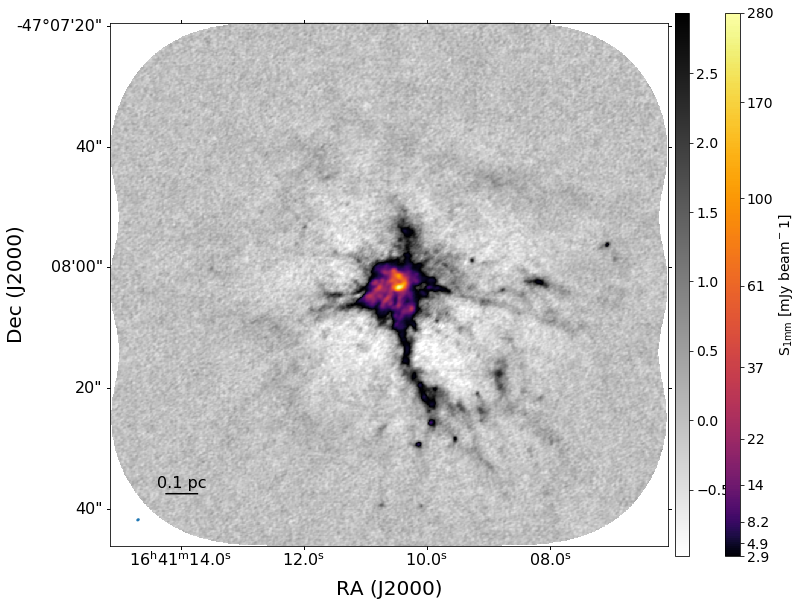
1mm Dust
[ALMA]
870 μm Dust
[APEX/ATLASGAL]
1mm Dust
[ALMA]
870 μm Dust
[APEX/ATLASGAL]
1mm Dust
[ALMA]
870 μm Dust
[APEX/ATLASGAL]
1mm Dust
[ALMA]
870 μm Dust
[APEX/ATLASGAL]
1mm Dust
[ALMA]
870 μm Dust
[APEX/ATLASGAL]
1mm Dust
[ALMA]
870 μm Dust
[APEX/ATLASGAL]
1mm Dust
[ALMA]
870 μm Dust
[APEX/ATLASGAL]
1mm Dust
[ALMA]
870 μm Dust
[APEX/ATLASGAL]
1mm Dust
[ALMA]
870 μm Dust
[APEX/ATLASGAL]
1mm Dust
[ALMA]
870 μm Dust
[APEX/ATLASGAL]
1mm Dust
[ALMA]
870 μm Dust
[APEX/ATLASGAL]
1mm Dust
[ALMA]
870 μm Dust
[APEX/ATLASGAL]
1mm Dust
[ALMA]
870 μm Dust
[APEX/ATLASGAL]
1mm Dust
[ALMA]
870 μm Dust
[APEX/ATLASGAL]
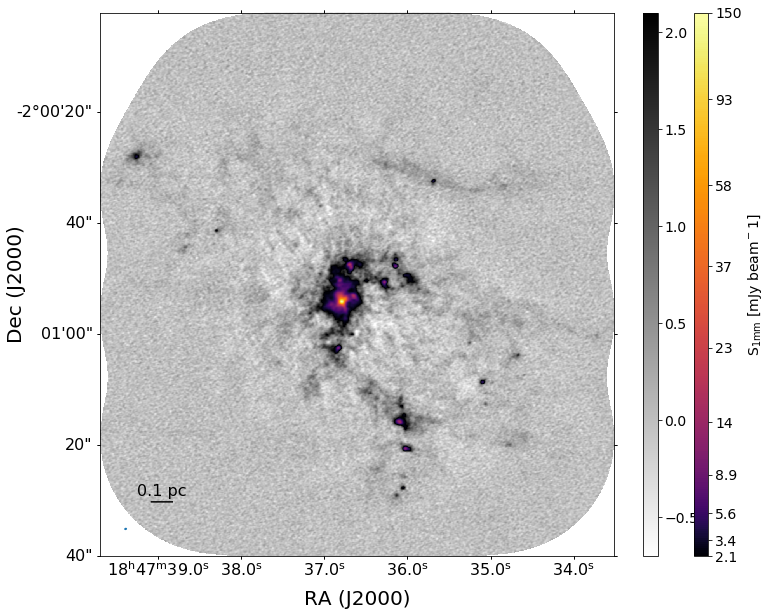
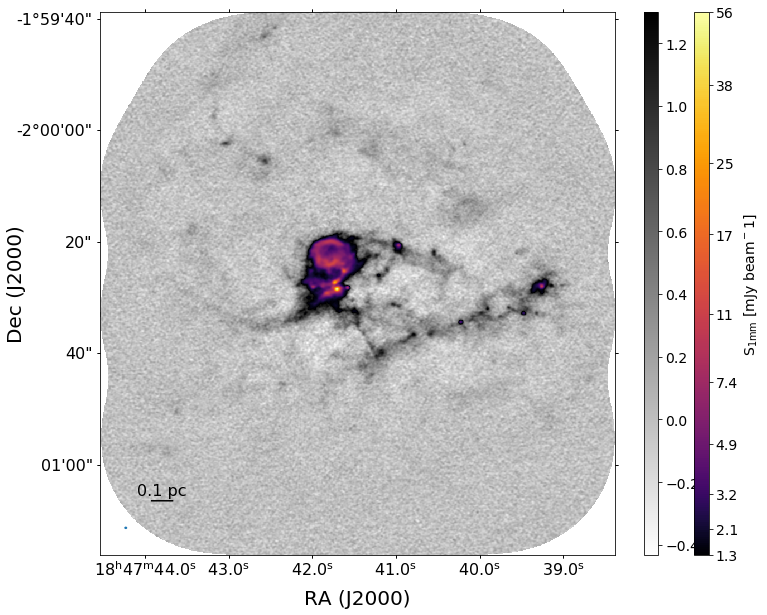
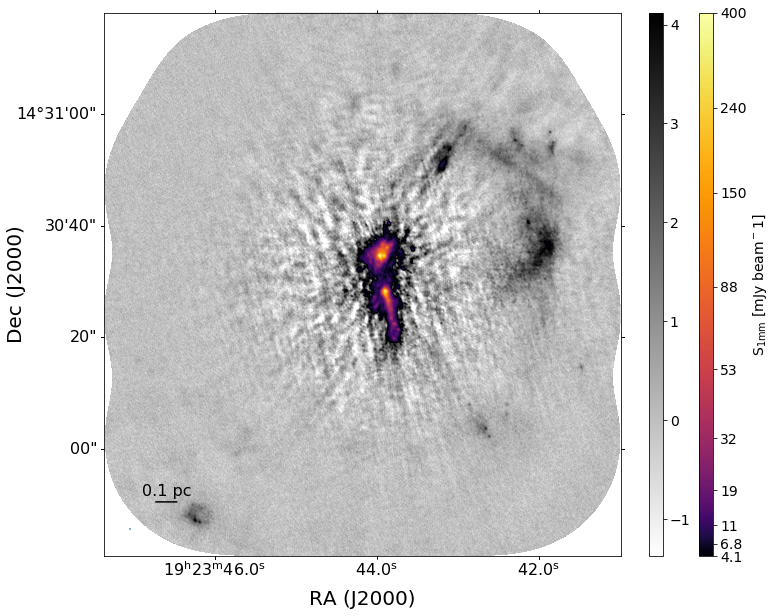
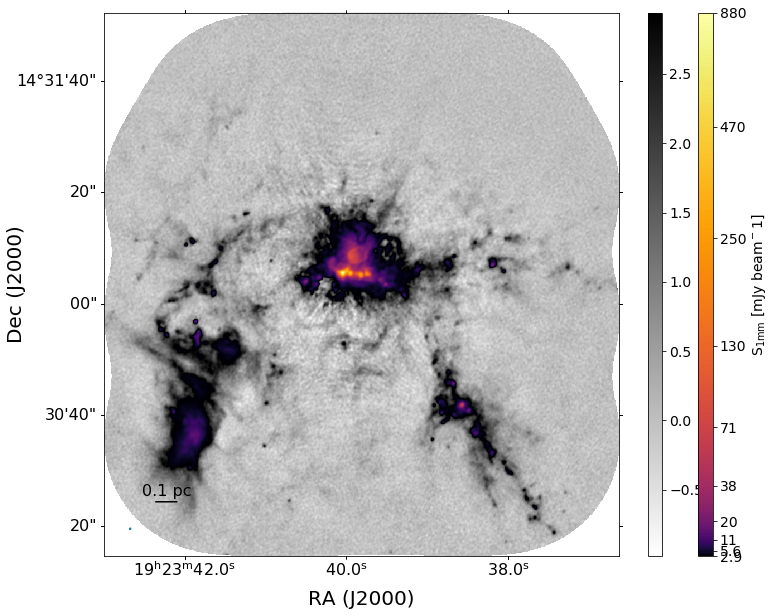
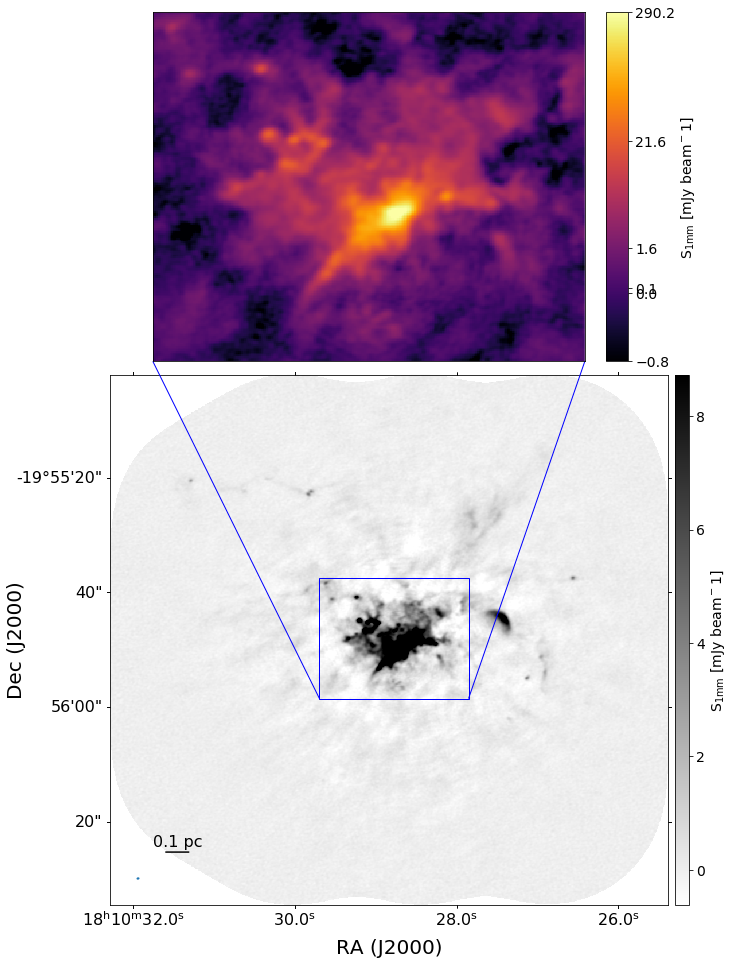
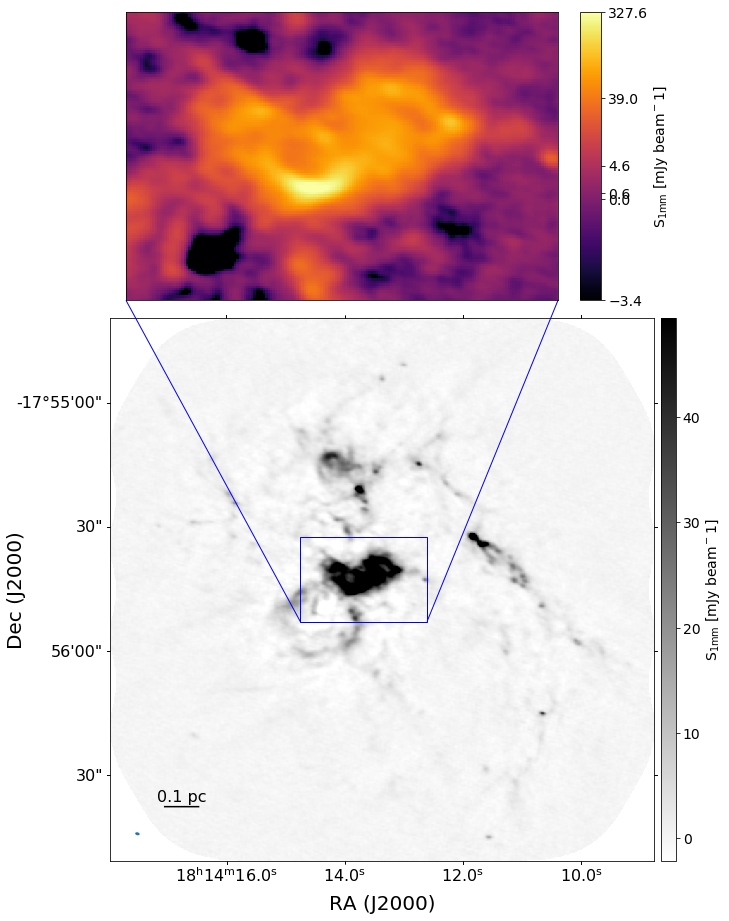
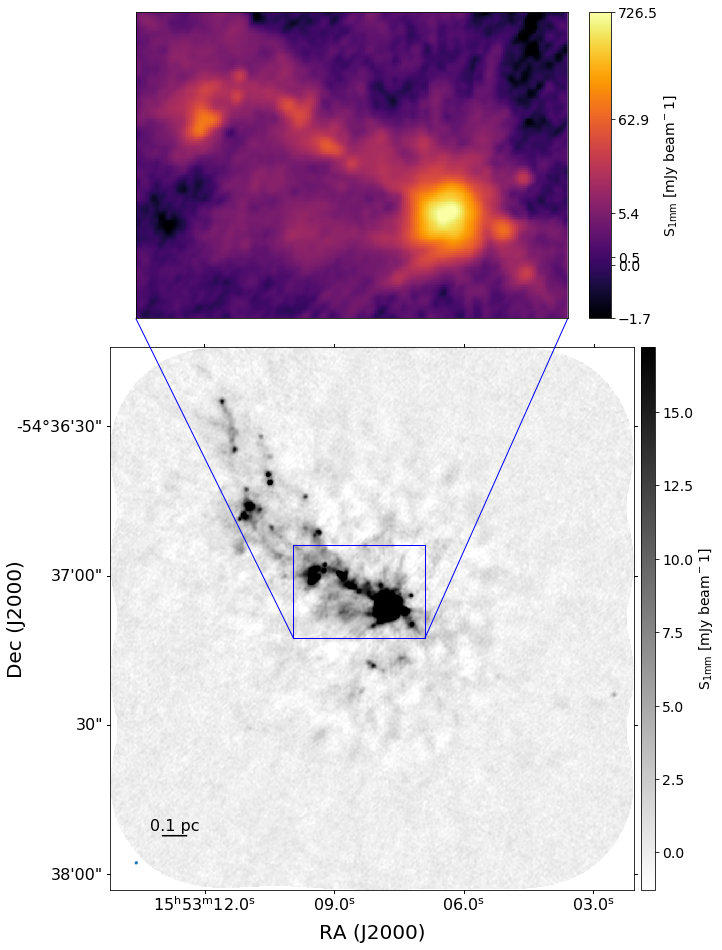
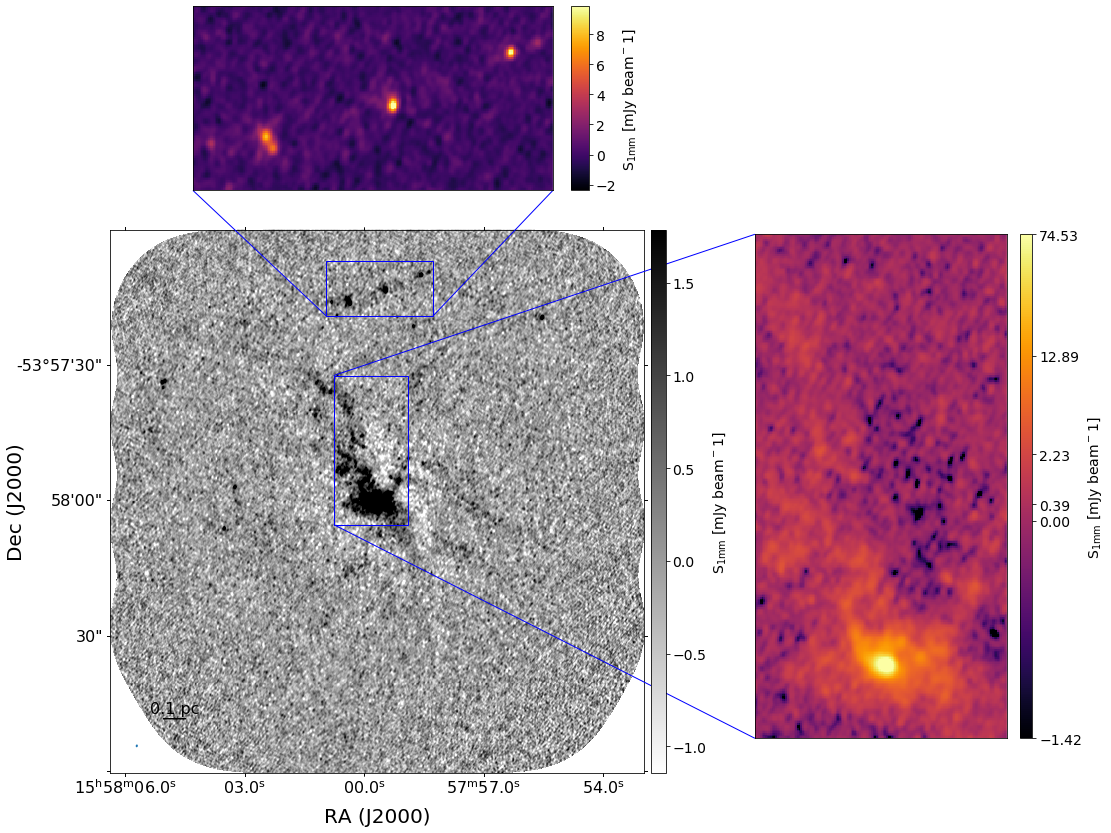
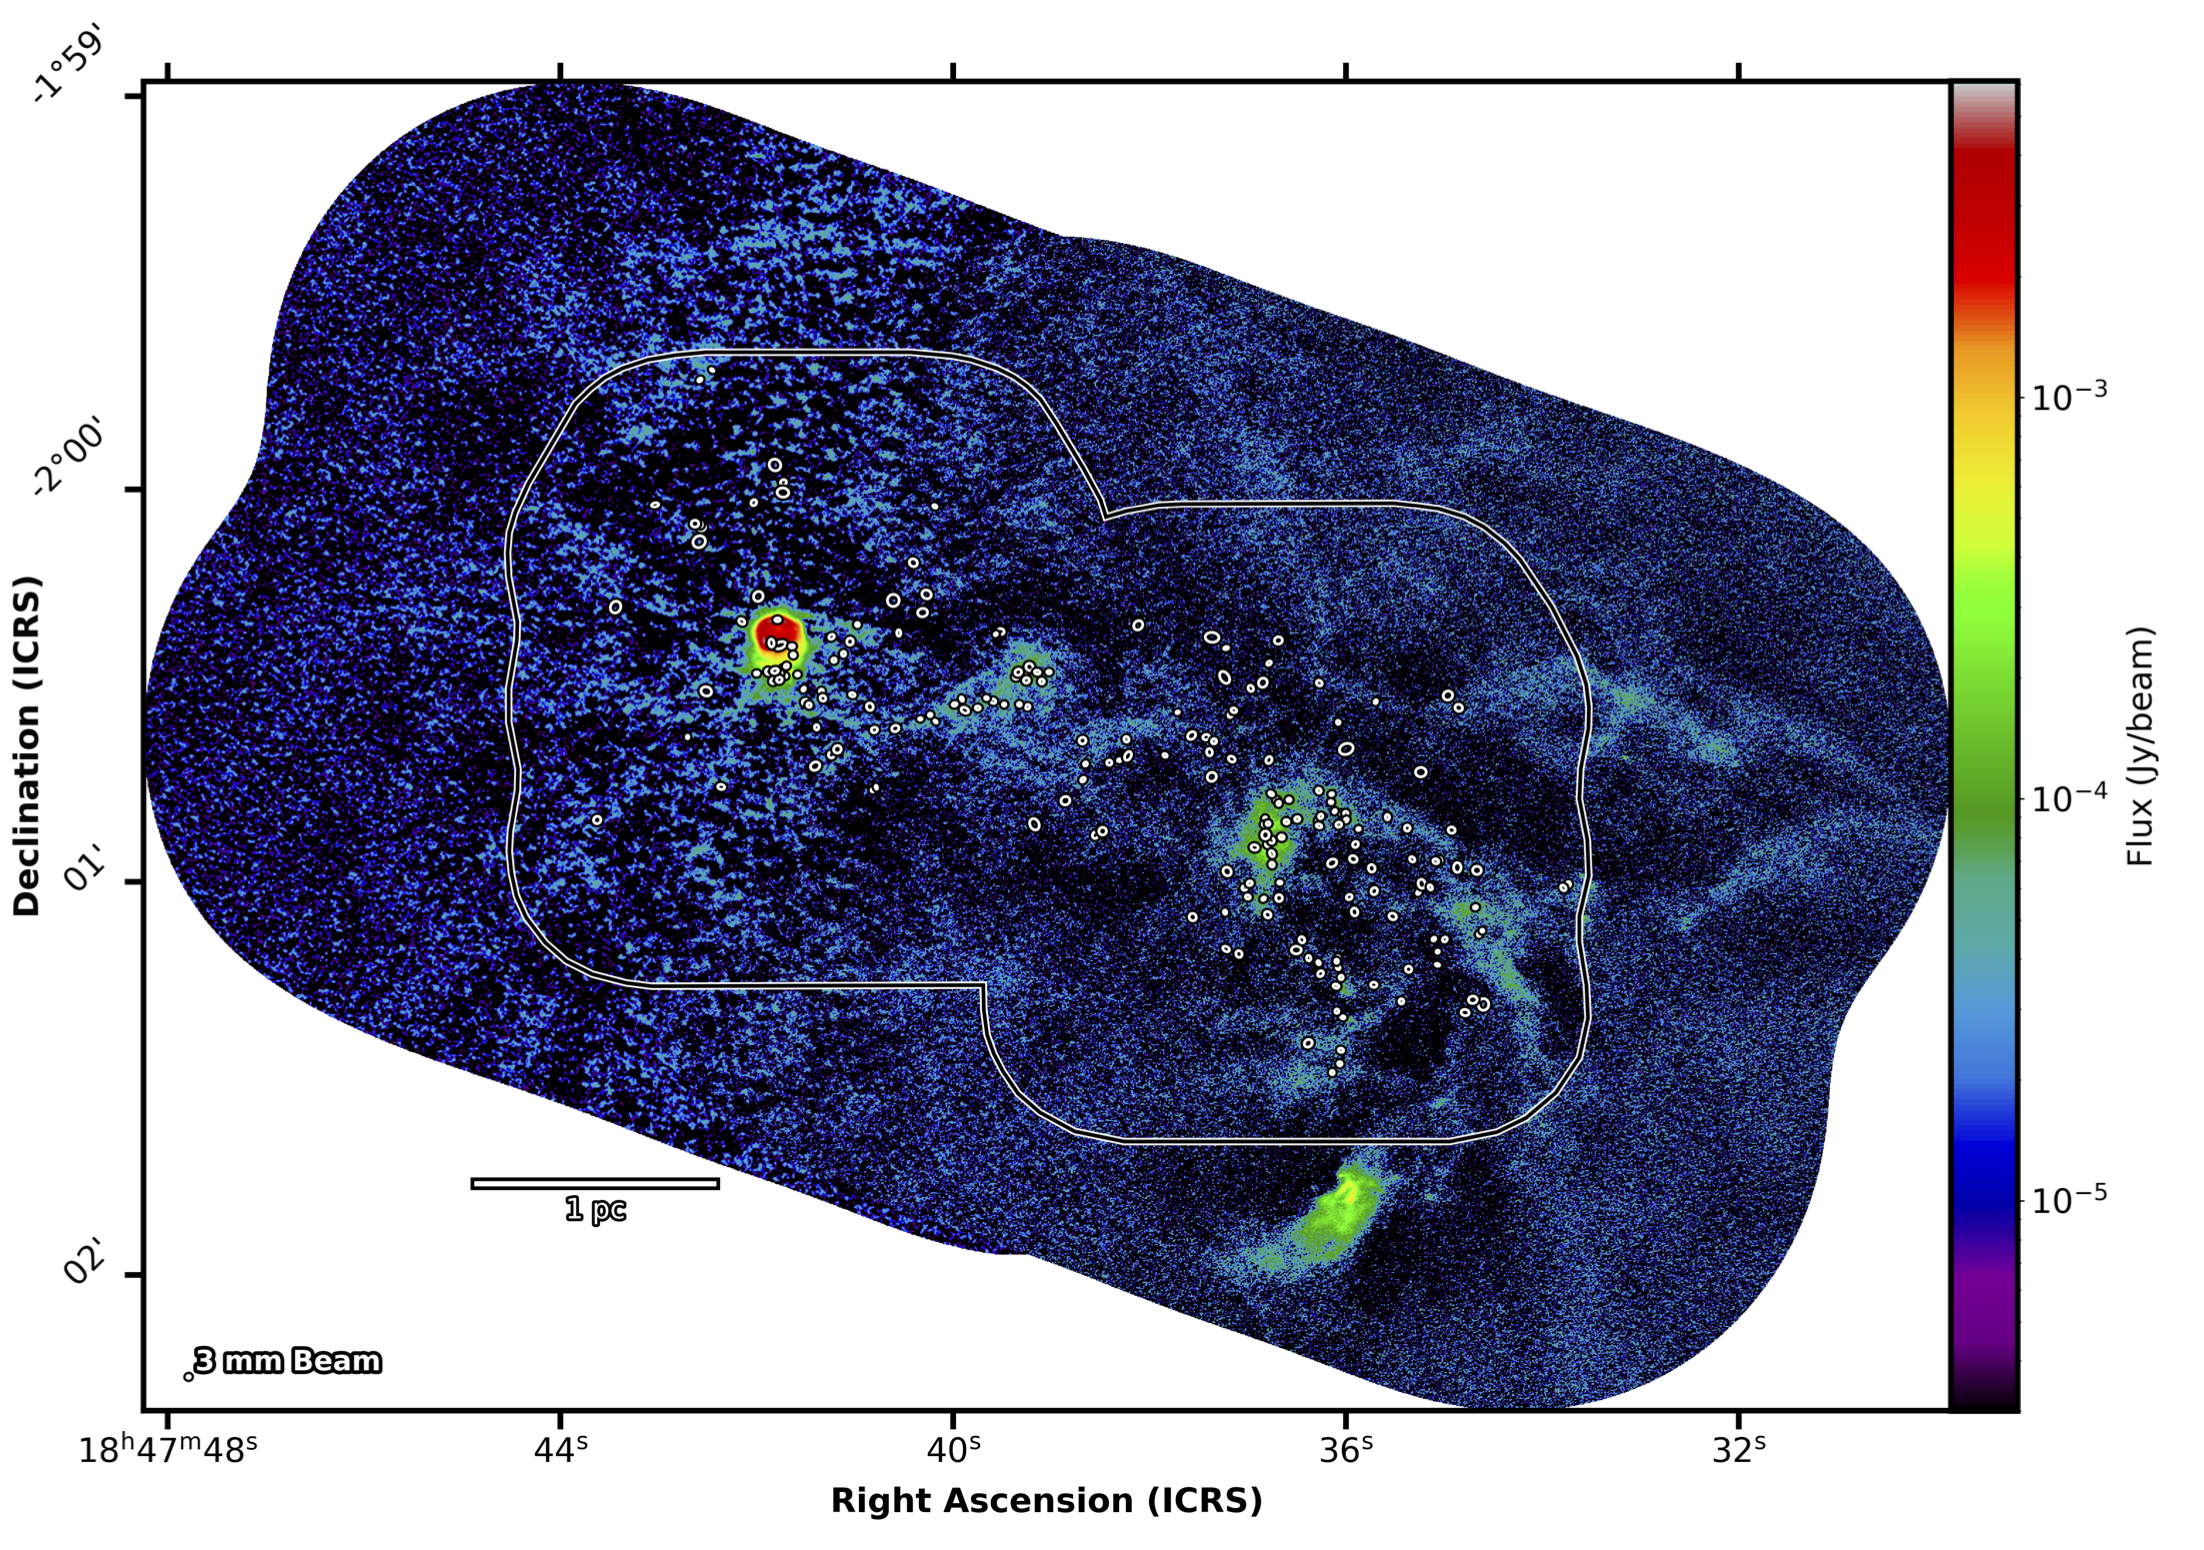
ALMA-IMF data highlights
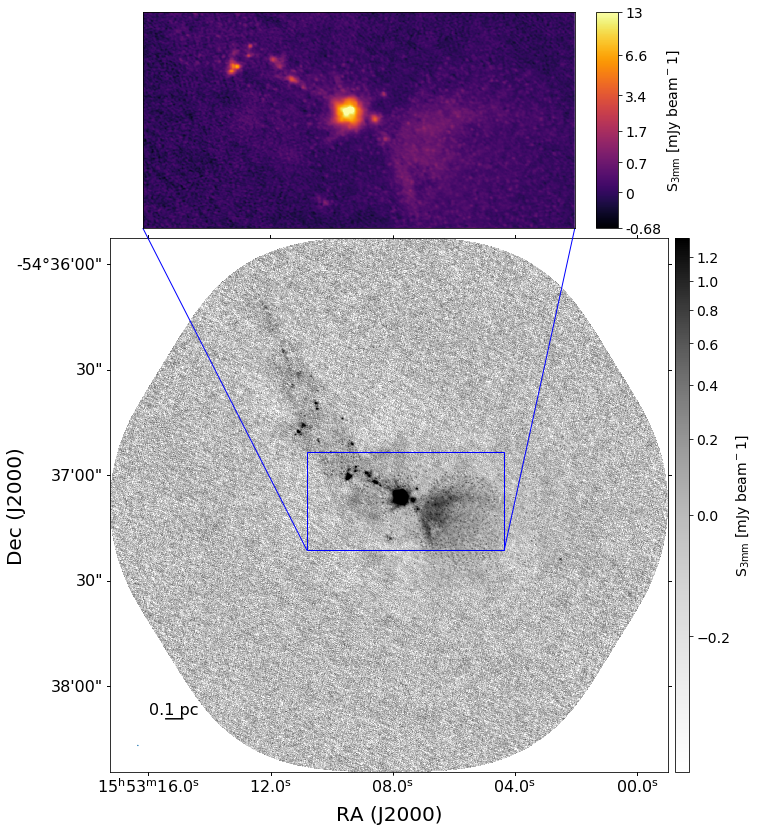
Gas flows in N2H+ filaments (Álvarez-Gutiérrez+ 2024)
Collapse is slower on larger scales, but fast enough to matter.
ALMA-IMF: Continuum Data → core catalogs
Pouteau+ 2022 W43-MM2/3
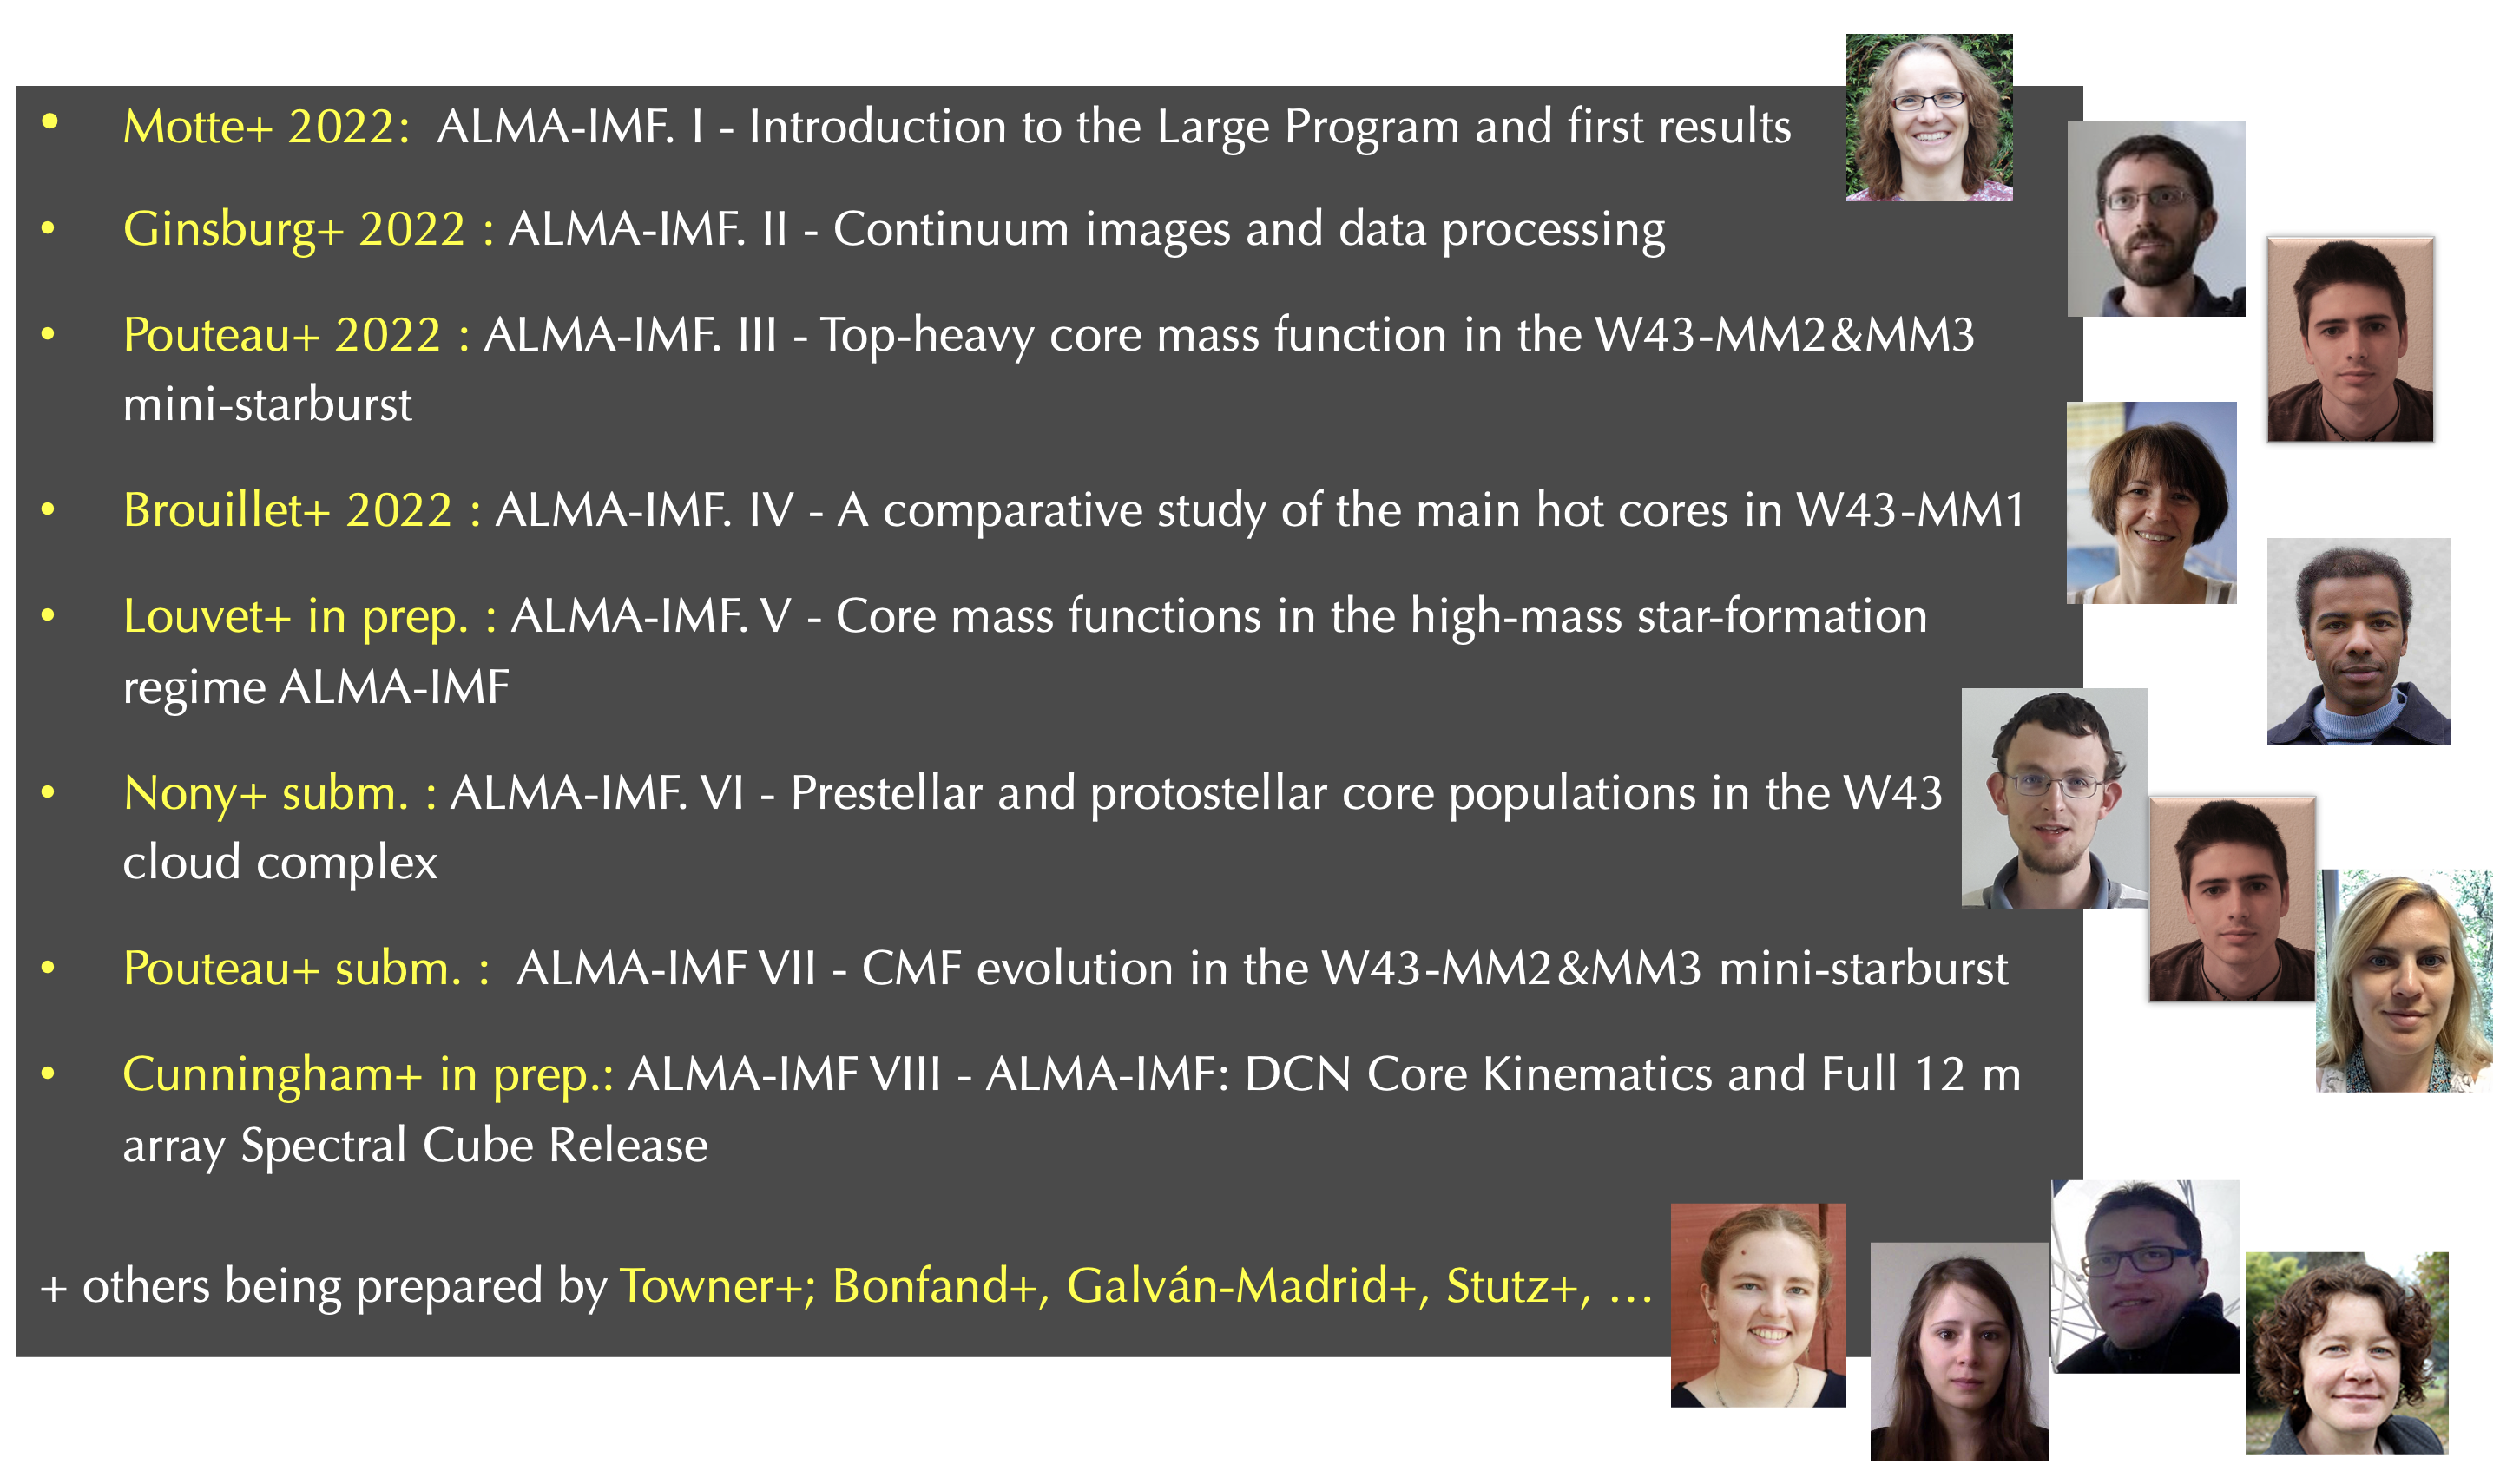 (these papers are all now submitted or accepted, but this is a screenshot that includes everyone's photos...)
So how do high-mass stars form?
Is HMSF different from LMSF?
ALMA-IMF: CMF measurement & YSO counting
- Continuum data paper
- Survey overview (Motte+ 2022)
- Cores in W43 (Nony+ 2023)
- Shallow CMF in W43-MM2/3 (Pouteau+ 2022),
evolution (Pouteau+ 2023)
- CMF slope α ≲ 1
- 8 Hot Cores in W43 (Brouillet+ 2022) & ~60 more (Bonfand+ 2024)
- Line Data paper (Cunningham+ 2023)
- Single-dish combination (Díaz-González+ 2023)
- SiO Outflow catalog (Towner+ 2023)
- 320 SiO outflows cataloged
- Catalog paper (Louvet+ 2024)
- ~1000 cores cataloged, CMF steeper than IMF
- Gas infall kinematics (Álvarez-Gutiérrez+ 2024), Garrido+, Koley+ in prep
- Dust temperature / column maps with PPMAP (Dell Ova+ 2024)
- H41α estimates of free-free emission (Galván-Madrid+ 2024)
(these papers are all now submitted or accepted, but this is a screenshot that includes everyone's photos...)
Is HMSF different from LMSF?
Yes! They have more neighbors.