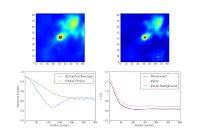
I've started looking at PPS fields to see if I can glean any additional information about the "flux discrepancy" from them. However, the results are, as usual, unenlightening. There is no consistent increase in flux when 3 PCA components are used instead of 13 PCA components - very plausibly an indication that 13 PCA is not too much to subtract because it's only atmosphere. Similarly, there is no obvious benefit to using a quadratic sky estimator instead of a PCA estimator. I'm using aperture photometry (without background subtraction) on identical fields to perform these comparisons. I've selected (arbitrarily) the l357pps source as my comparison source. The next step (ongoing) is to compare to the co-added maps and crosshatched large-scale maps of the same field. (next step) PPS < single cross-hatched large-scale observation pair < 13PCA full combined map < 3PCA full combined map. Unfortunately, this result implies that the small maps under-recover flux, which suggests that the large maps are too bright, which is the opposite of what we expect. Additionally, lower noise -> more flux recovered? When background subtraction is included, the 3PCA and 13PCA fluxes match nearly perfectly. Despite the failure of this test (PPS < full field), I will do a systematic comparison of PPS sources with 0PCA + masking to the large fields in the hopes that doing so can provide a legitimate estimate of the "scale factor" from treating small and large fields differently.
Articles in the bgps category
BGPS Pipeline Published
The BGPS pipeline has officially been released on Google Code.
Aperture Photometry on Herschel-based simulation


Aperture Photometry on isolated and not-so-isolated sources in the Herschel-based BGPS simulation using the L=111 field for the "noise". Depending on the aperture, our flux recovery can be really really low. The images should give an idea of the S/N. Background subtraction means subtracting the median of the image.... it works frighteningly well in most cases.
Pipeline Flowcharts
In the process of hunting down a supposed calibration error, I determined that it was necessary to generate a more intuitive graphical display of the pipeline. Hence, pipeline flowcharts (generated in keynote). The key should be self-explanatory to the degree that any part of these charts is understandable to an outsider. The yellow boxes represent wrapper scripts/functions while the rounded box bubbles show individual functions within these wrappers and their interrelationship.


Minor mystery resolved: Perseus cal curve
When I started working on the Perseus data again, I decided to use the Enoch 2006 calibration curve directly. However, it has a very different form than all other epochs. The reason, as revealed below, is that it was not forced through 0,0. Additionally, all of the BGPS data was observed with mean DC ~ 2-3 V, while the Perseus data was observed with mean DC 4-5 V, so the relevant regime is in a very different location. The reference DC bias was much lower, ~2.15 V vs. 4.6 V in the 2005-2007 BGPS and 2.6 V in the 2009 BGPS.

Minor mystery solved
RELEASE
Finally. http://irsa.ipac.caltech.edu/
Eimers project
Project for Marc Eimers: Determine velocities to molecular clouds by a variety of methods. Start with l=30 1. Find archival data, particularly from the JCMT, for each core. 2. Compare morphologically to 13CO from GRS 3. Find Vizier data
locating beams

White - "Default", OP-calculated beam-locations Red - My code's beam locations Yellow - Boloparams, the fiducial beam locations
Gem OB1 comparisons
I'm running 0,1,2,3,5,7,10,16, and 19 PCA component 51 iteration maps of Gem OB1 with deconvolution. No clue when they'll be done because they're at the end of a long queue. Next (important!) step is to re-run the simulations with linear source sizes but with different numbers of PCA components, different kernel sizes, etc..... there is a LOT of parameter space to cover.