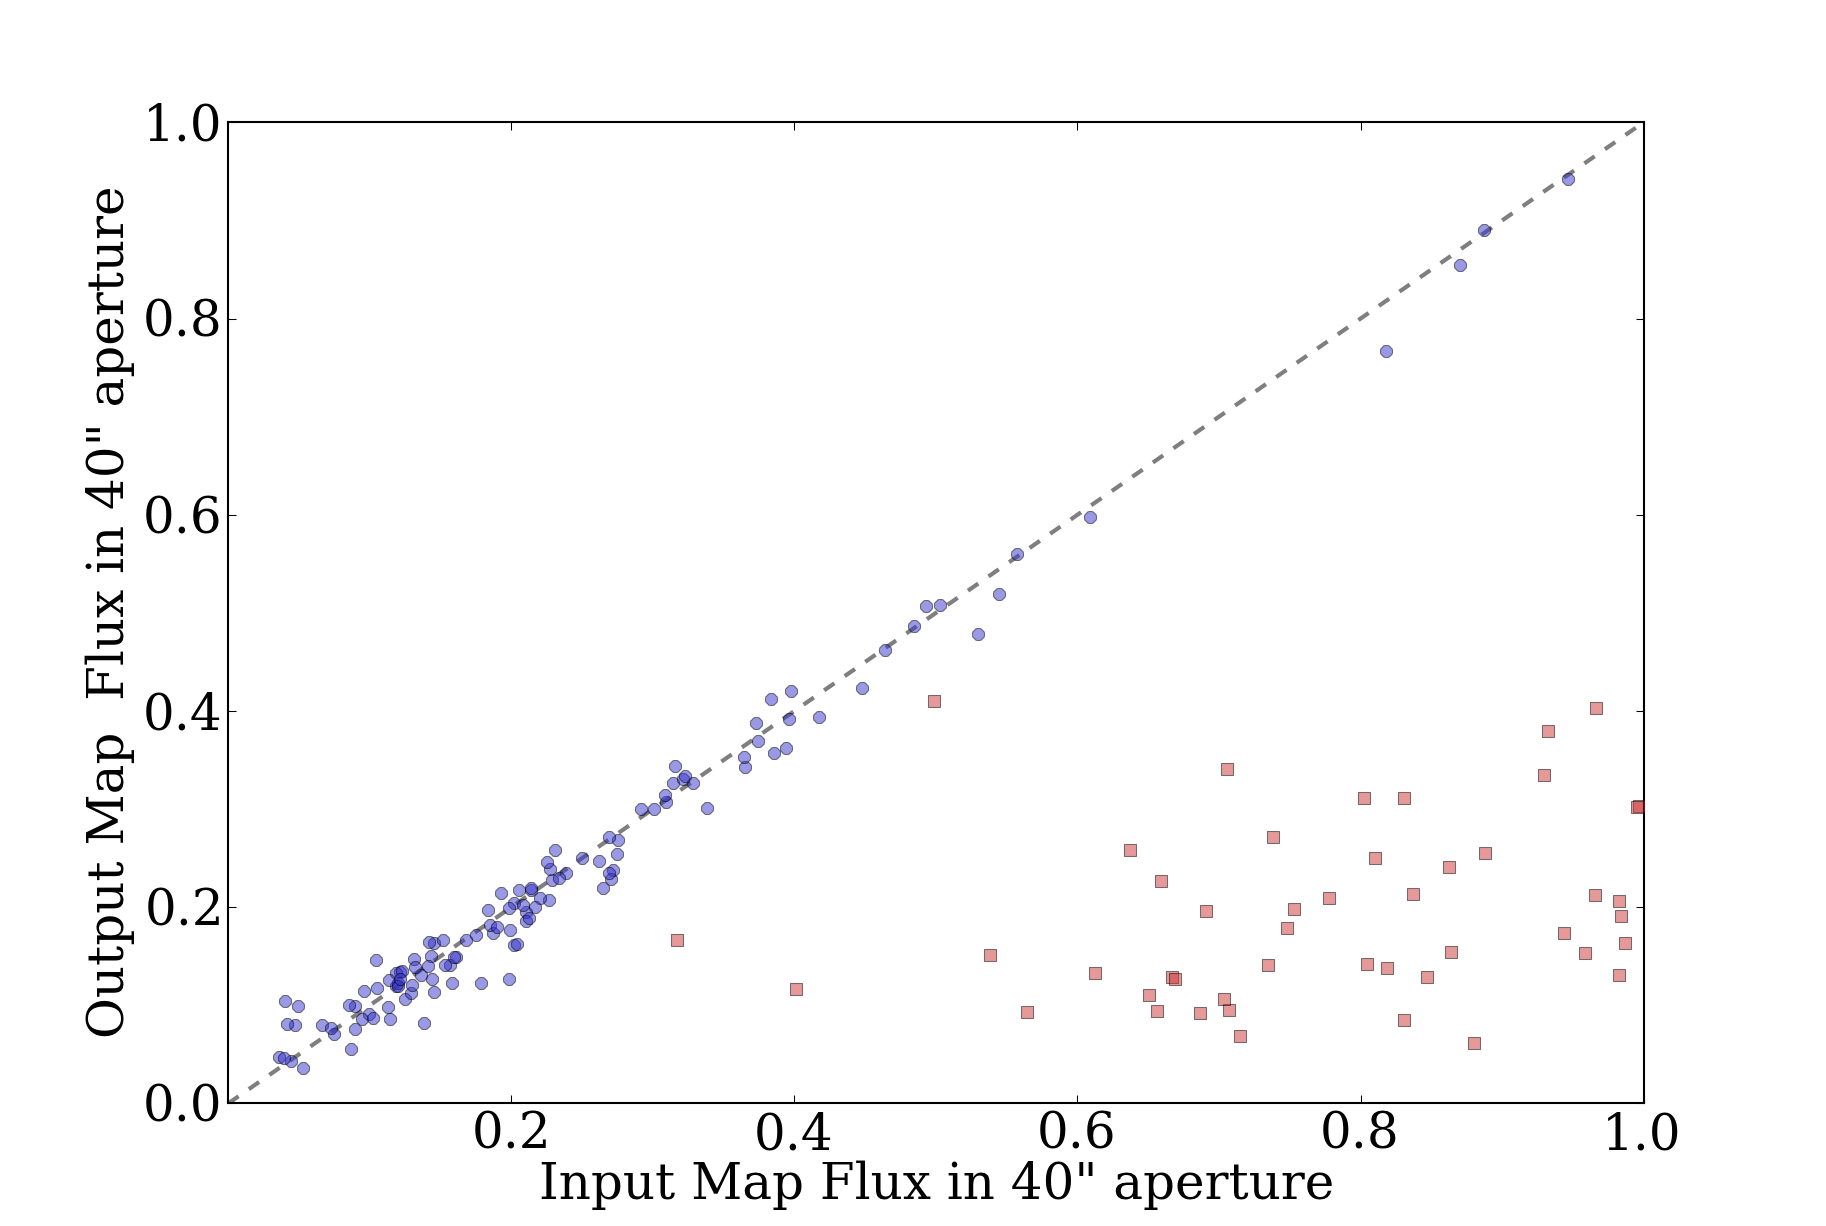
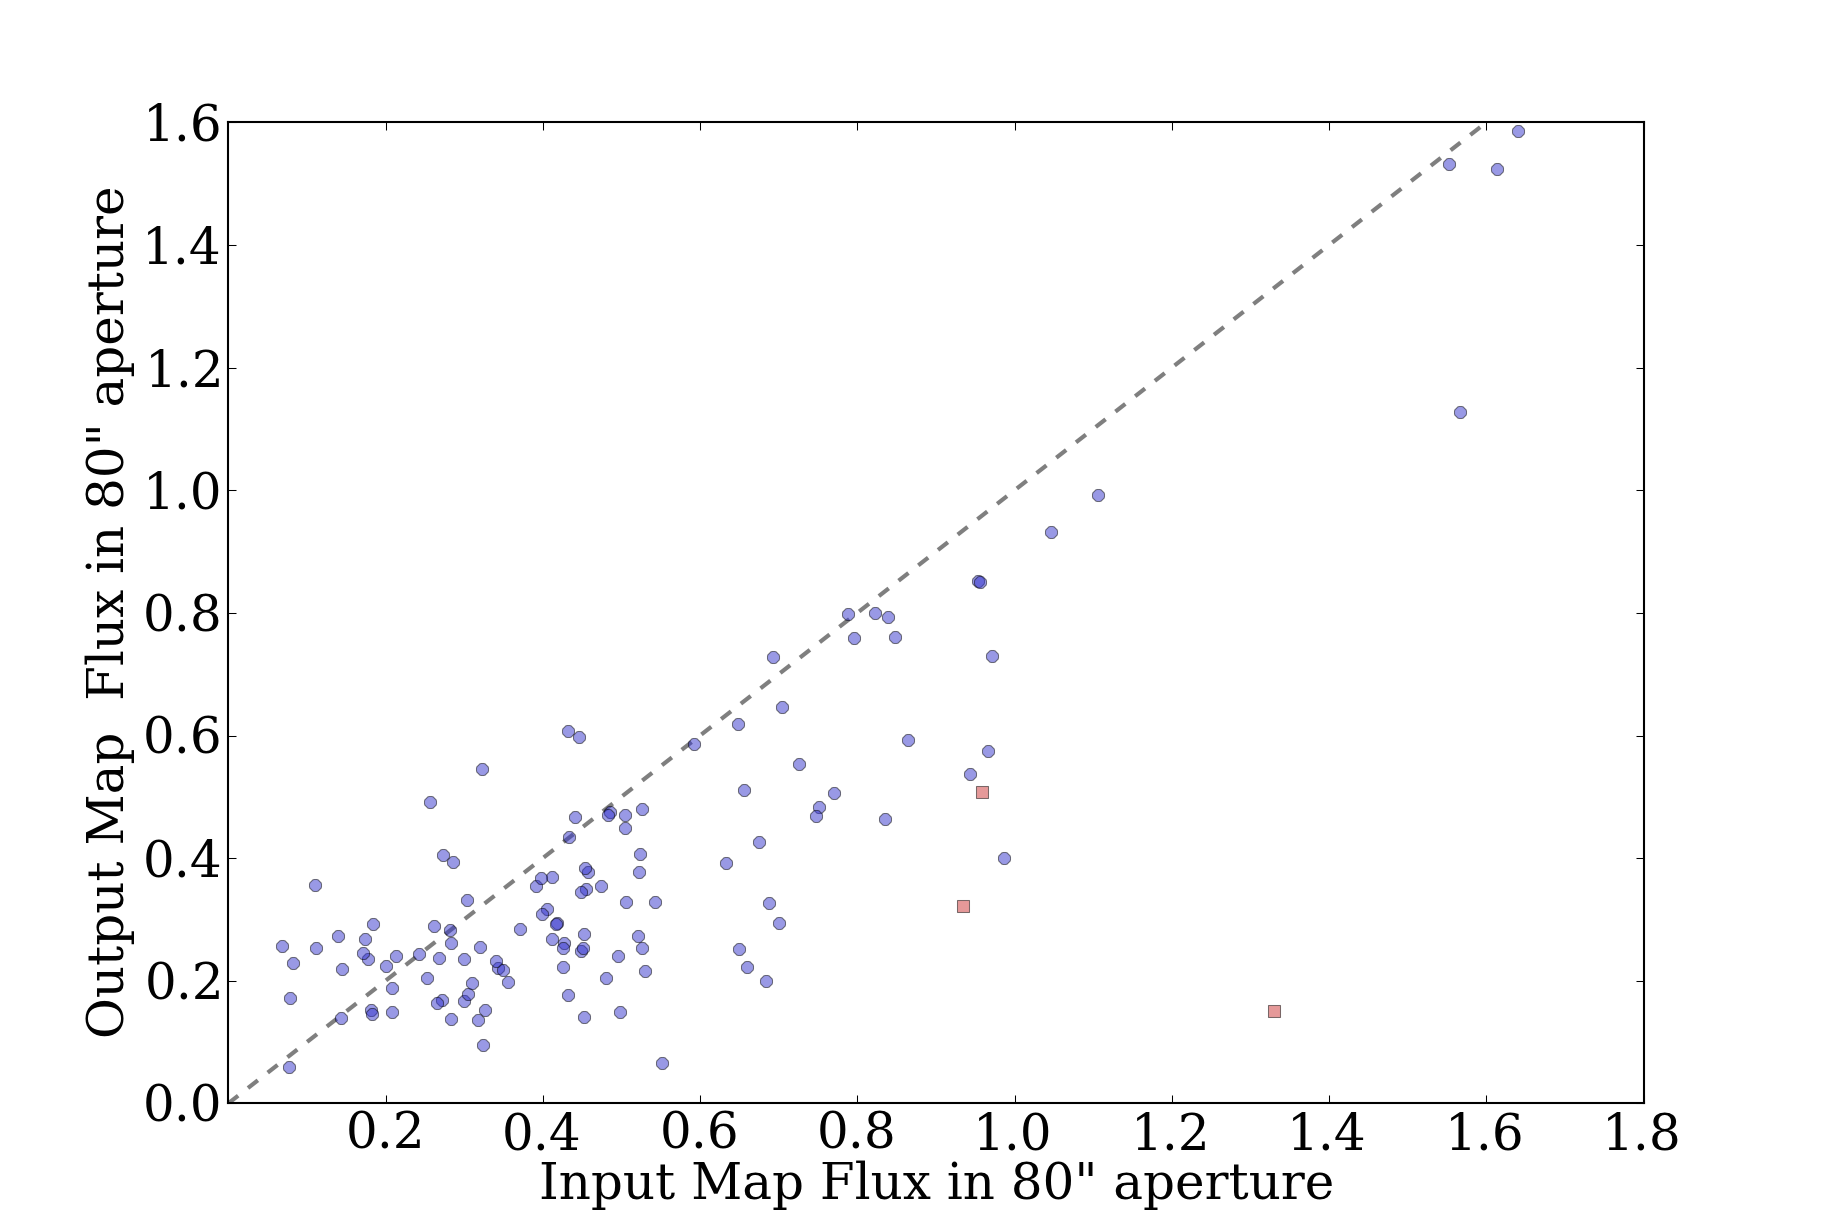
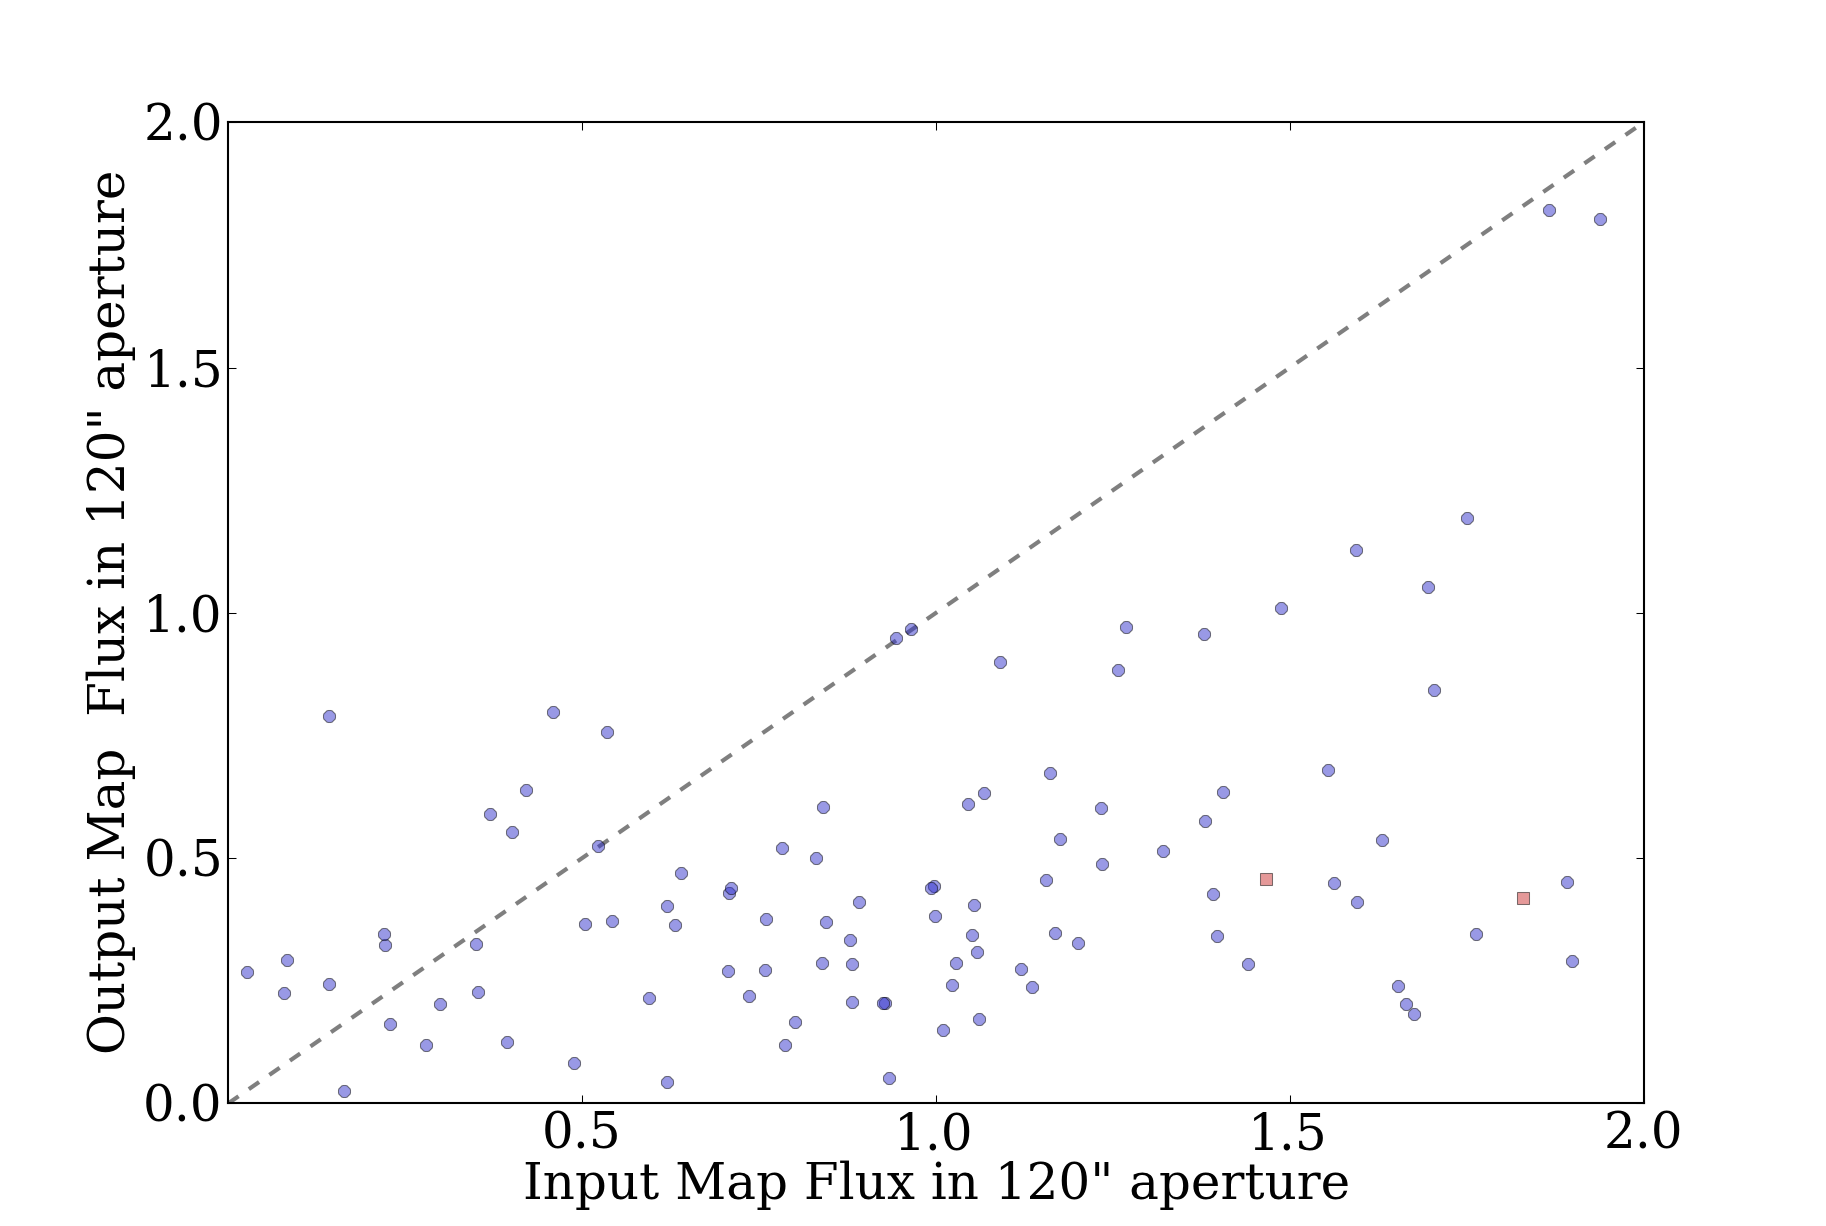
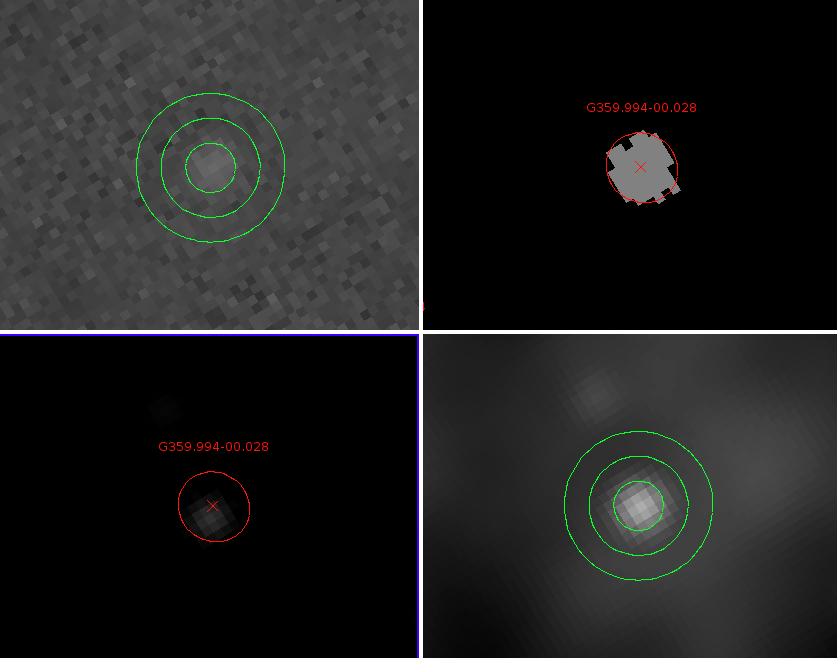
Prompted in part by a recent ATLASGAL paper identifying pointing
offsets of about 3" in the BGPS, we revisit the BGPS pointing.
The ATLASGAL team compared the source locations in their catalog to
source locations in the Bolocam catalog by doing "nearest-match"
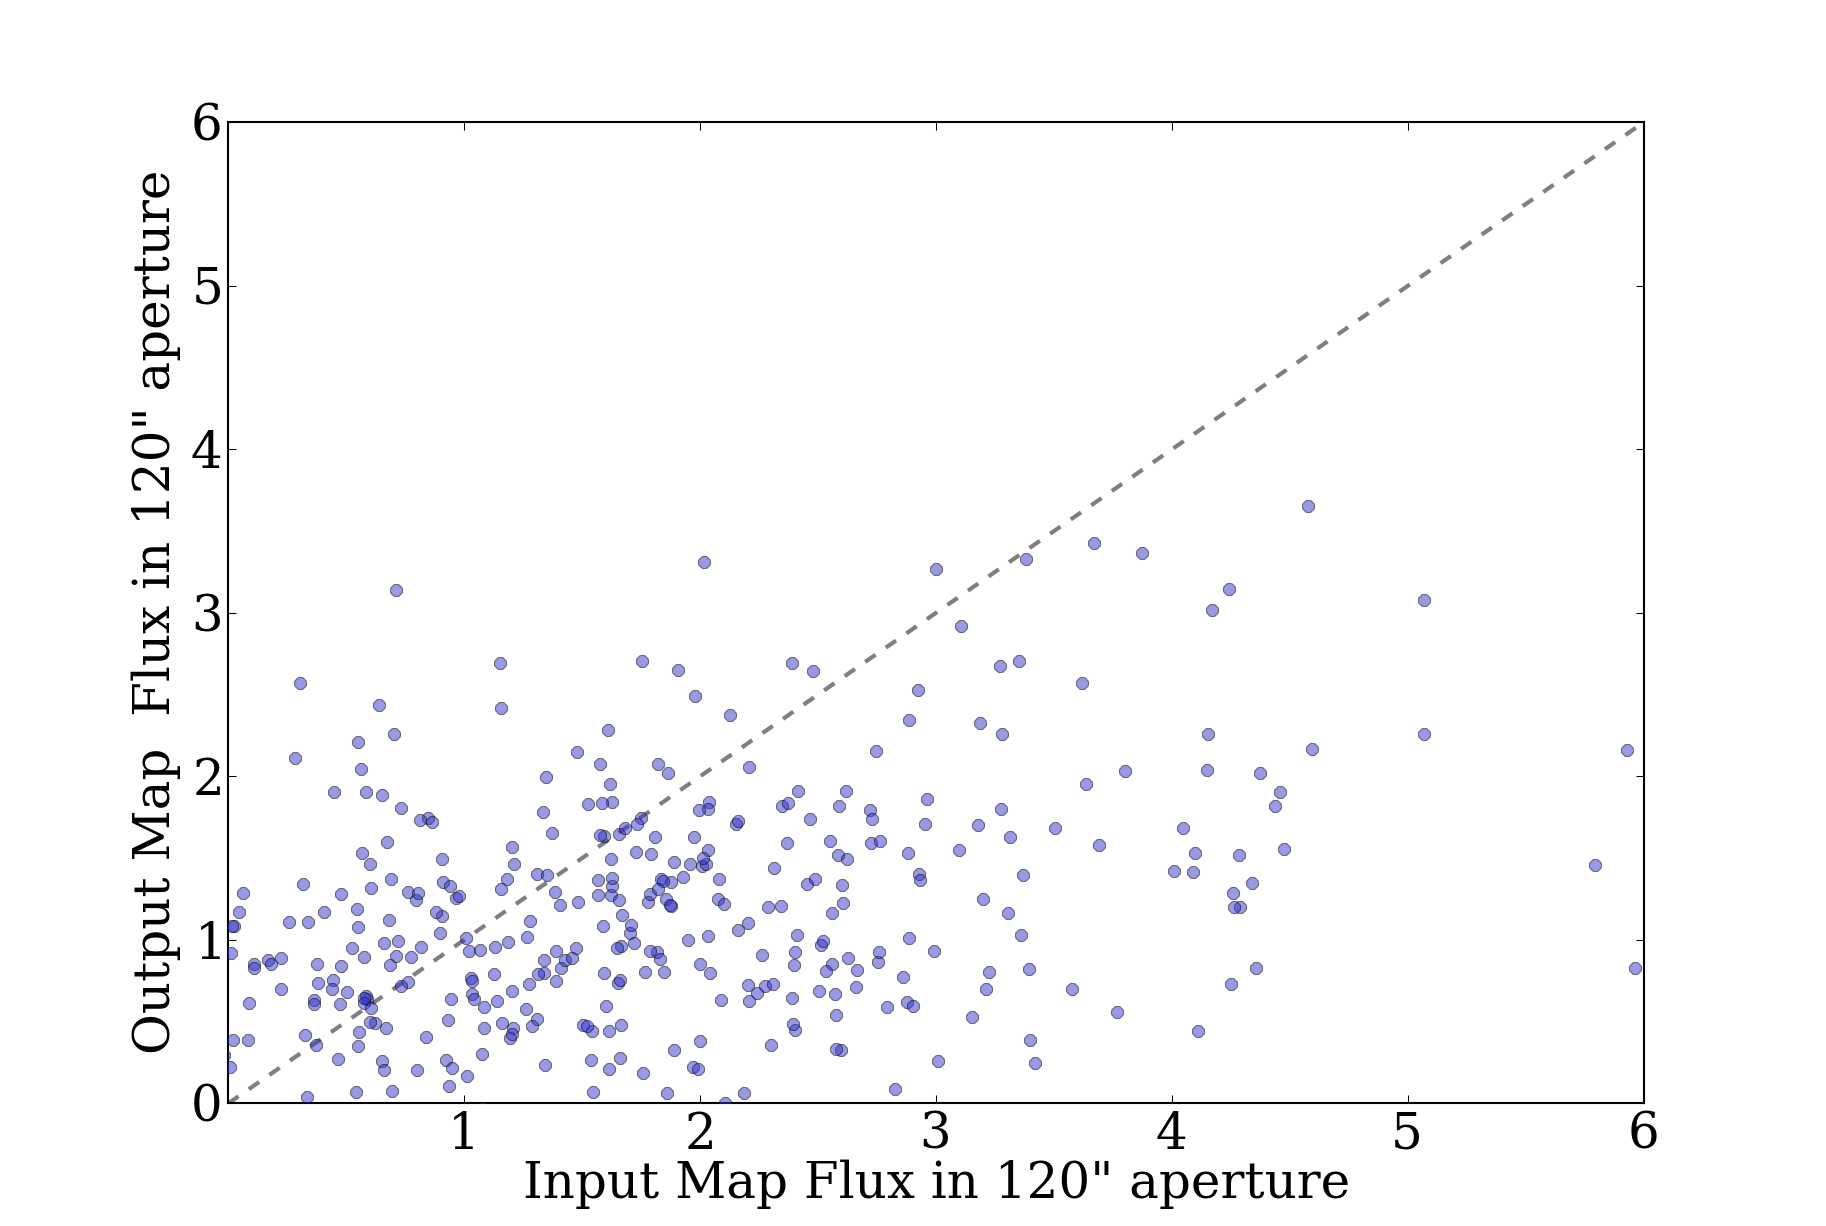
searches within a 40" radius (see their Figure 8, reproduced here)

Their comparison was over the range -10 < l < 21, so it only covered a
small fraction of the BGPS. It covered 13 fields with independent
pointing solutions, so it's possible that they have actually discovered
an offset only in some of our fields.
The catalog comparison, while interesting, is potentially quite flawed.
There's no guarantee that a source extraction algorithm will measure
source centers accurately when a "source" is just a local overdensity on
a complex background. Using source comparison will also lead to a bias
towards the most source-rich fields, e.g. l000 and l001, so an offset in
one of those fields would drastically affect the catalog offset.
There is a better way to compare pointing between two images that are
expected to be (nearly) identical. It is well-known that
cross-correlation is an effective technique for determining the offsets
between two identical images; I'll briefly summarize some of the
literature here.
Gratadour et al 2005 used a maximum likelihood estimator approach to
determine the "best-fit" offset between two images. This approach is
comparable to Guizar et al (2008), who implemented a fast solution
for (highly) sub-pixel image registration in matlab. In order for the
image registration to be fast, it must operate in fourier space, but to
get sub-pixel registration in fourier space, you need to either pad
(which is slow, and increases memory use drastically) or fit some
functional form around the peak of the cross-correlation image. The
alternative approach implemented by Guizar utilizes the Fourier scaling
theorem to create a zoomed-in image of the peak pixel, which allows
you to get much higher precision for a much lower computational cost.
My innovation is to use the minimum $\chi^2$ estimator to determine the
goodness of fit and therefore error bars on the best-fit offset.
Because the $\chi^2$ value for each offset is simply determined by
sums and multiplication ($\chi^2 = \sum
\frac{x_i-\mu_x}{\sigma_{x_i}^2}$), we can compute each term that
goes in to the $\chi^2$ value independently with fourier transforms,
then create goodness-of-fit contours around the $\chi^2$ minimum. The
statistical requirement for this approach to make sense is that the
errors on the data are gaussian distributed, which is an assumption we
inevitably make for astronomical images. I believe there is also a
requirement that the errors are independent, which may be more difficult
to satisfy, but in the Bolocam images it is satisfied, especially when
multiple independent observations are combined.
Strictly, this approach can only be used when the model data have the
same multiplicative scale as the fitted data. The peak will never be
wrong using this method, but the errors could be incorrect if the model
and data are multiplicatively offset. In principle, this can be
resolved in the future using a Mellin transform [see this site or
this for
a matlab approach and this for an academic paper
on it].
This is the approach I have implemented
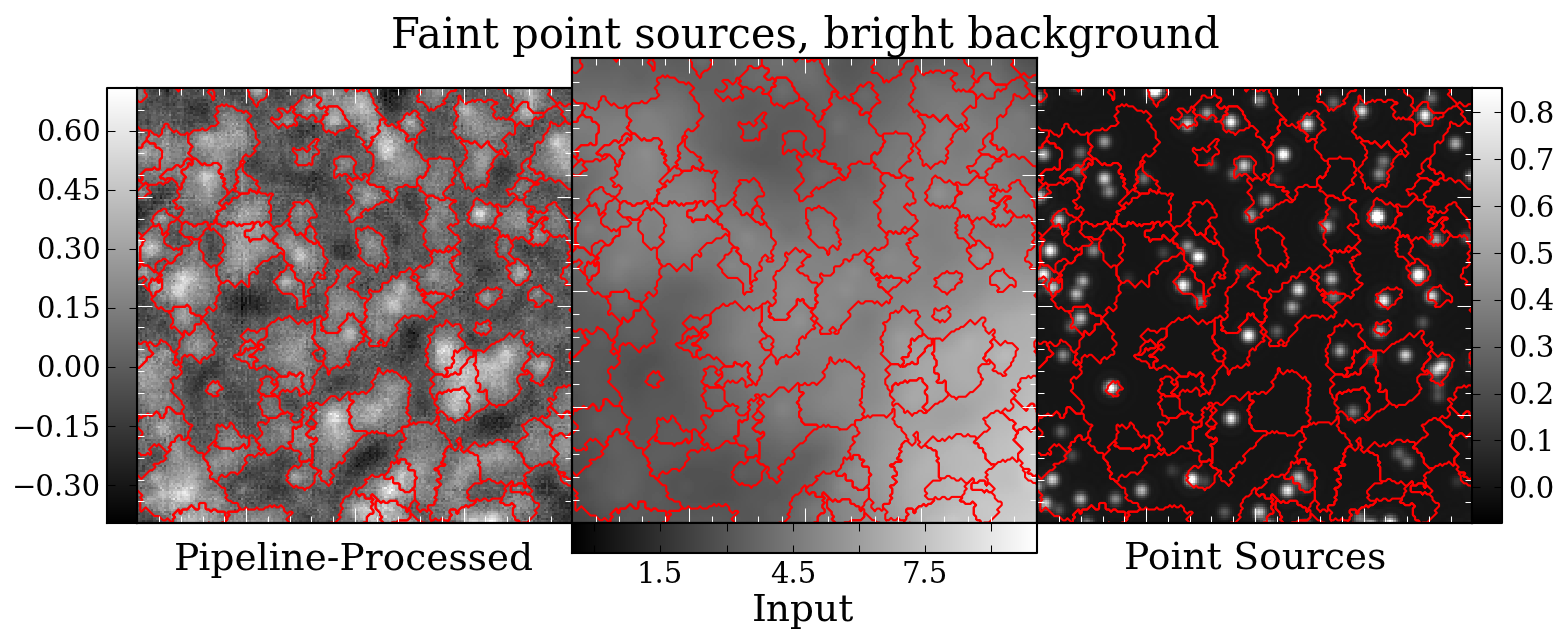
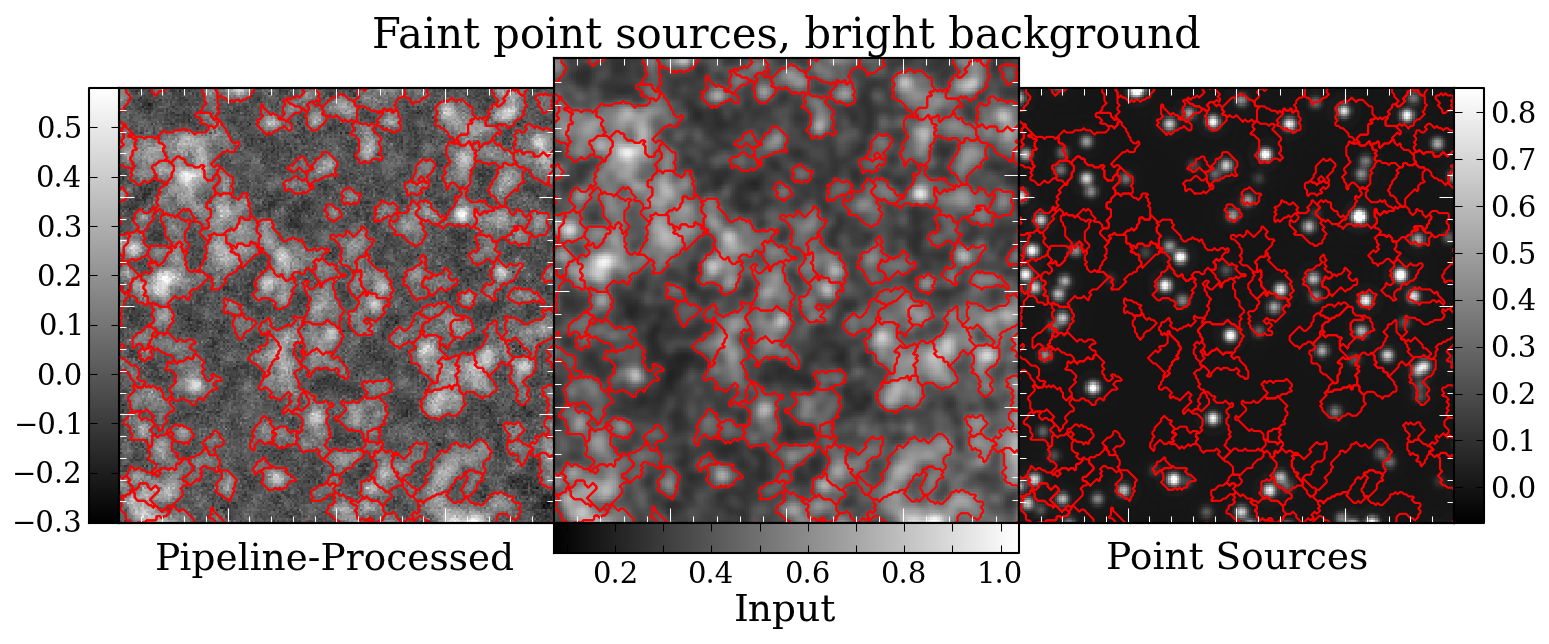
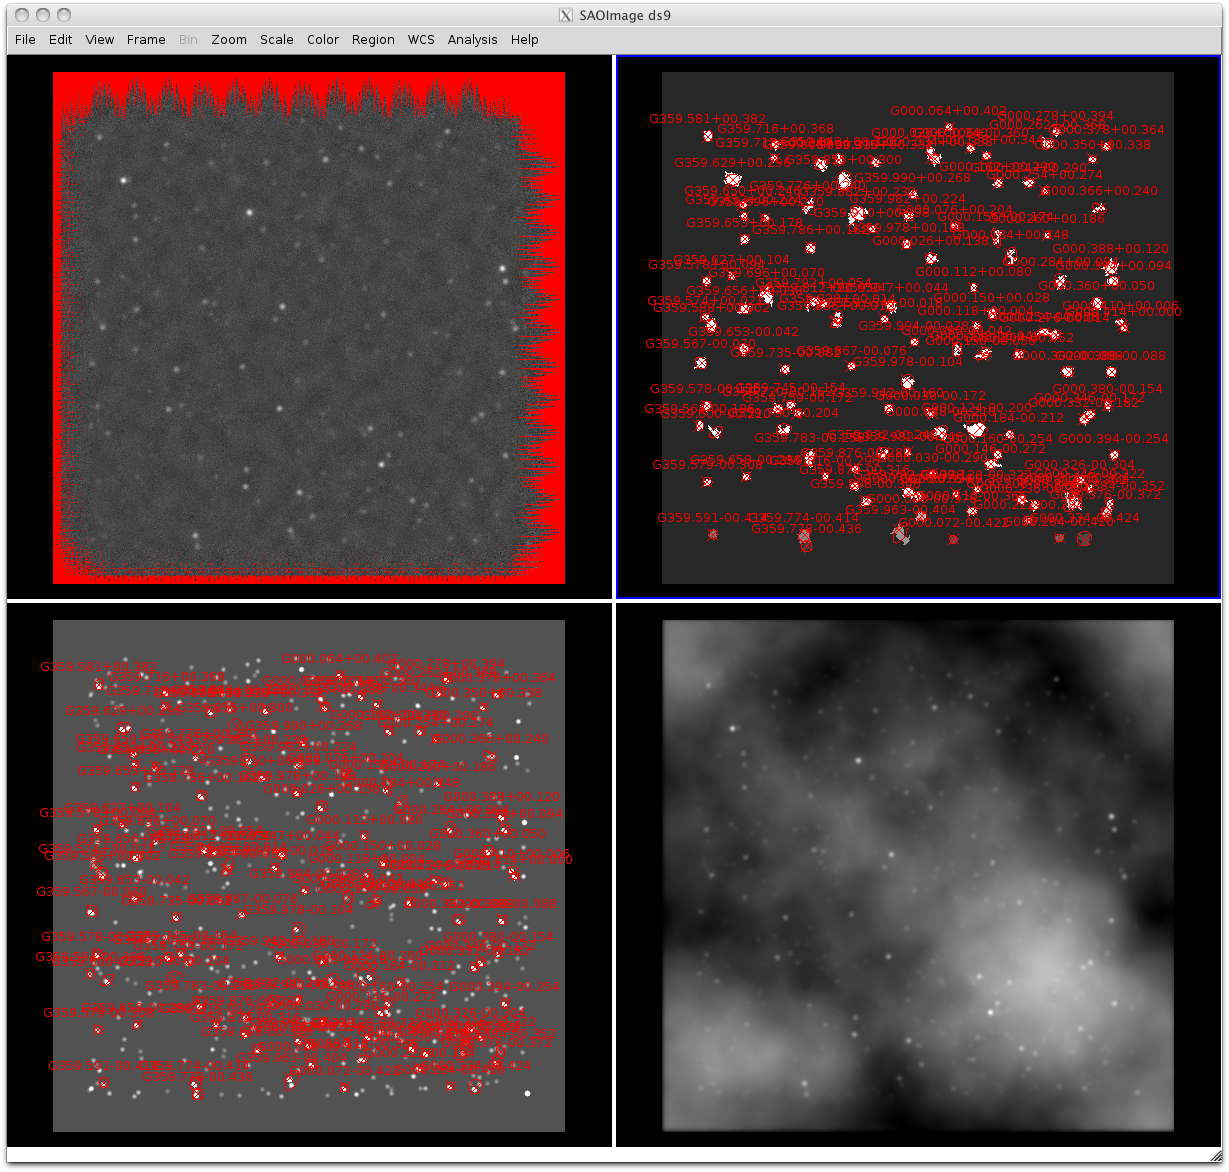
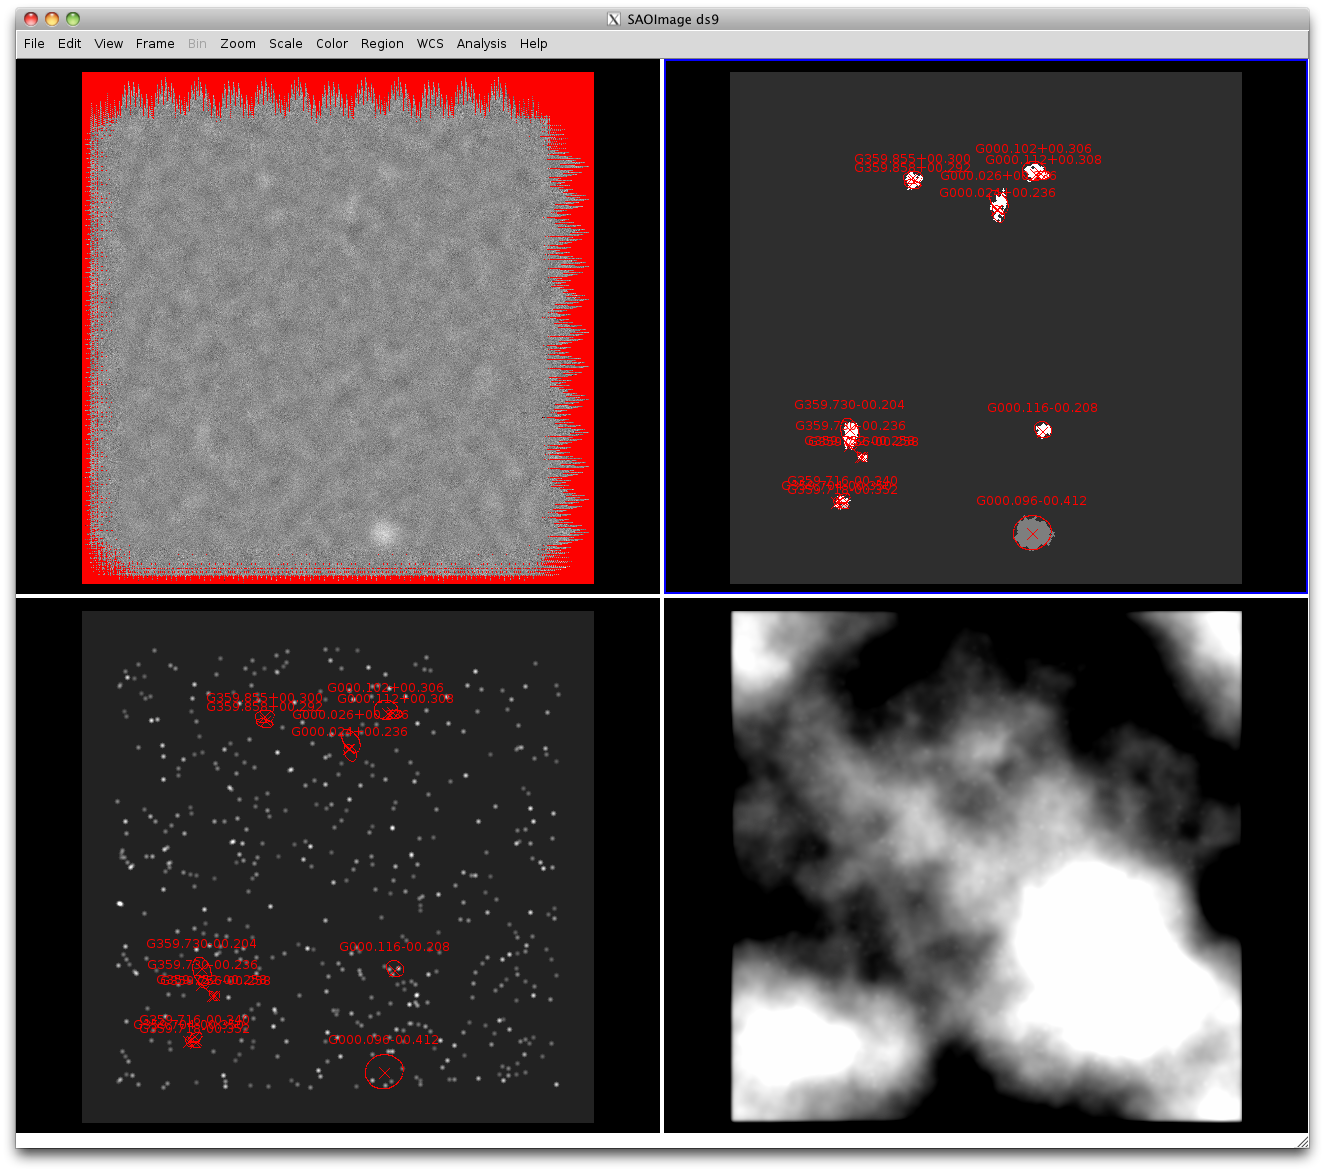
at image-registration.rtfd.org. I used simulated test cases to
demonstrate that it is, indeed, effective and accurate. I used this
method to measure the offsets between the v2 data and the v1 data (which
should, in principle, be the same as the offsets between ATLASGAL and
v1) and the v2 vs Herschel Hi-Gal data (which should be zero).
There are actually a few methods implemented in image-registration, and
I compared those. There's a "dft" and a "$\chi^2$" approach, which are
the same (except $\chi^2$ includes realistic errors), a method where a
2D gaussian is fit to the peak of the cross-correlation image, and a
method where a 2nd-order Taylor expansion is performed around the peak
of the cross-correlation image. The latter two are biased. An
example comparison plot looks like this:

The grey dots are catalog centroid positions offsets measured between v1
and v2. The green cross represents the mean and standard deviation of
the grey points. The other data points, as labeled, show the offsets
between the l000 images in v1 and v2 as measured by the method shown.
They all have errorbars plotted, but the errorbars are generally smaller
than the points. The dark spot seen behind the purple point shows the
$\chi^2$ contours out to 8-$\sigma$: the error in the offset is tiny,
sub-arcsecond. In this case, the offsets nearly agree:
l000 catalog dx: -0.31 +/- 0.68 dy: 1.48 +/- 0.64
l000 $\chi^2$ dx: 1.74 +/- 0.03 dy: 1.41 +/- 0.03
This field agreed nicely between v1 and v2.
The comparison to Hi-Gal is perhaps more important; HiGal's pointing is
calibrated based on multi-wavelength observations, some of which include
actual stars. It's a space-based mission, so its pointing is more
stable. And finally, being a space mission, there's a large dedicated
team instead of a single, part-time individual working on the data.
Our offsets from Hi-Gal are pretty small in general, though not
trivially small.

And it turns out, the region that overlaps with ATLASGAL had more
serious pointing errors than the rest of the survey:

(note: both of the above plots are missing L=359 because I forgot it.
Fixing that now...)
The clearest problem field is l=15, with a longitude offset of -6"
between v2 and HiGal.... that's not the question, though. Somehow I've
lost the code that did the v1-HiGal offsets; I'll have to re-write that
tomorrow and let it run...
Update 12/13: I've spent the last couple days clearing up some issues
with the offsets. The error bars should be MUCH smaller than in the
above plots. The means are pretty similar, though.
Short story: the offsets between v1 and Hi-Gal are greater in the
ATLASGAL overlap regions than elsewhere, and in the right general
direction, but not quite as serious as they claimed. In v2, the
ATLASGAL overlap fields and the rest of the survey have the same mean
offsets, and those offsets are small (-0.5" in l, -1" in b).
The problem now is the table. If everything made sense,
(v1-v2)+(v2-higal)+(higal-v1) = 0. But that clearly isn't the case,
which implies an error in the method, which sucks since I'm claiming
this method is superior to alternatives. It's possible that I'm
actually underestimating the errors against Hi-Gal - that can be fixed
relatively easily - but the magnitude of the error won't affect the
centroid measurements. So I probably need to investigate one case very
carefully. l050 is a big problem case, with vector sums >1 pixel in
both directions. That will be my next line of investigation.
The approach will be:
-crop identical fields within l050 from v1, v2, herschel
-perform pointing comparison between them
-check that vector sum < sum of errors
I think - and hope - the trouble is just that I'm using inconsistent
sub-fields to compare Herschel with the two different Bolocam versions,
which is possible because of the way I selected these sub-fields. I'll
do more careful cropping, and probably re-do this analysis
degree-by-degree (with $512^2$ fields, in the hope that it speeds up the
FTs).
Update 12/14:
I've now cropped identical sections in each of the survey, 1 square
degree (512 pixels) each - which is great for speed. As a sidenote, a
little line profiling revealed that the make_cross_plots
code was the slow point in the process, and it is dominated by savefig
calls, not ffts.
I've run a careful examination of self consistency on the l=0 field,
with positive results: the offsets agree to well within the errorbars
(though there is some residual error at the 0.5" level).

However, a similar inspection of l=50 resulted in a major failure:

In this case, the problem is caused by W51 being exactly on the field
edge, leading to huge cross-correlation power at dx=0, but spread over a
large y range. My first thought is to try to downweight the edges,
which can be achieved by "zero-padding" the noise image, but with high
values instead of zero... or alternatively, by setting the edge region
to zero smoothly.
OK, first thought: Bad idea. Increasing the noise along the edges
drastically increases the small-shift autocorrelation for the noise,
which in turn ends up ruling out the small shifts as a fit possibility.
I don't think this really makes sense mathematically, but each step
does. Why would increasing the noise along the edges make the $\chi^2$
fit worse?
This revealed a serious bug in the code that, luckily, only affected
non-uniform error maps. Basically, I had decomposed the $\chi^2$
equation wrong (which is as bad as it sounds).
That total mess has been resolved now. The image edges are downweighted
with a gaussian of 12 pixels, error=100 outside and weight=0 outside
(with weight^2 inside... best to just view the source if you really want
to know the details). The new versions of the above diagrams:


Less than spectacular for l=50, but acceptable given the errors, which
are indeed significantly larger, as you might expect given the lower
total signal in l=50. Now I need to re-run the fits on every field.
OK, cool, last thing accomplished today (...by 8pm): offset comparison
by square degree for all fields. Again, I don't reproduce the magnitude
of the ATLASGAL-measured offsets, but the ATLASGAL fields are, on
average, more offset in longitude (to the negative) than the overall
average.
Curiously, for both v1 and v2, there appears to be a -1.5 deg shift in
latitude from Hi-Gal.
The vector sums are mostly sub-arcsecond, with most exceptions at l>50.
l=59,64, and 65 are particularly bad - but l=50 isn't so bad. So I
should do the "deep" examination of one or two of those fields... who
knows what new errors I'll turn up?
Here's the new v1-ATLASGAL offset plot:

