- To move slides, use the arrow keys or swipe on your mobile device
- To see the speaker notes, press "s"
- To go to full screen, press "f"
- To print as PDF, go to this URL: ?print-pdf, then print.
- To get a PDF with speaker notes, add ?print-pdf&showNotes=true to the URL.
Salt
Adam Ginsburg
Assistant Professor
Department of Astronomy
University of Florida, Gainesville
Slides available at
https://keflavich.github.io/talks/salts_astrochem_May2022.html
Summary
Salt is seen in disks around HMYSOs
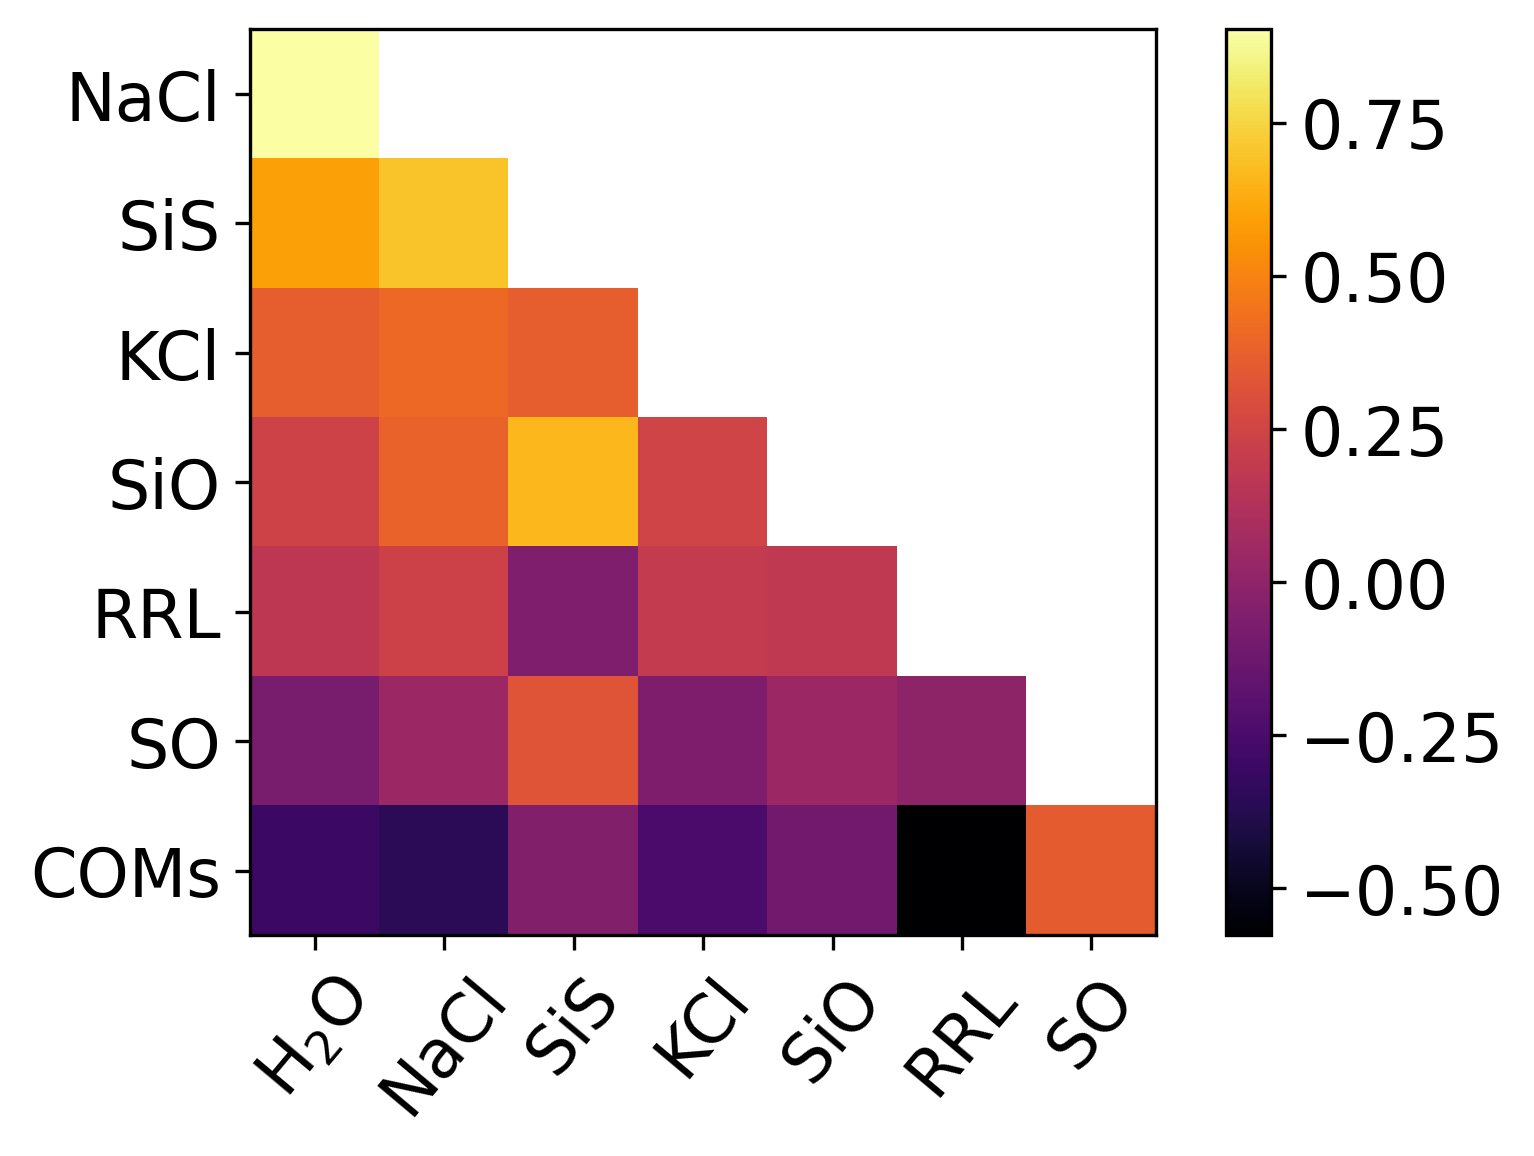
- It is correlated with water.
- It is correlated with SiS.
- It is not seen in the outflow (but maybe at the interface between disk & outflow)
- It is uncorrelated with COMs and ionized gas.
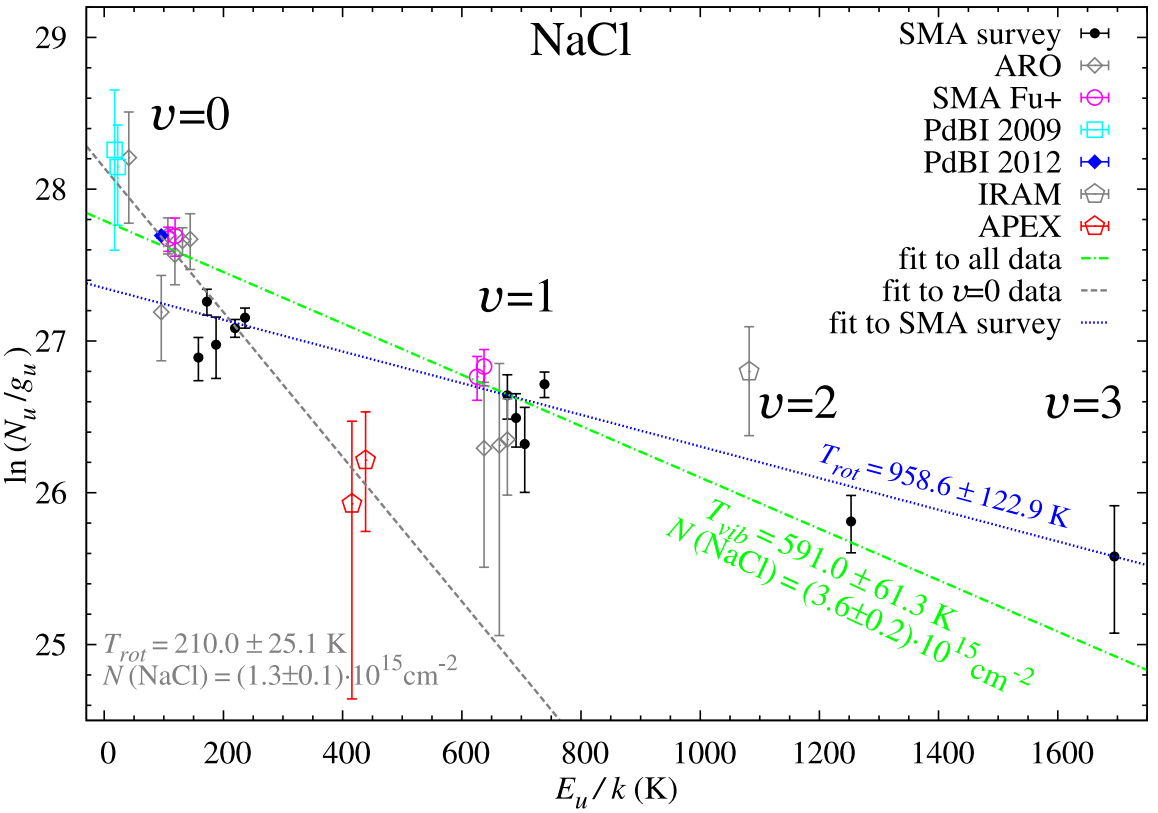
- Its excitation is weird.
Salt (and water and SiS) questions
- Where do we see salt?
- Why isn't it ubiquitous?
- Where does the salt come from?
- What excites it?
- Where else do we (should we) see it?
- What other species might coincide with brine?
Where do we see salts?
- (post)AGB star atmospheres (CRL2688, IRAS+10216, VY CMa, IK Tau)
- Massive star disks (at least 6; this talk)
- aside: are there more HMYSO disks than evolved stars with salt now?
- Exoplanet atmospheres? (hypothesized in hot jupiters)
Orion Source I
a disk around a 15 M⊙ YSO
Salt: NaCl
Brinary disks: NaCl moment 0 images
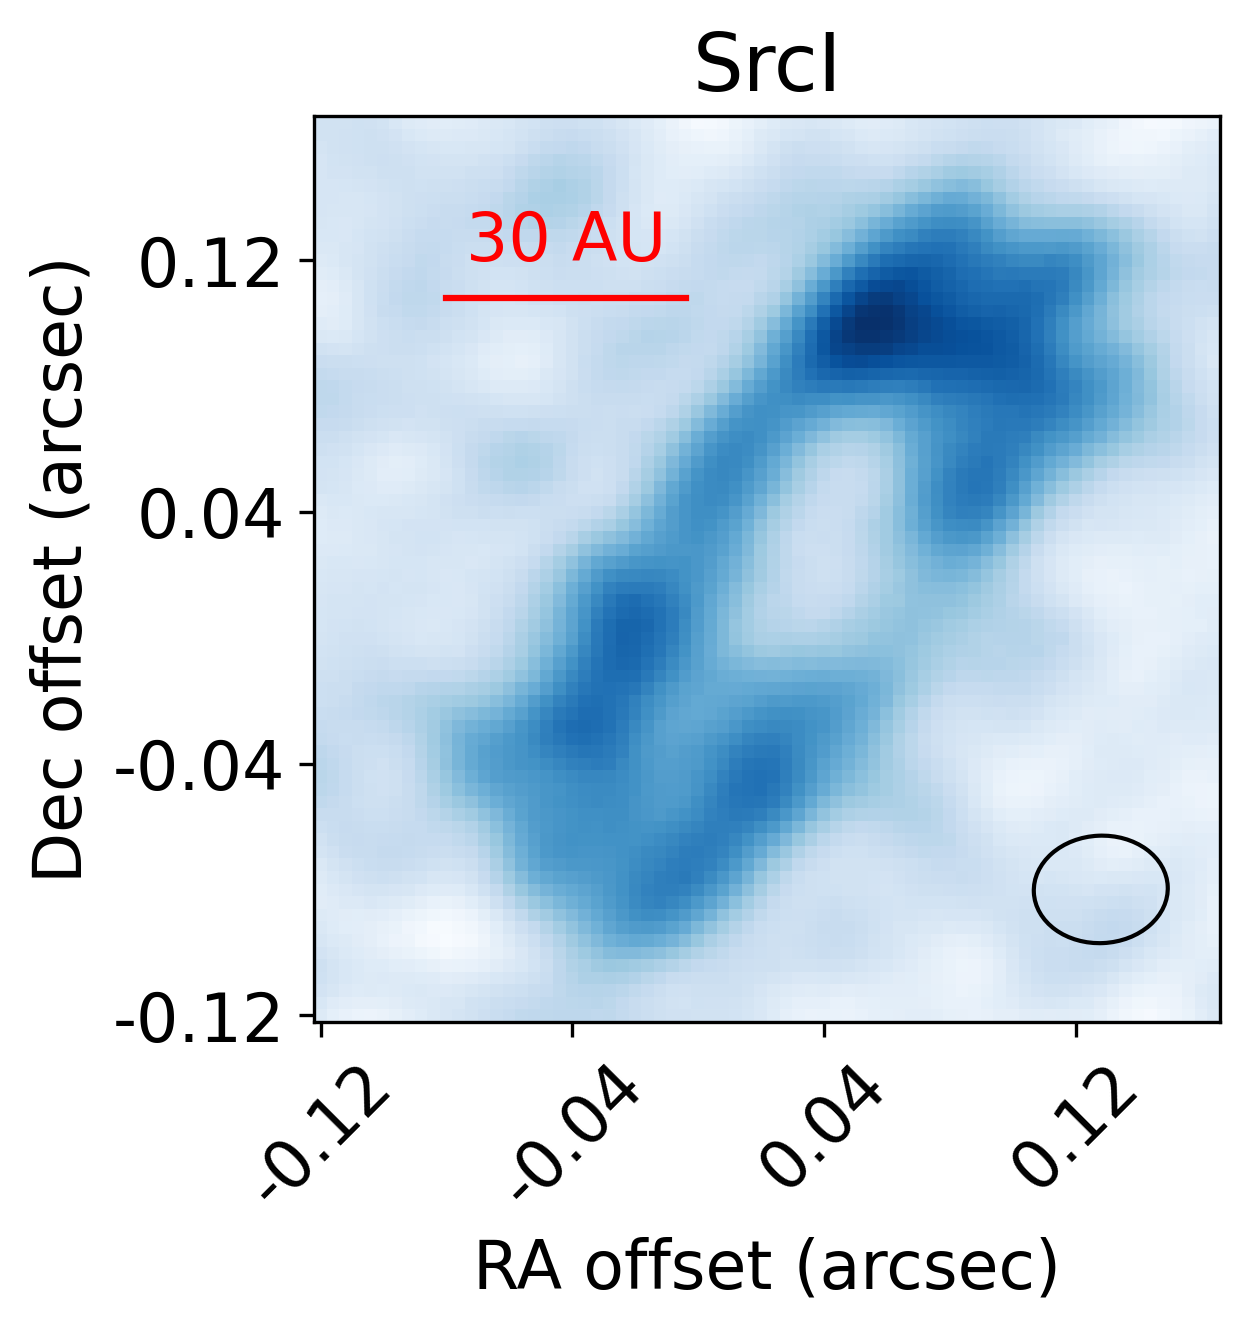
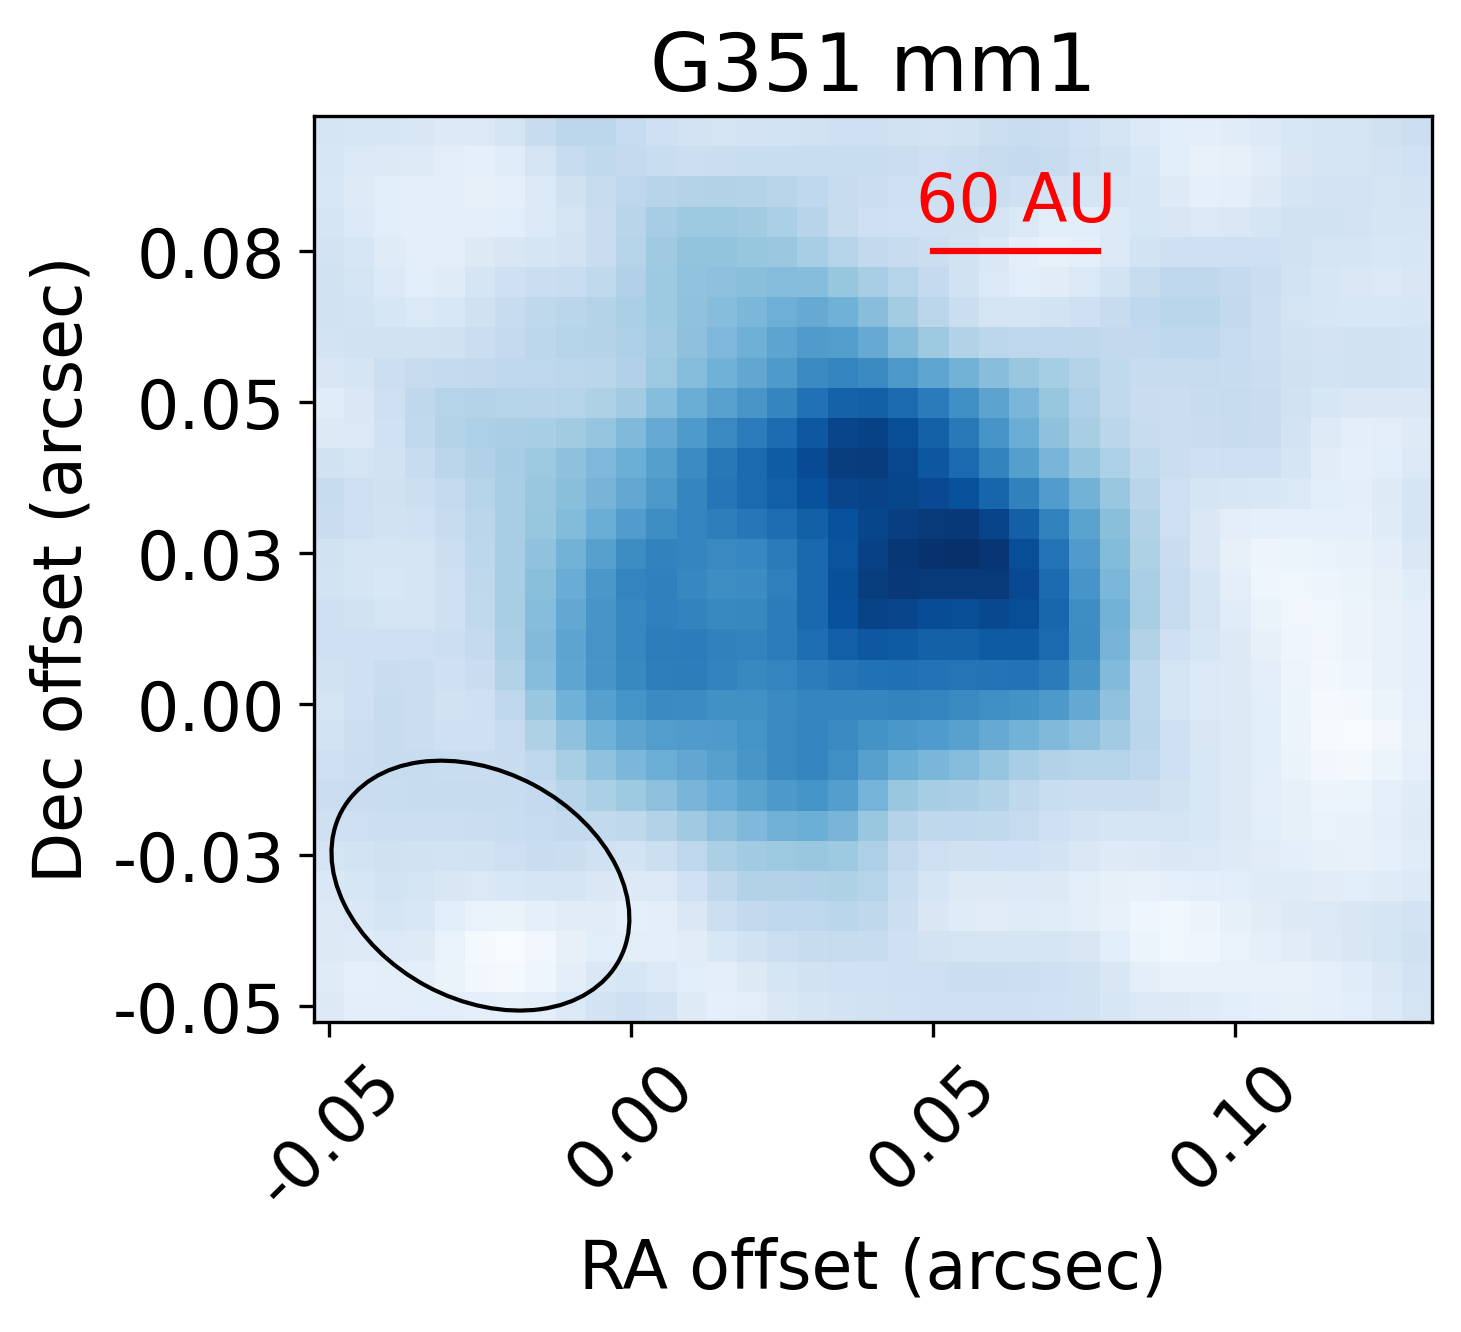
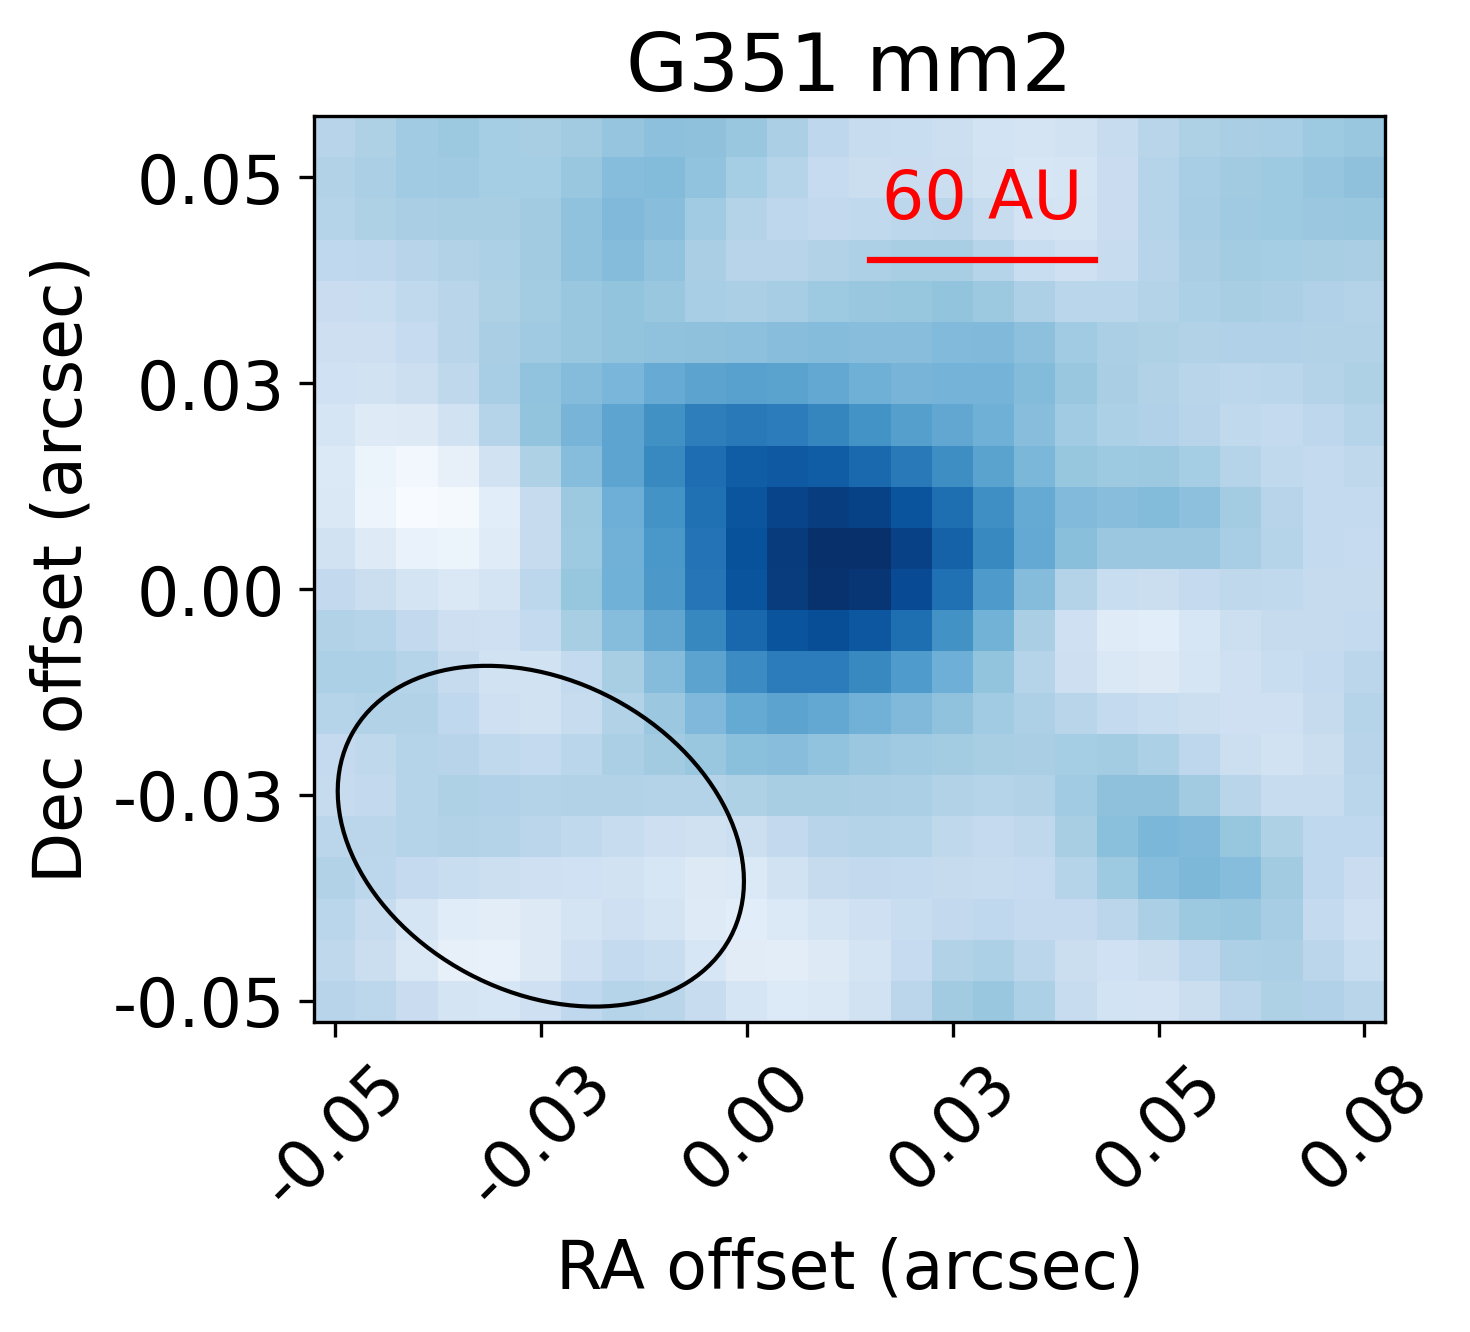
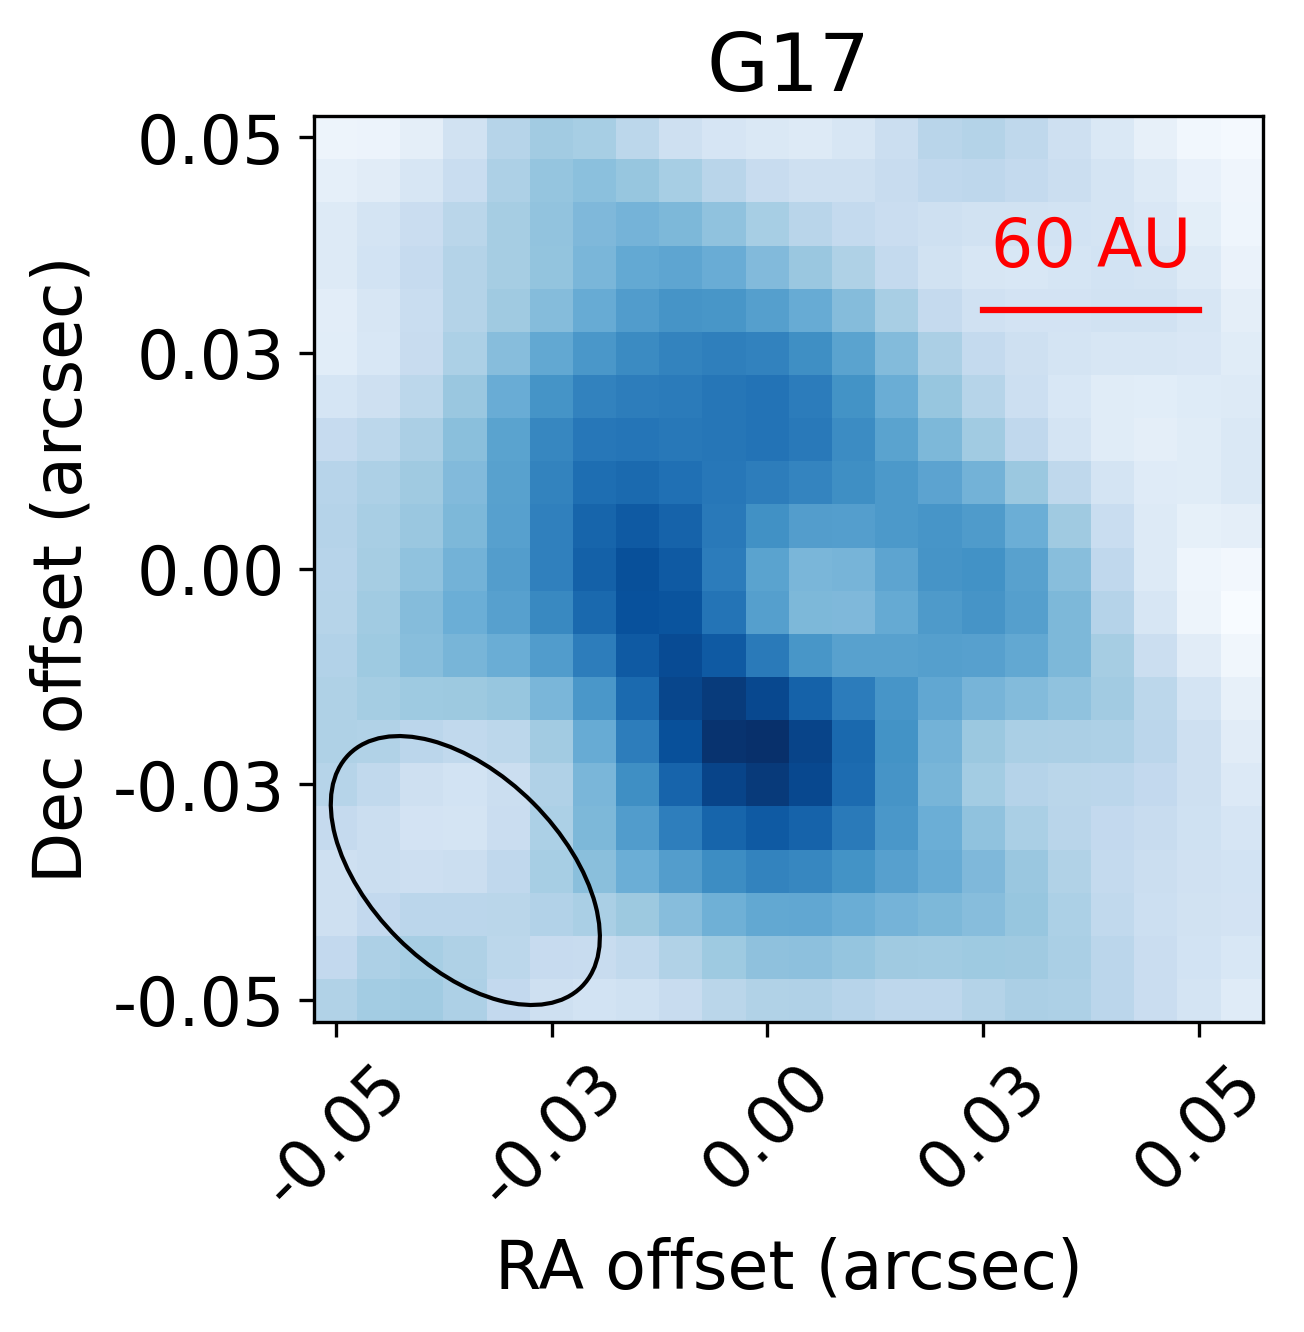
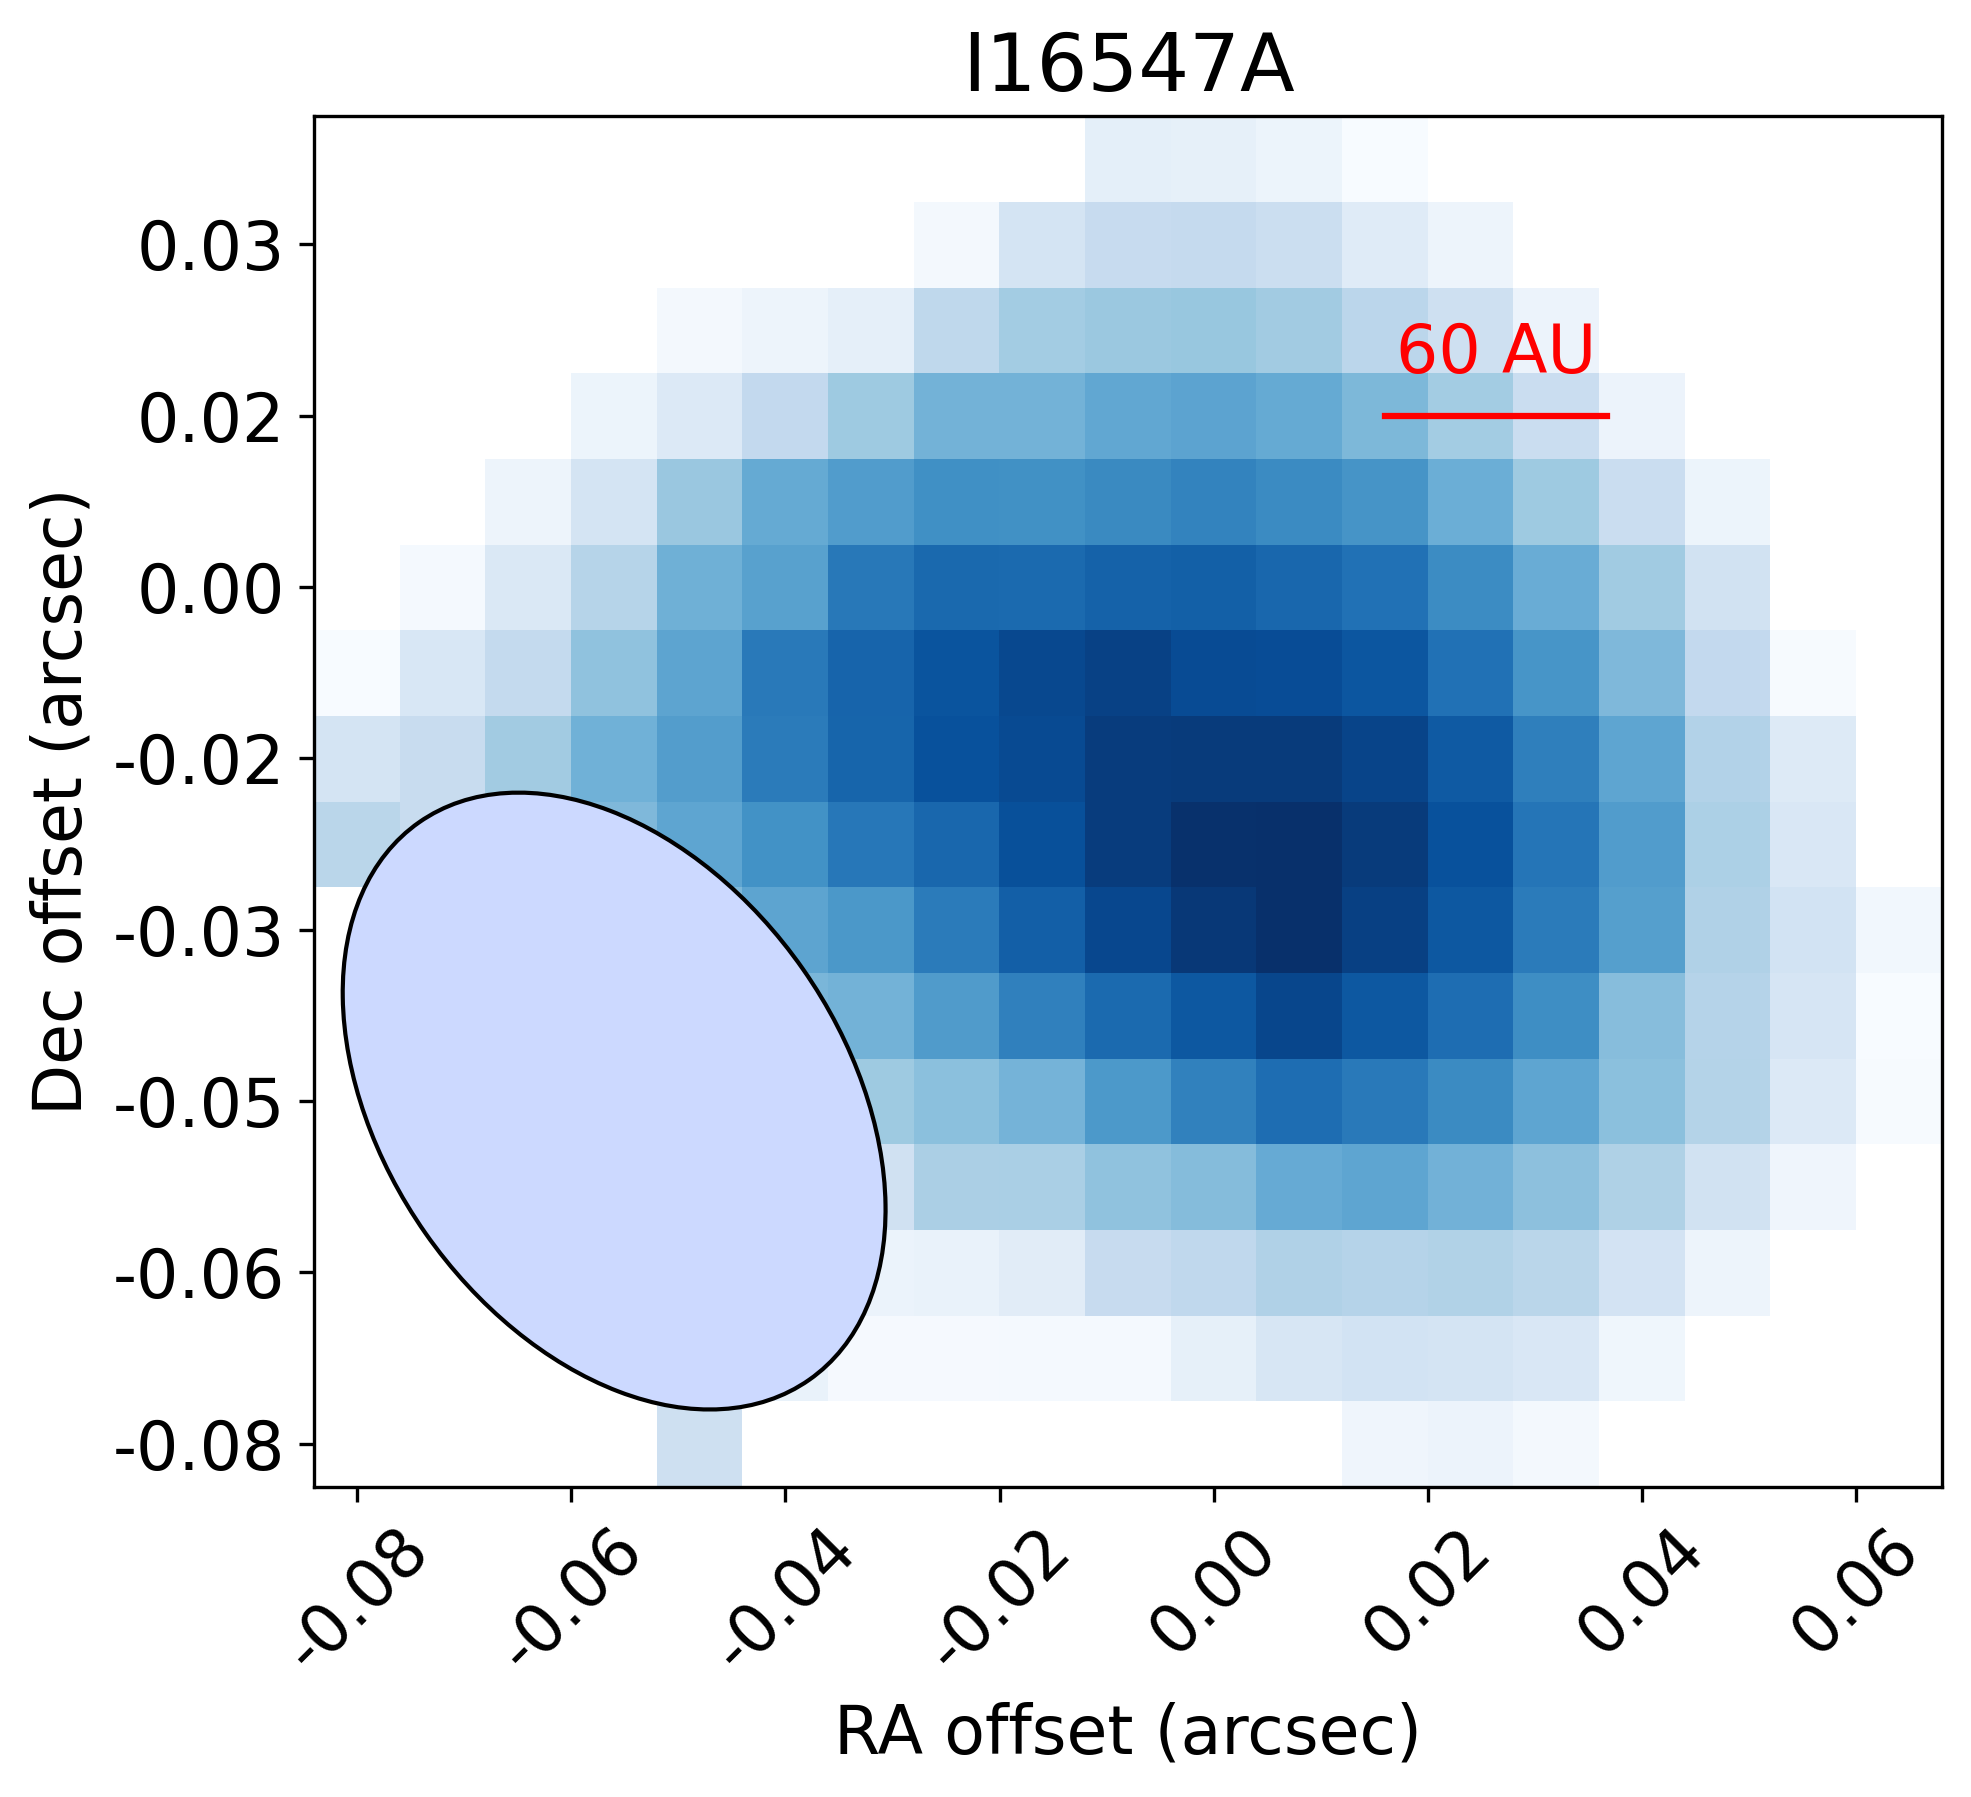
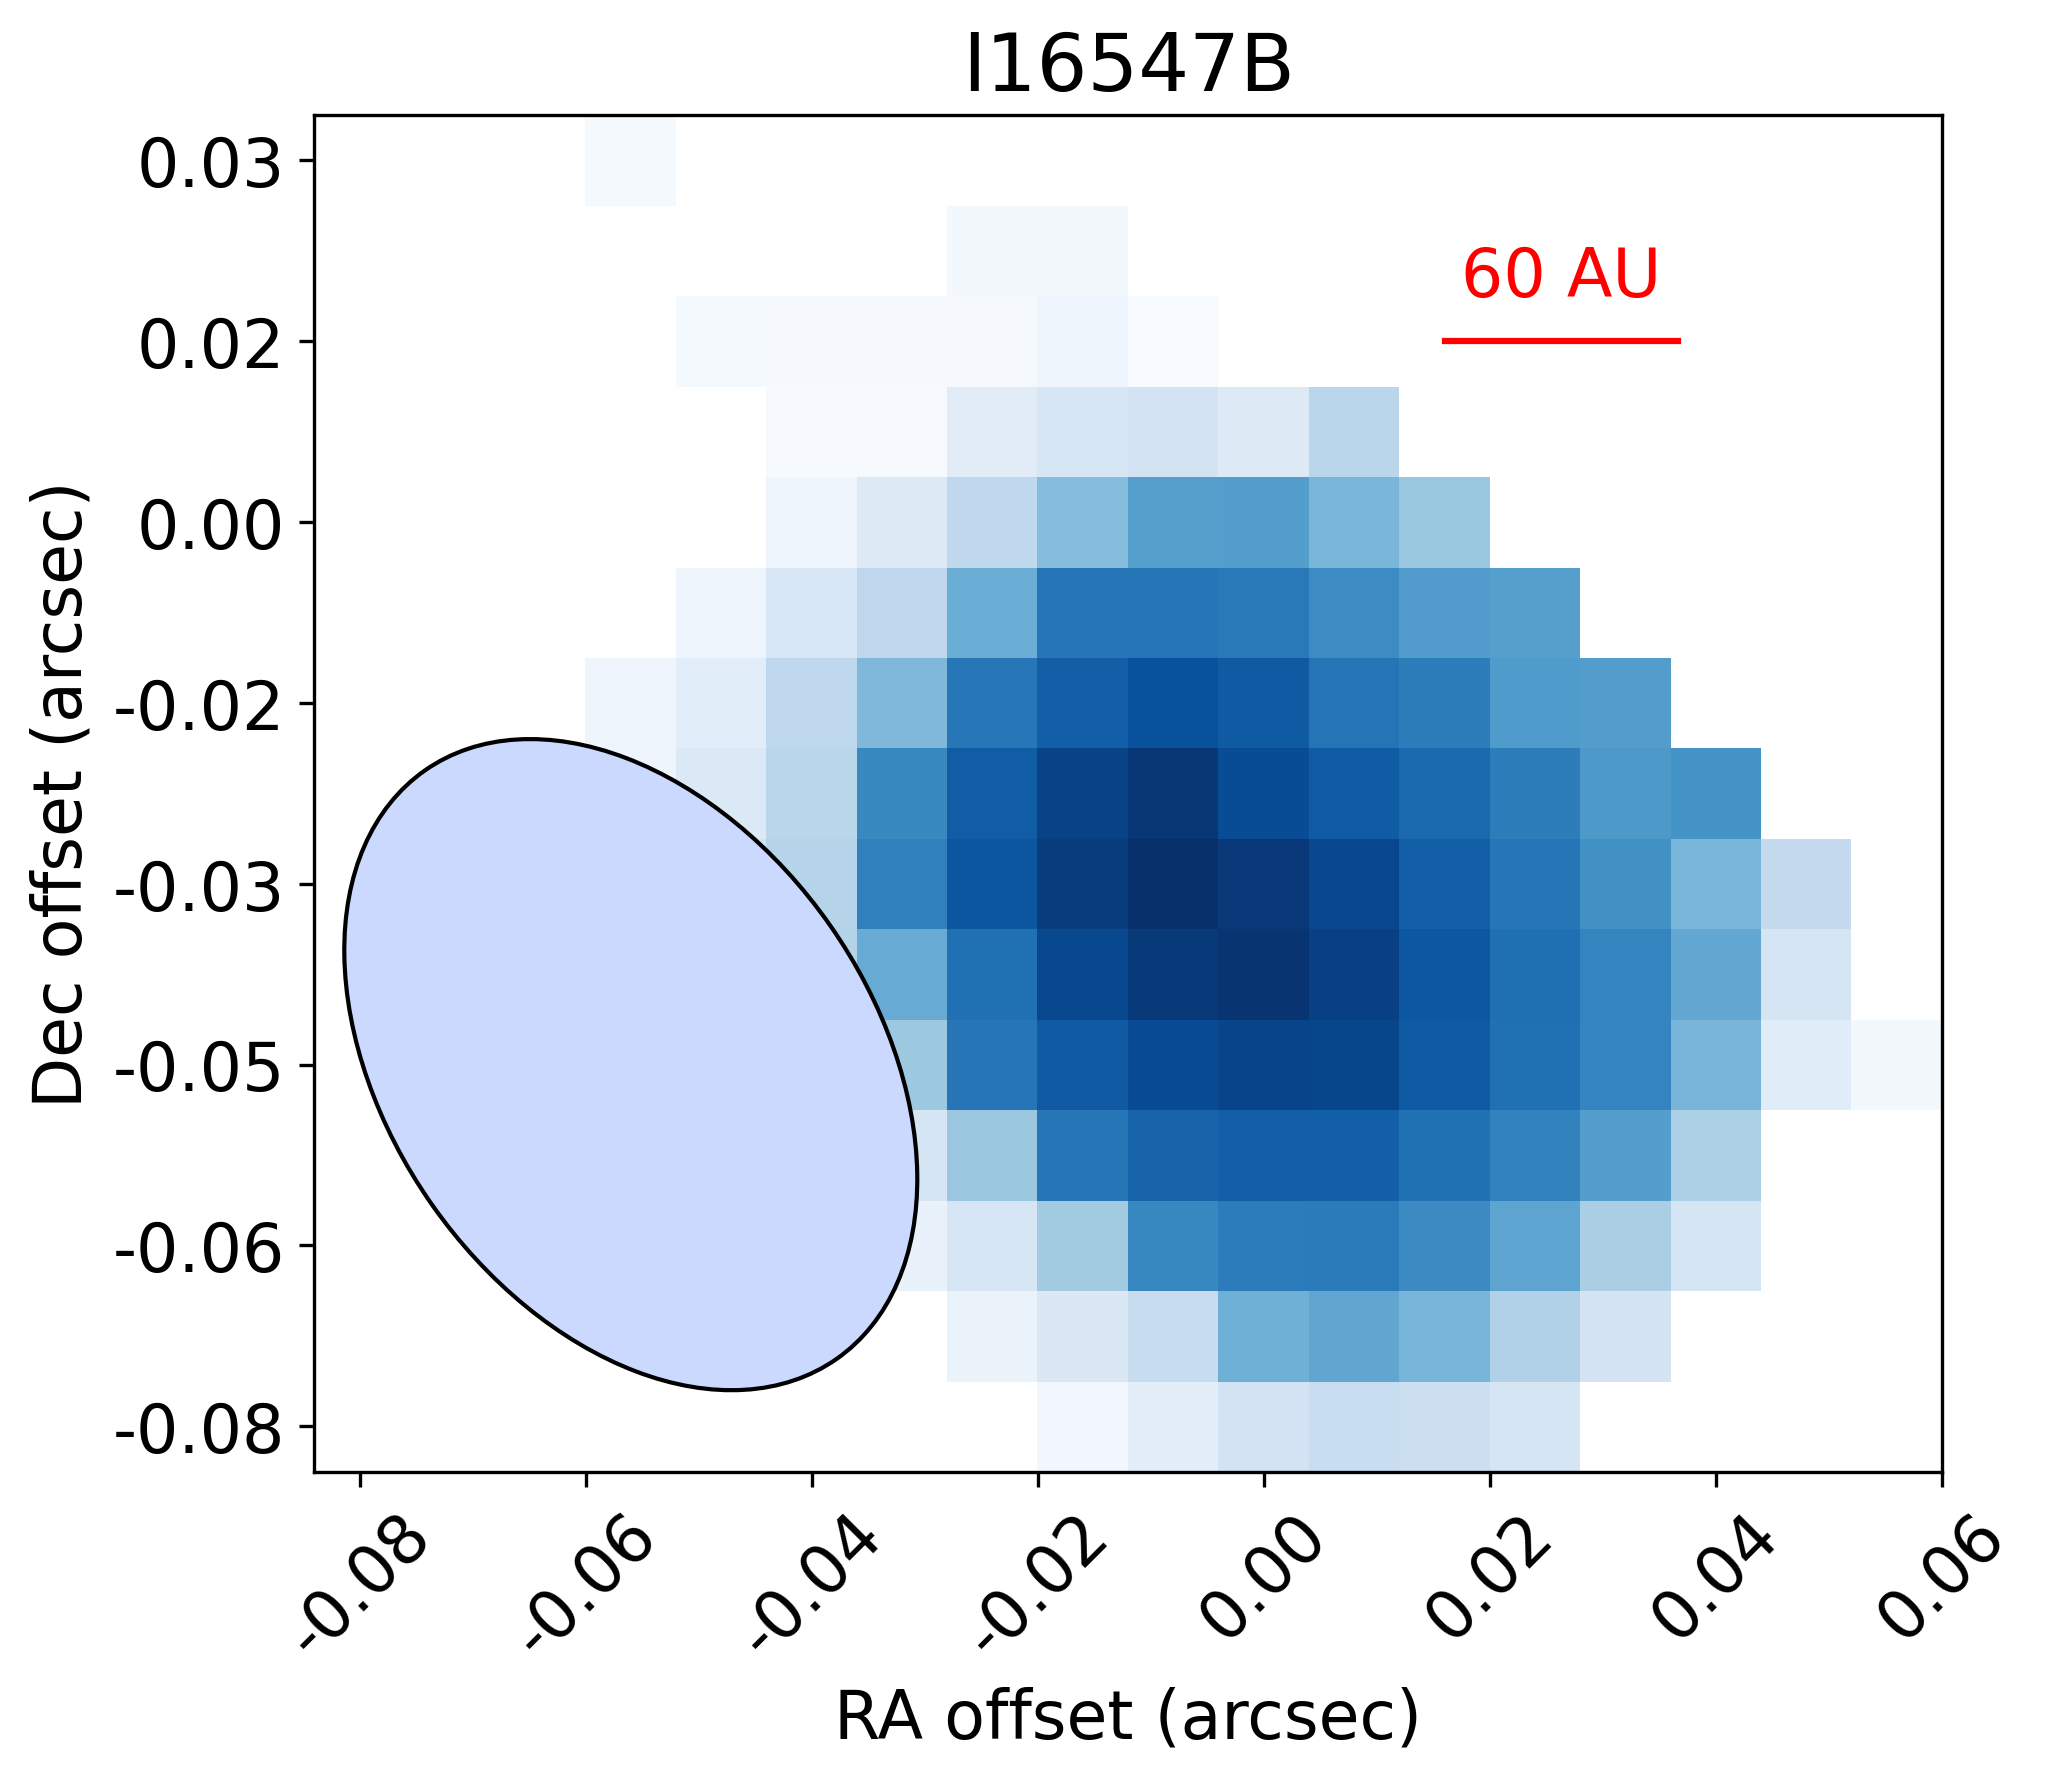
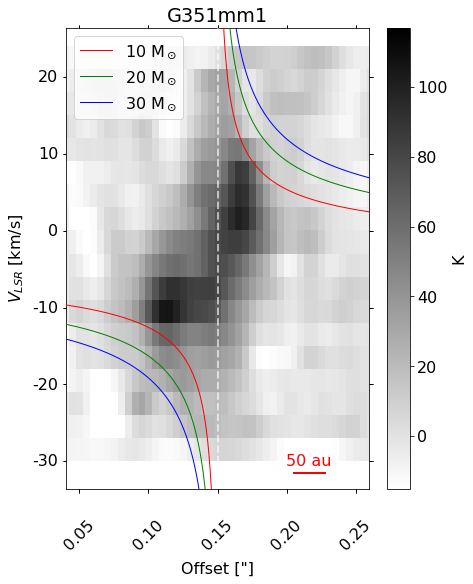
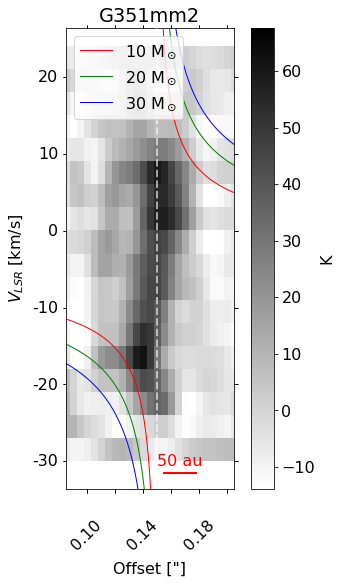
Brine lines measure dynamical mass
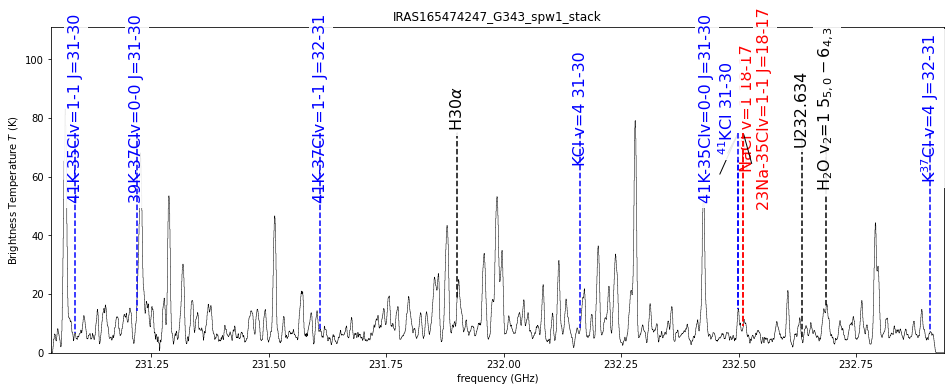
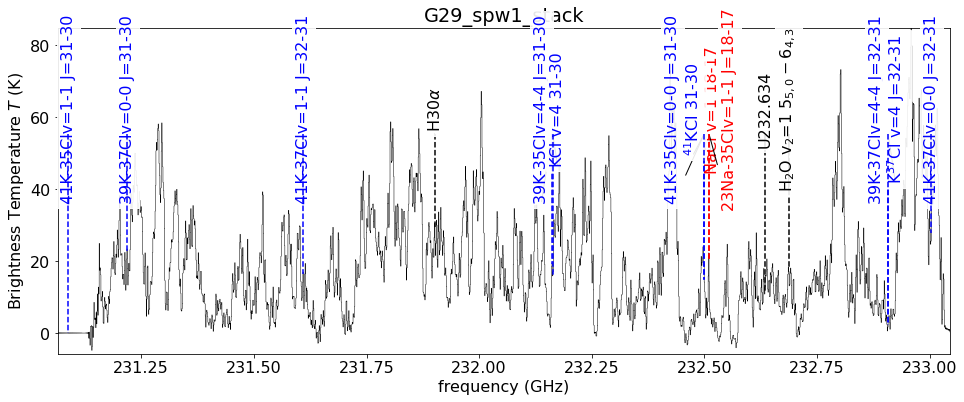
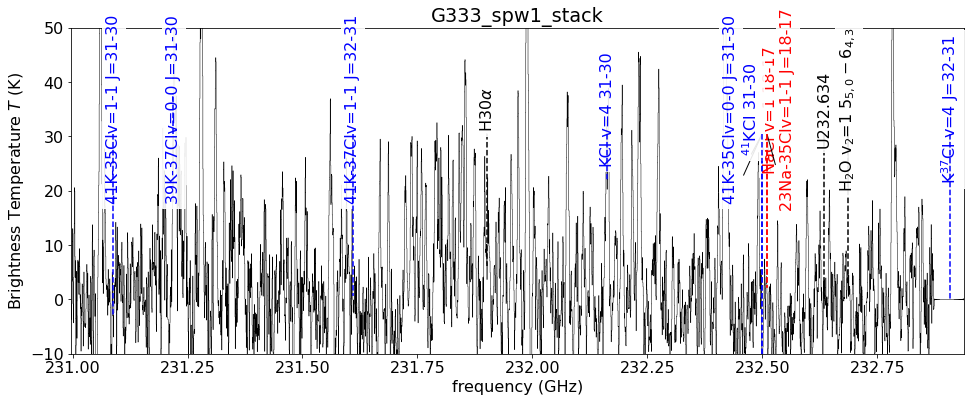
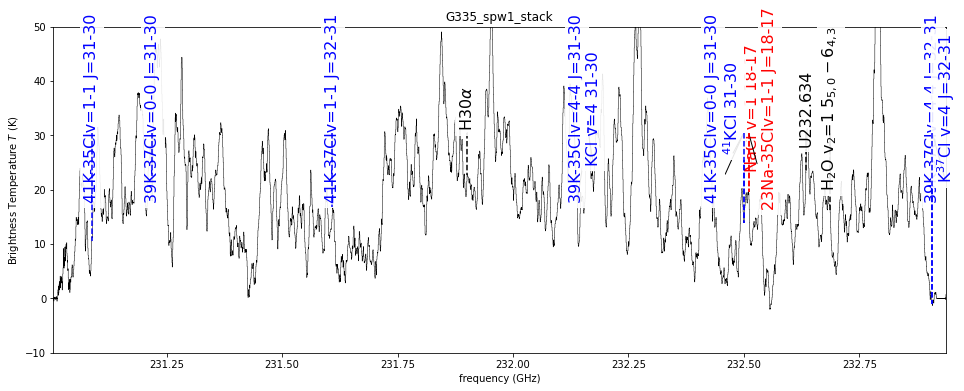
NaCl v=1 J=18-17
Stack of v=[0,1] Ju=[18,17]
SrcI
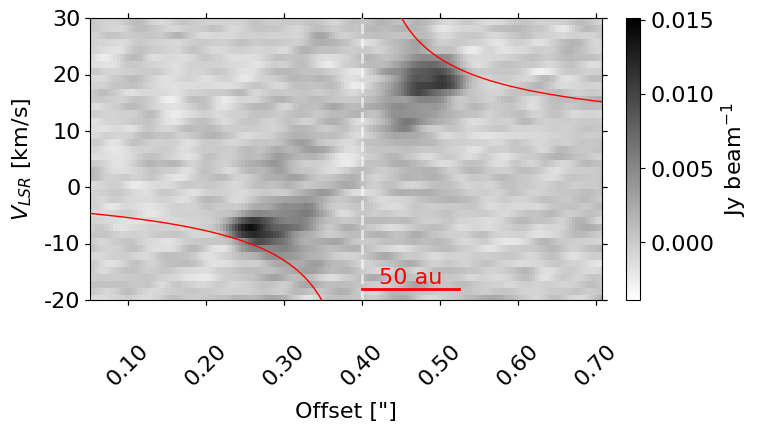
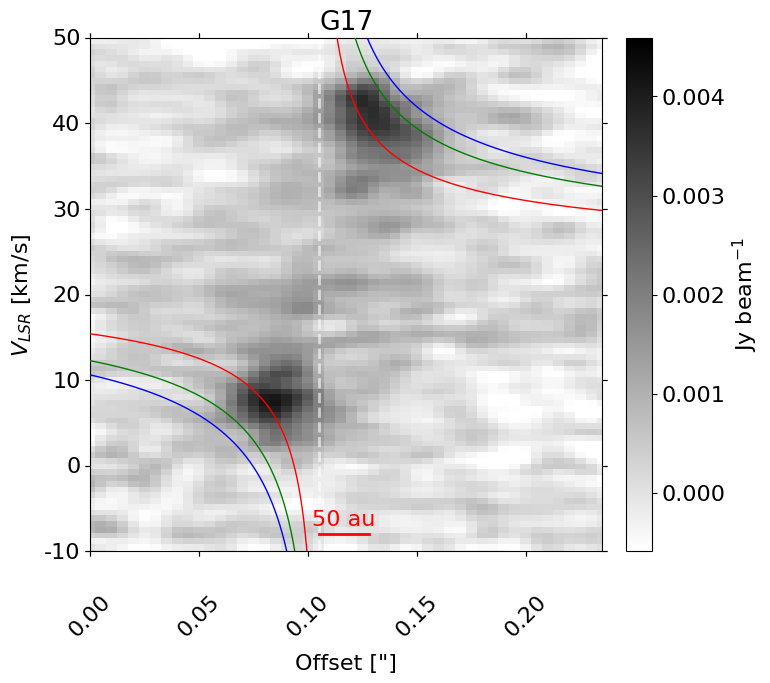
15 M⊙
30 M⊙
40 M⊙
What have we learned about brinaries?
- Somewhat rare?: 6-8 known so far, ~15 HMYSO candidates examined
- Y: SrcI, G17, IRAS16547 A and B, G351mm1 and mm2, W33A?, NGC6334I?
- Ginsburg+ 2019, Ginsburg+ in prep, Tanaka+ 2020
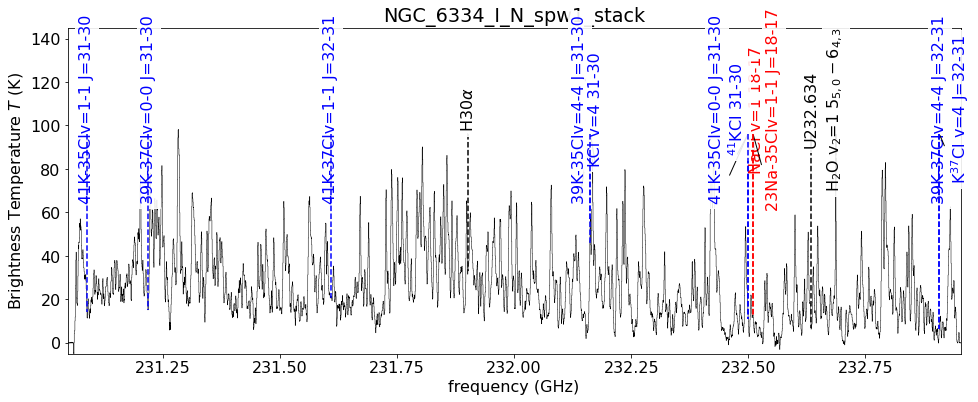
- N: I16523, I18089, G11, G5, NGC6334IN, S255IR NIRS3, G333.23-0.06, I18162
- Y: SrcI, G17, IRAS16547 A and B, G351mm1 and mm2, W33A?, NGC6334I?
- Coincide w/line-poor sources
- Not hot cores; little mass reservoir?
- Or is the core resolved out?
- Trace reasonably symmetric disks (in the well-resolved cases)
Compare: G17 vs GGD27
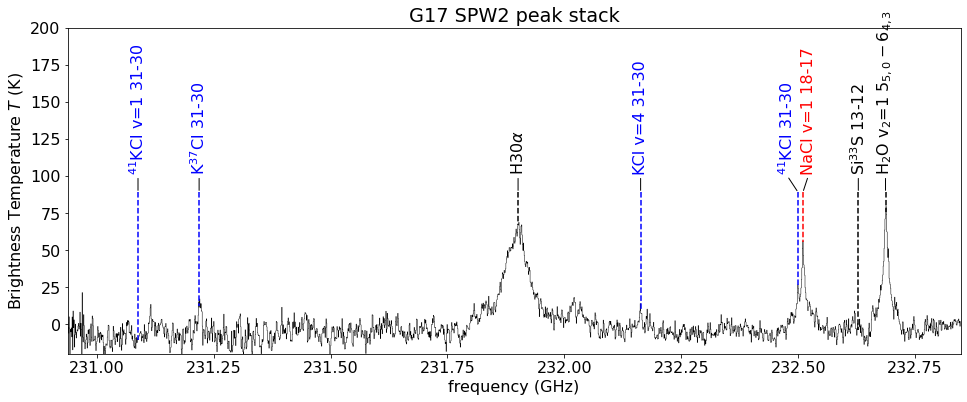
G17: Brinary
Hot (ionizing) photosphere. Circular disk.
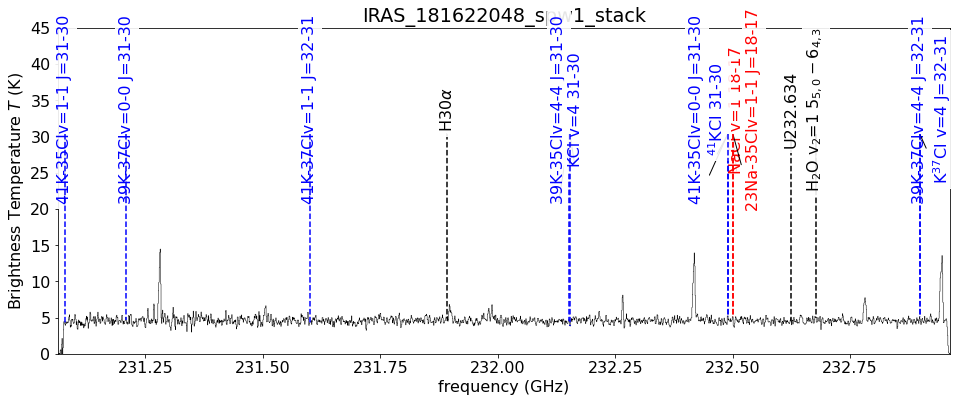
GGD27: Not-Brinary
SO, CH3OH lines. But line-poor!
Compare: G17 vs G11.92

G17: Brinary
Hot (ionizing) photosphere. Circular disk.
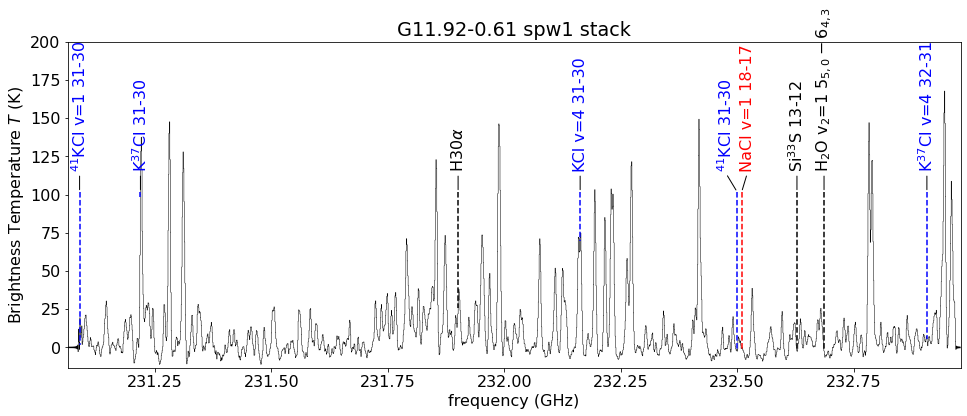
G11.92: Not-Brinary
Line-rich!Big, R=230-850 au (Ilee+ 2018)
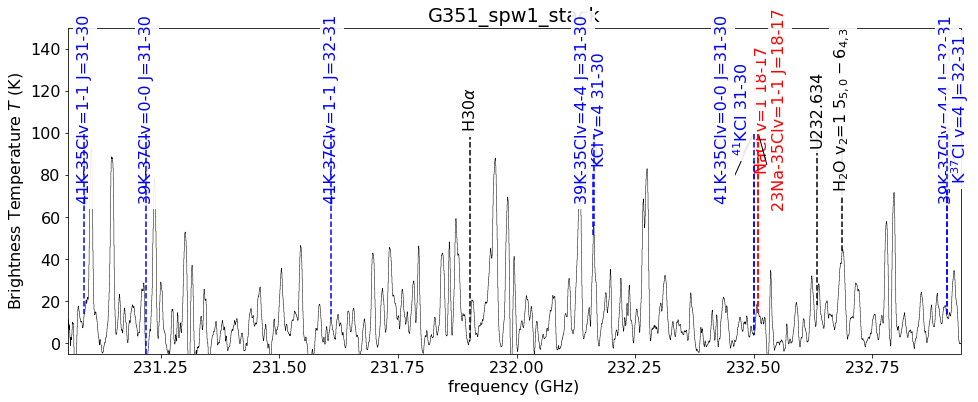
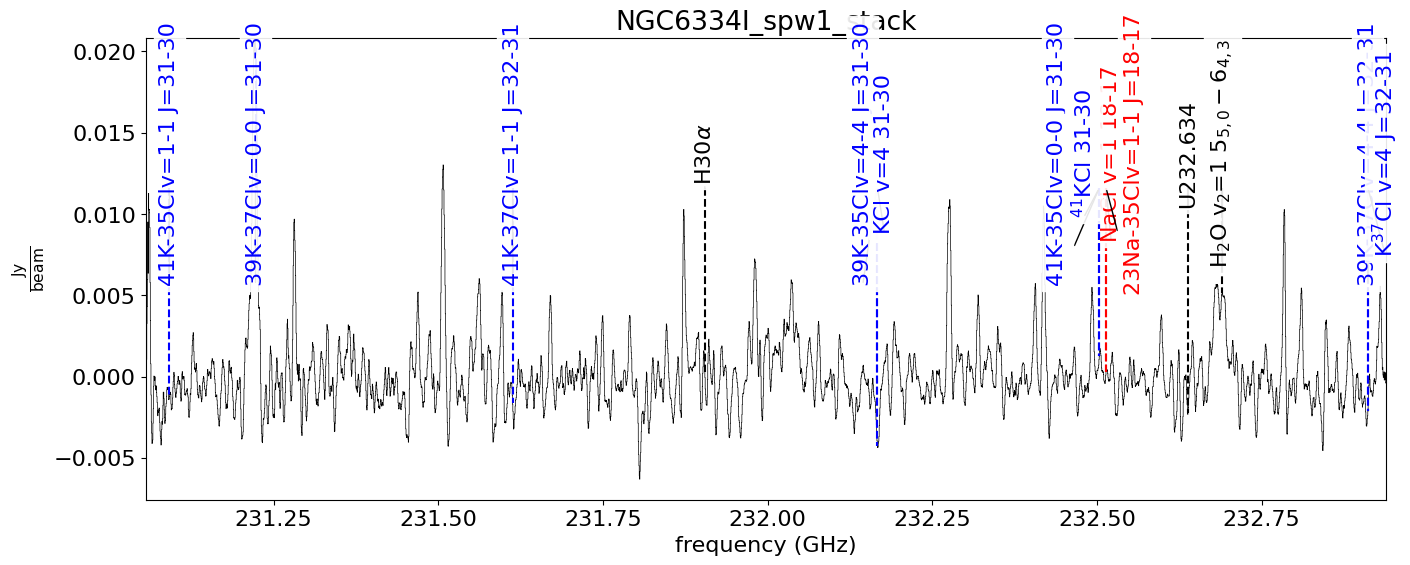
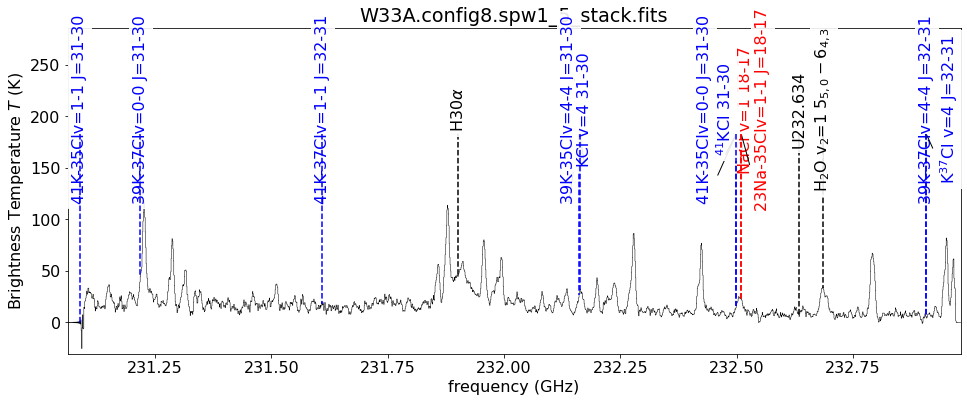

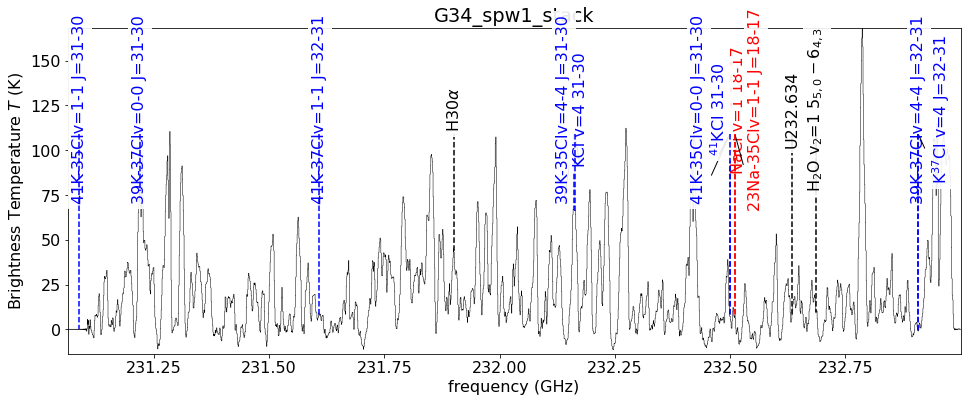
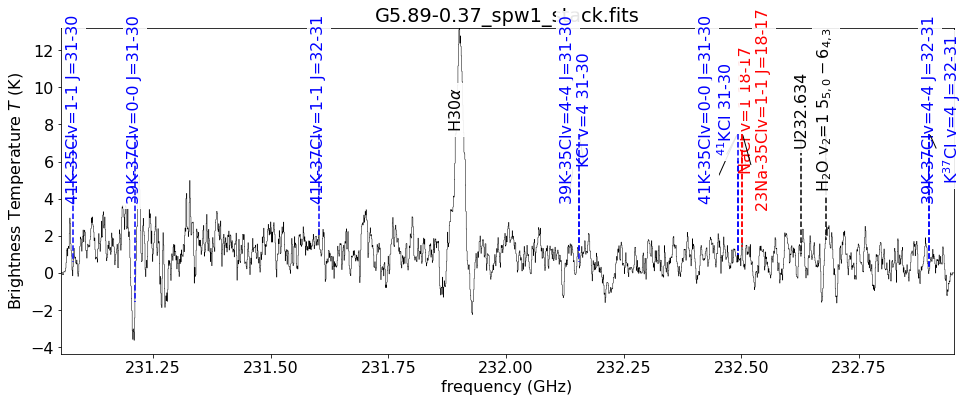
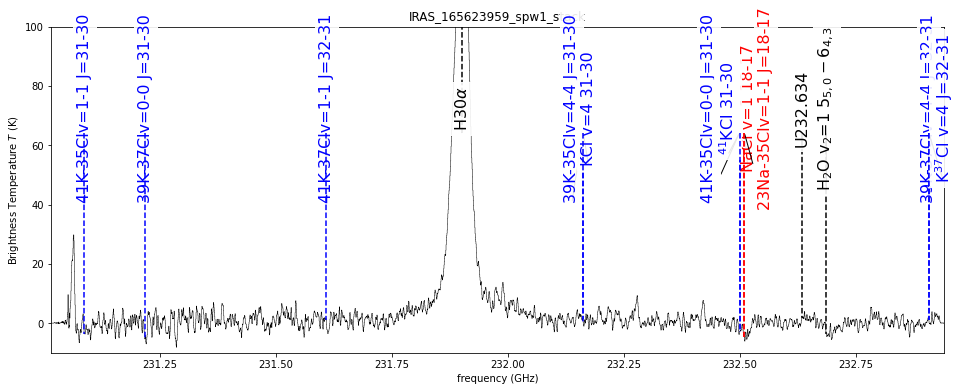
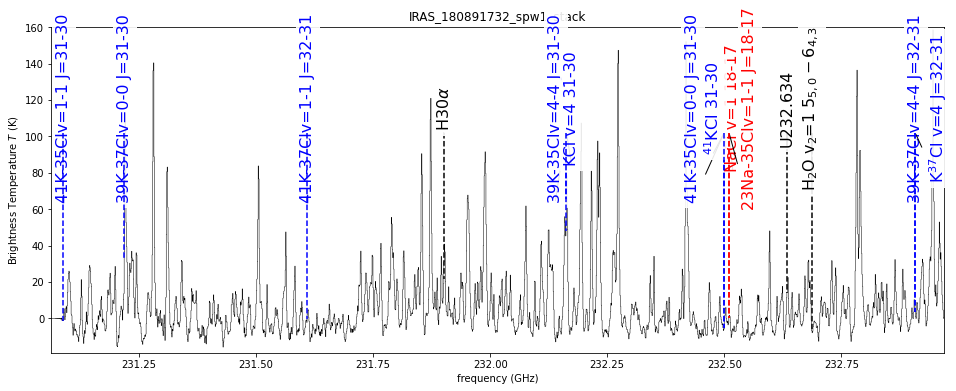

What molecules correlate (in our sample of 16)?
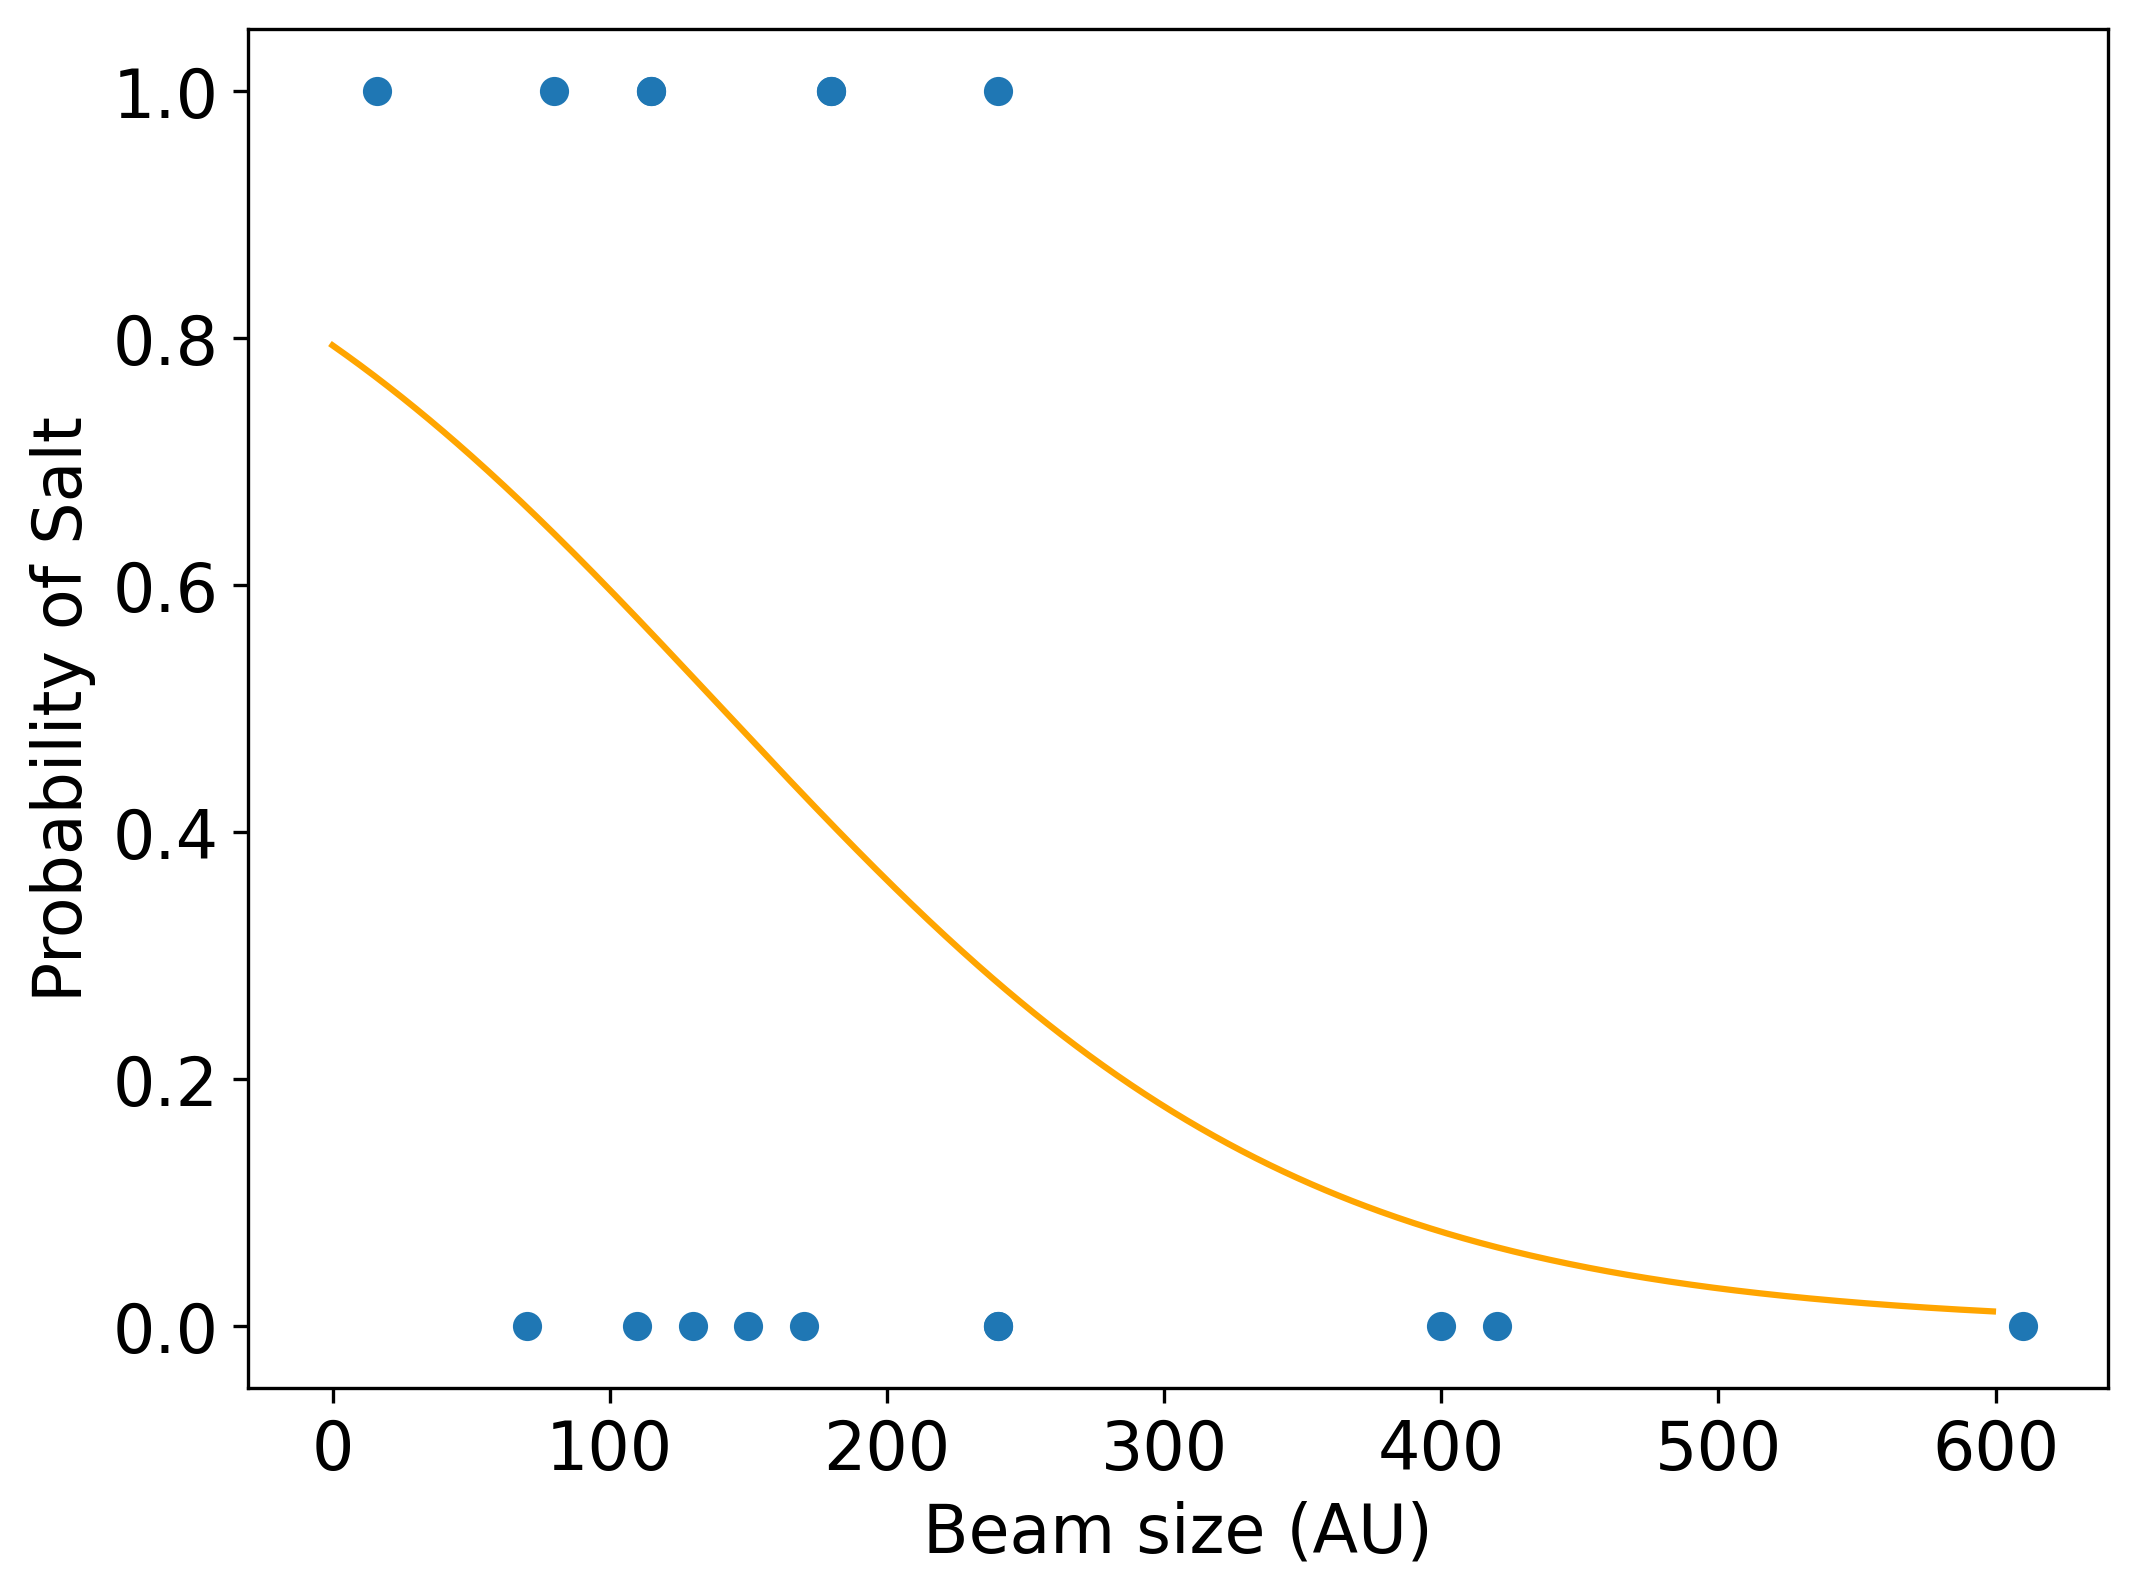
Resolution is a weak predictor of salt detection
What excites salt emission?
Temperature?
Temperature?
Compare VY CMa to Orion: better rotational-vibrational agreement in the old star
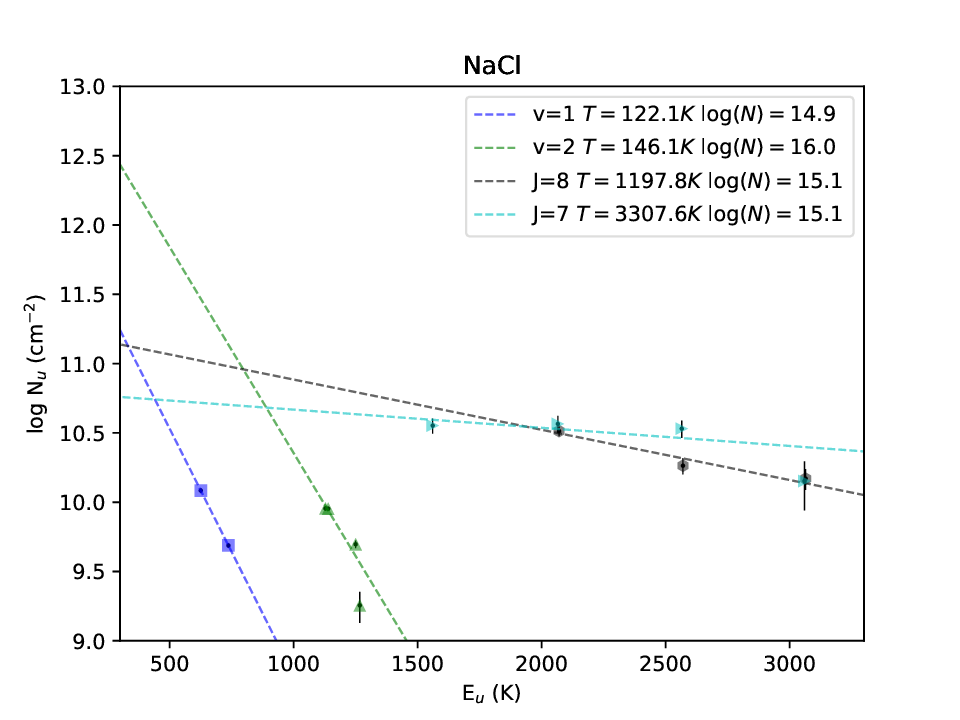
A contrived model
When does salt enter the gas phase?
Depends on the binding energy of NaCl to grain surfaces.Decin+ 2016 suggest thermal desorption will remove all salt from grain surfaces for $T_D > 100-300$ K, depending on assumed binding energy
(this range is consistent with VY CMa observations)
If $T_D>300$ K is all that is required, why do we not see salts in hot cores?
When does salt enter the gas phase?
If $T_D>300$ K is all that is required, why do we not see salts in hot cores?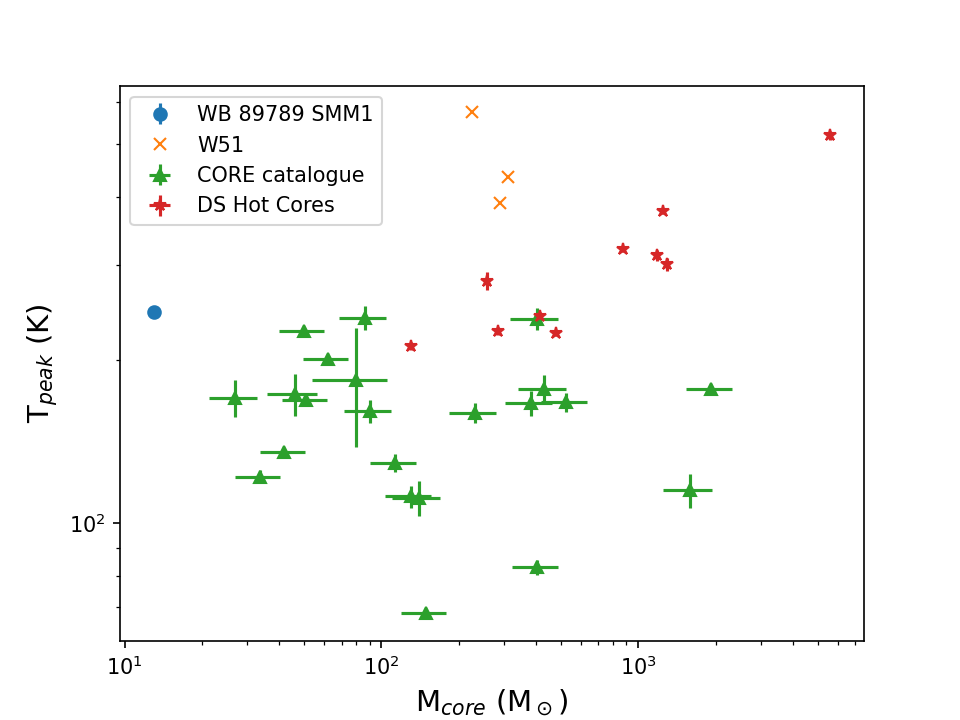
When does salt enter the gas phase?
At atmospheric pressure: T~500-600K (Woitke+ 2018)(no mention of SiS in these models)

Does salt have friends?
NaCl, KCl, SiS, and H2O coincide.(AlO is also present in Orion)
What others might exist in these regions?
FeS? FeO? LiCl? HCl?
Summary
Salt is seen in disks around HMYSOs
- It is correlated with water and SiS.
- It is not seen in the outflow.
- It is uncorrelated with COMs and ionized gas.
- Its excitation is weird.
Questions:
- Where does the salt come from?
- What excites it?
- Why isn't it ubiquitous?
- Where else do we (should we) see it?
- What other species might be coincident?
Observing the Keplerian rotation profile of a disk is the most direct way to measure a protostar's mass
(we can only see the disk, not the star itself)
W51 e2e: Too optically thick at 1mm to measure disk
CS v=0 J=1-0 and v=0 J=2-1 masers may trace the disk?
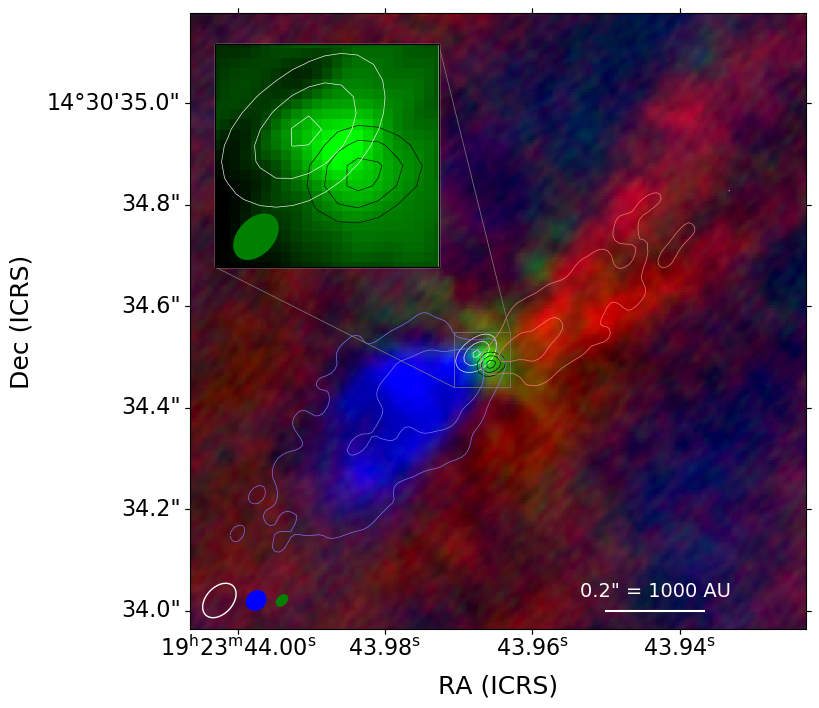
M = 24-10+12M⊙
if the masers trace a disk
if the masers trace a disk
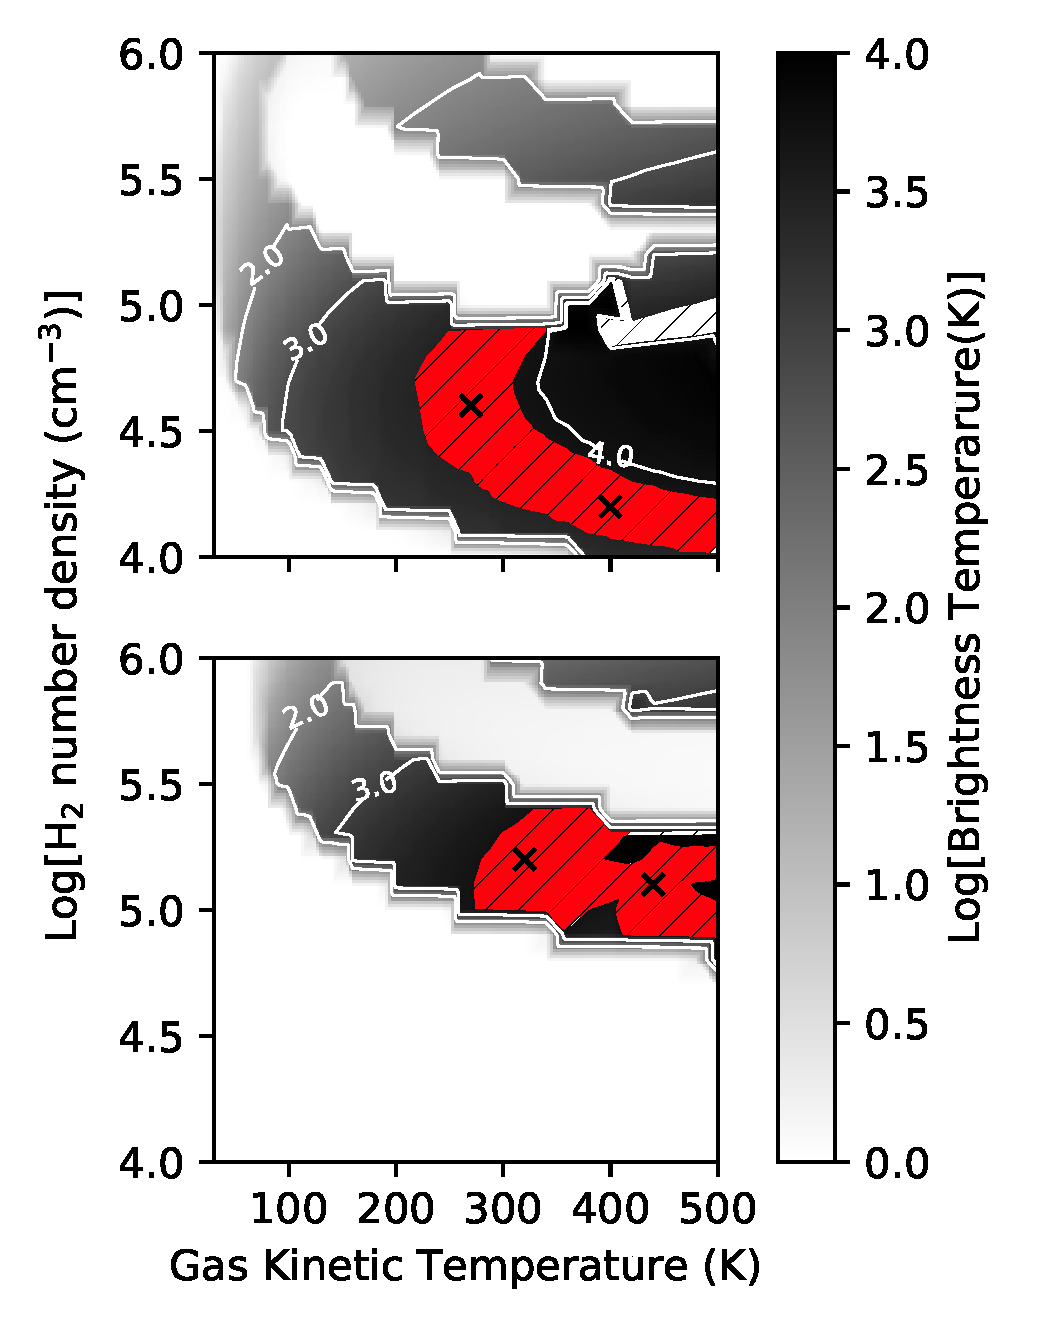
CS maser conditions
van der Walt+ 2020- Top: CS J=1-0, Bottom: CS J=2-1
- Red: Consistent w/W51e2e observations
- Masers do not coexist; require different specific CS column
(N2-1=1015.6, N1-01016.1 cm-2) - Require high abundance (XCS > 10-5)
- Hot (300-500 K), moderate-density (n~105 cm-3): Disk surface? Or outflow cavity wall?
Deep VLA observations of low-J lines in Orion
ALMA-IMF Line Data: SiO
Which sources are accreting YSOs?
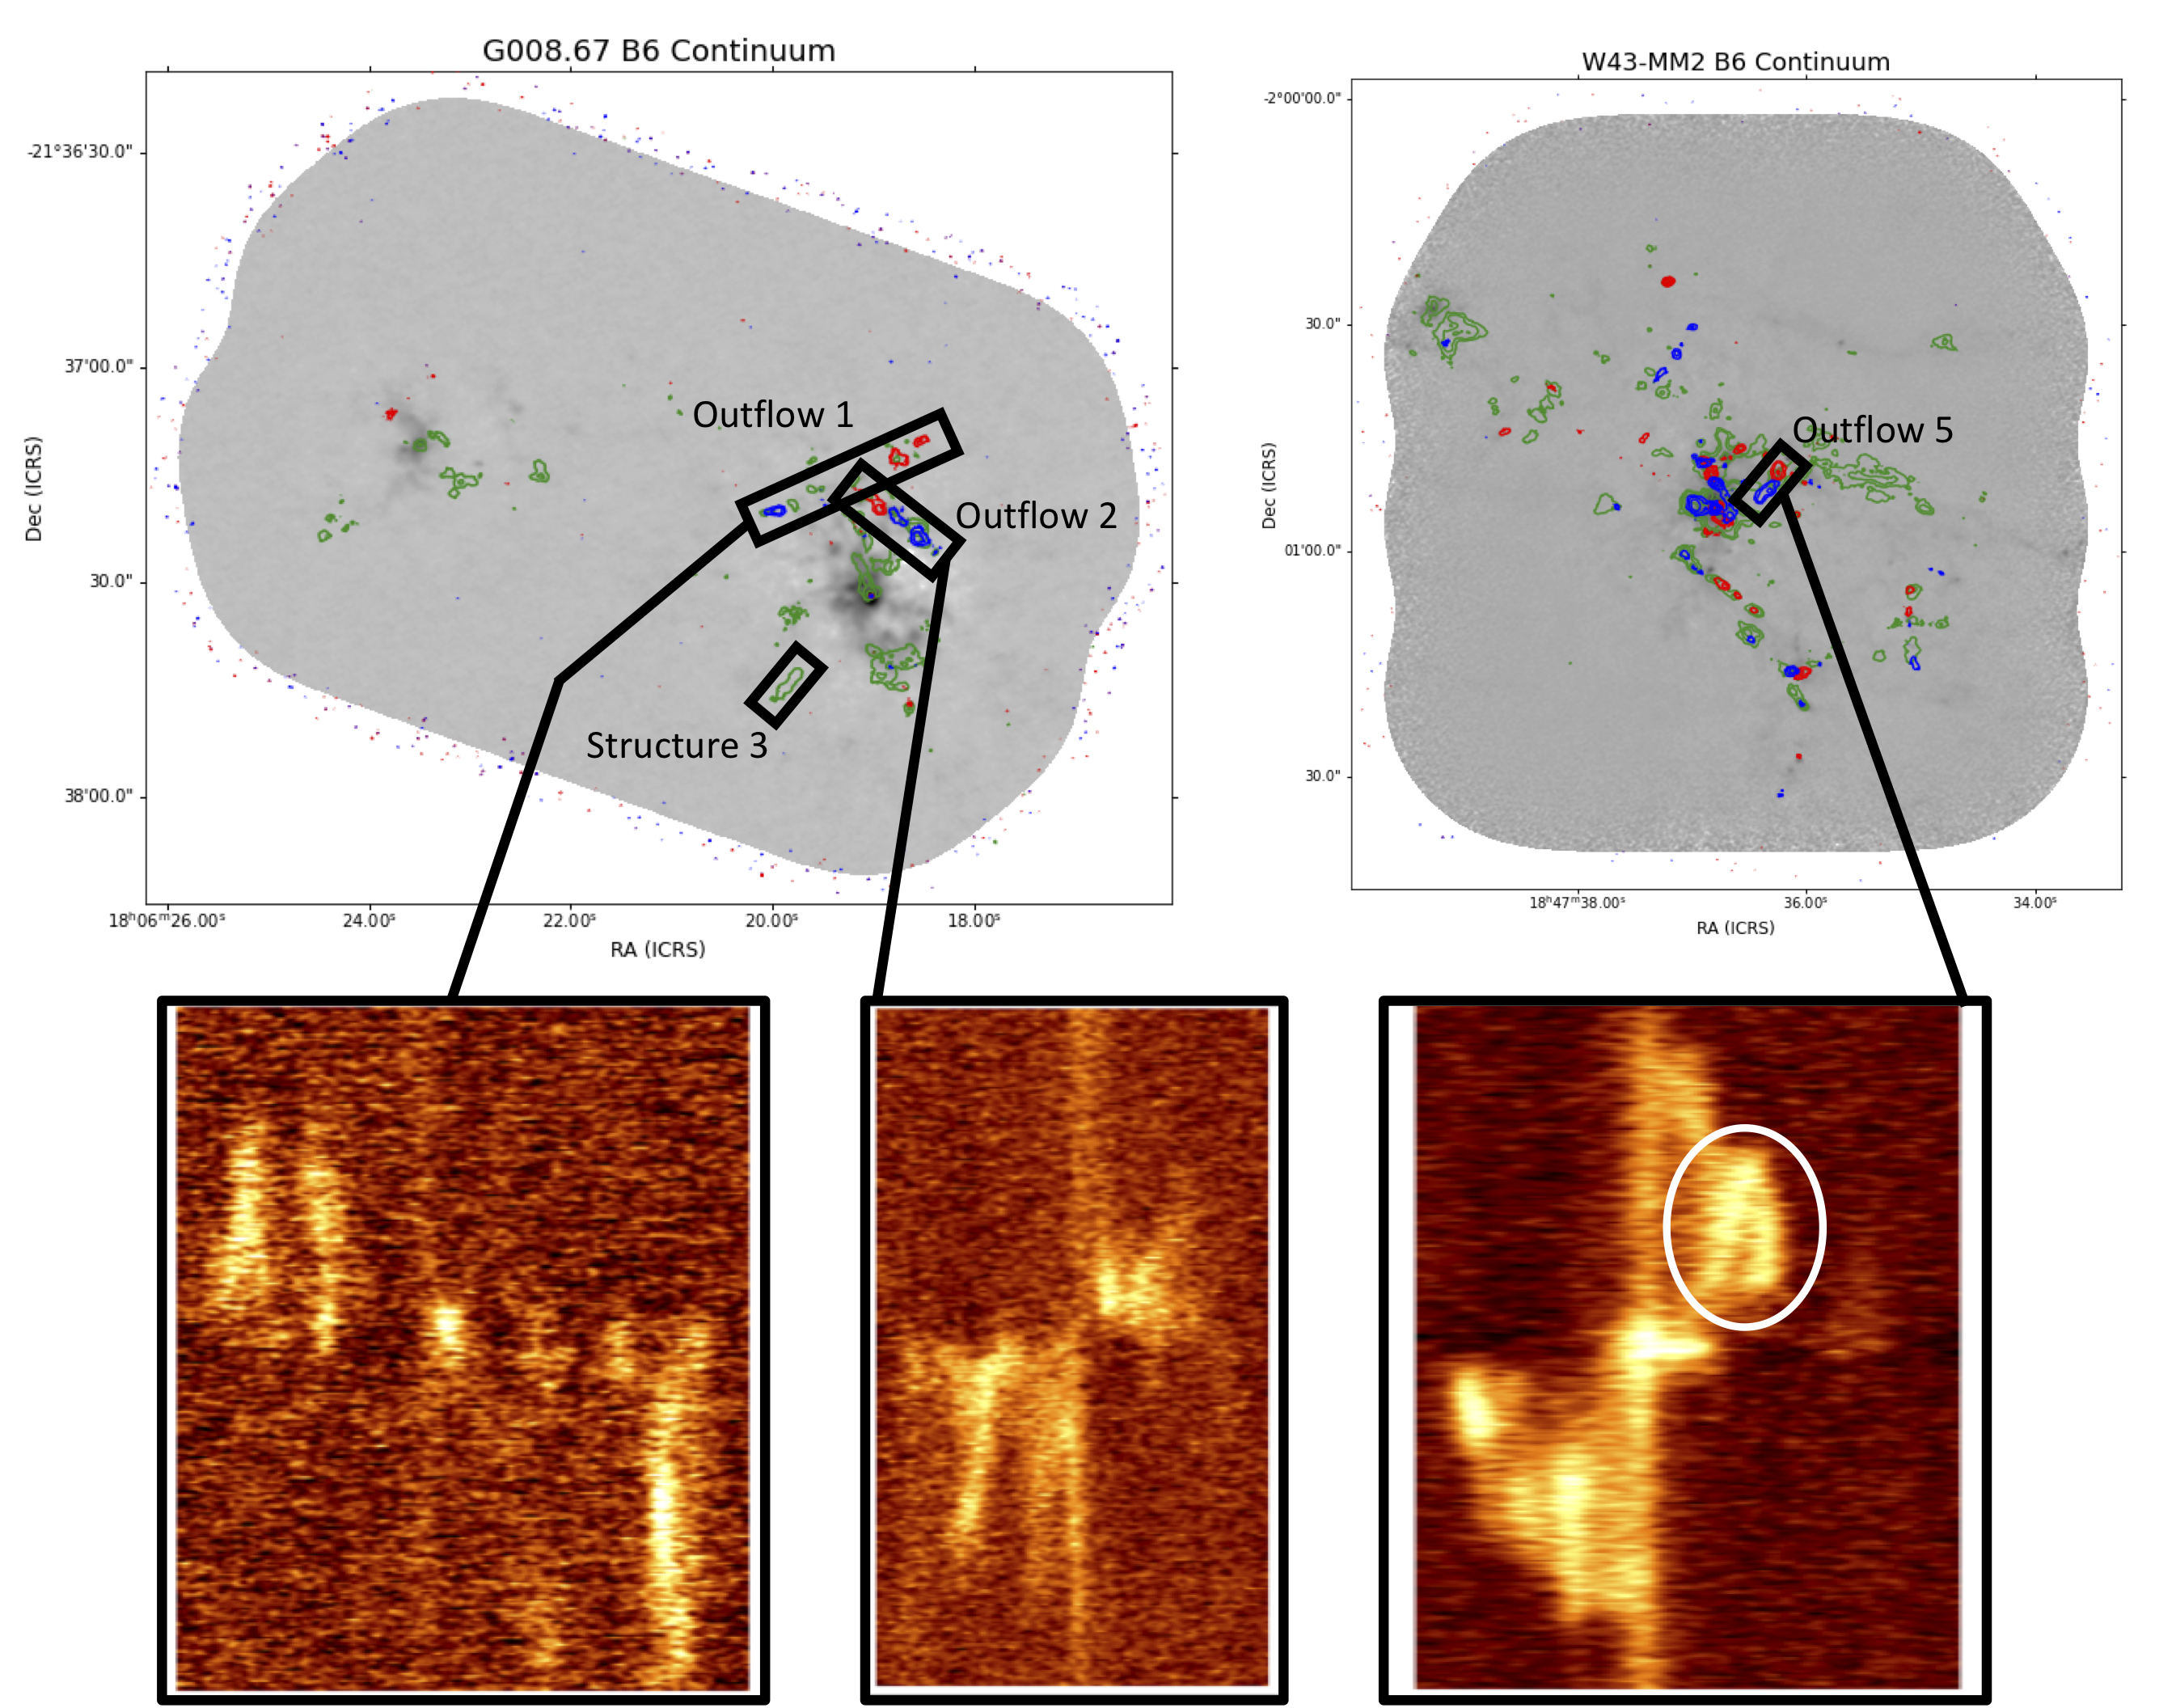
 Allison Towner
Resolved, structured SiO outflows
5-60% of SiO at low-velocities:
Relic outflows?
Relic outflows?
ALMA-IMF Line Data: CH3CN, CH3CCH
Temperature measurements with per-pixel rotation diagrams
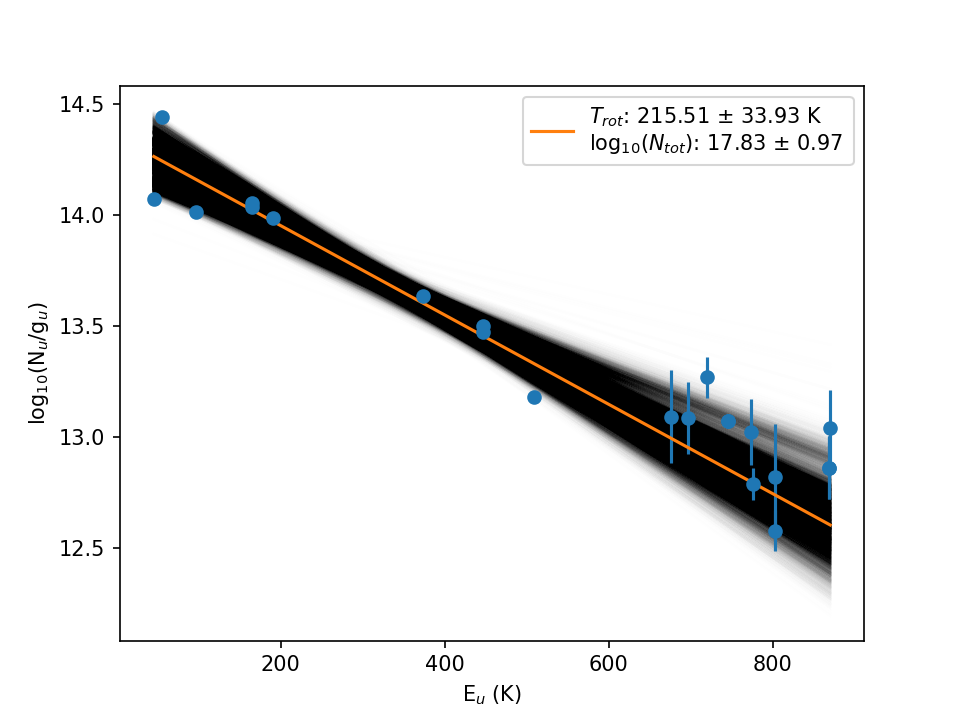
Jeff+ in prep (CH3OH), Wyrowski+ in prep (CH3CN)
Hot cores in ALMA-IMF: From rare objects to a population
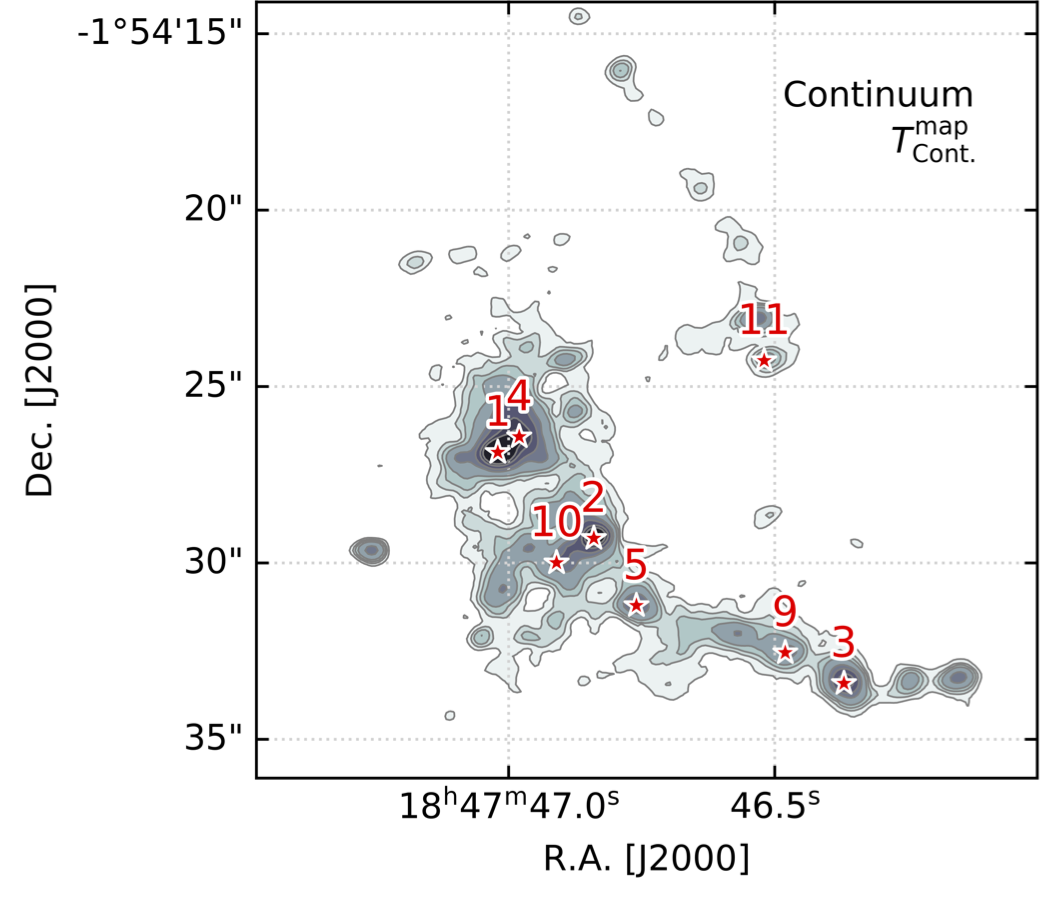
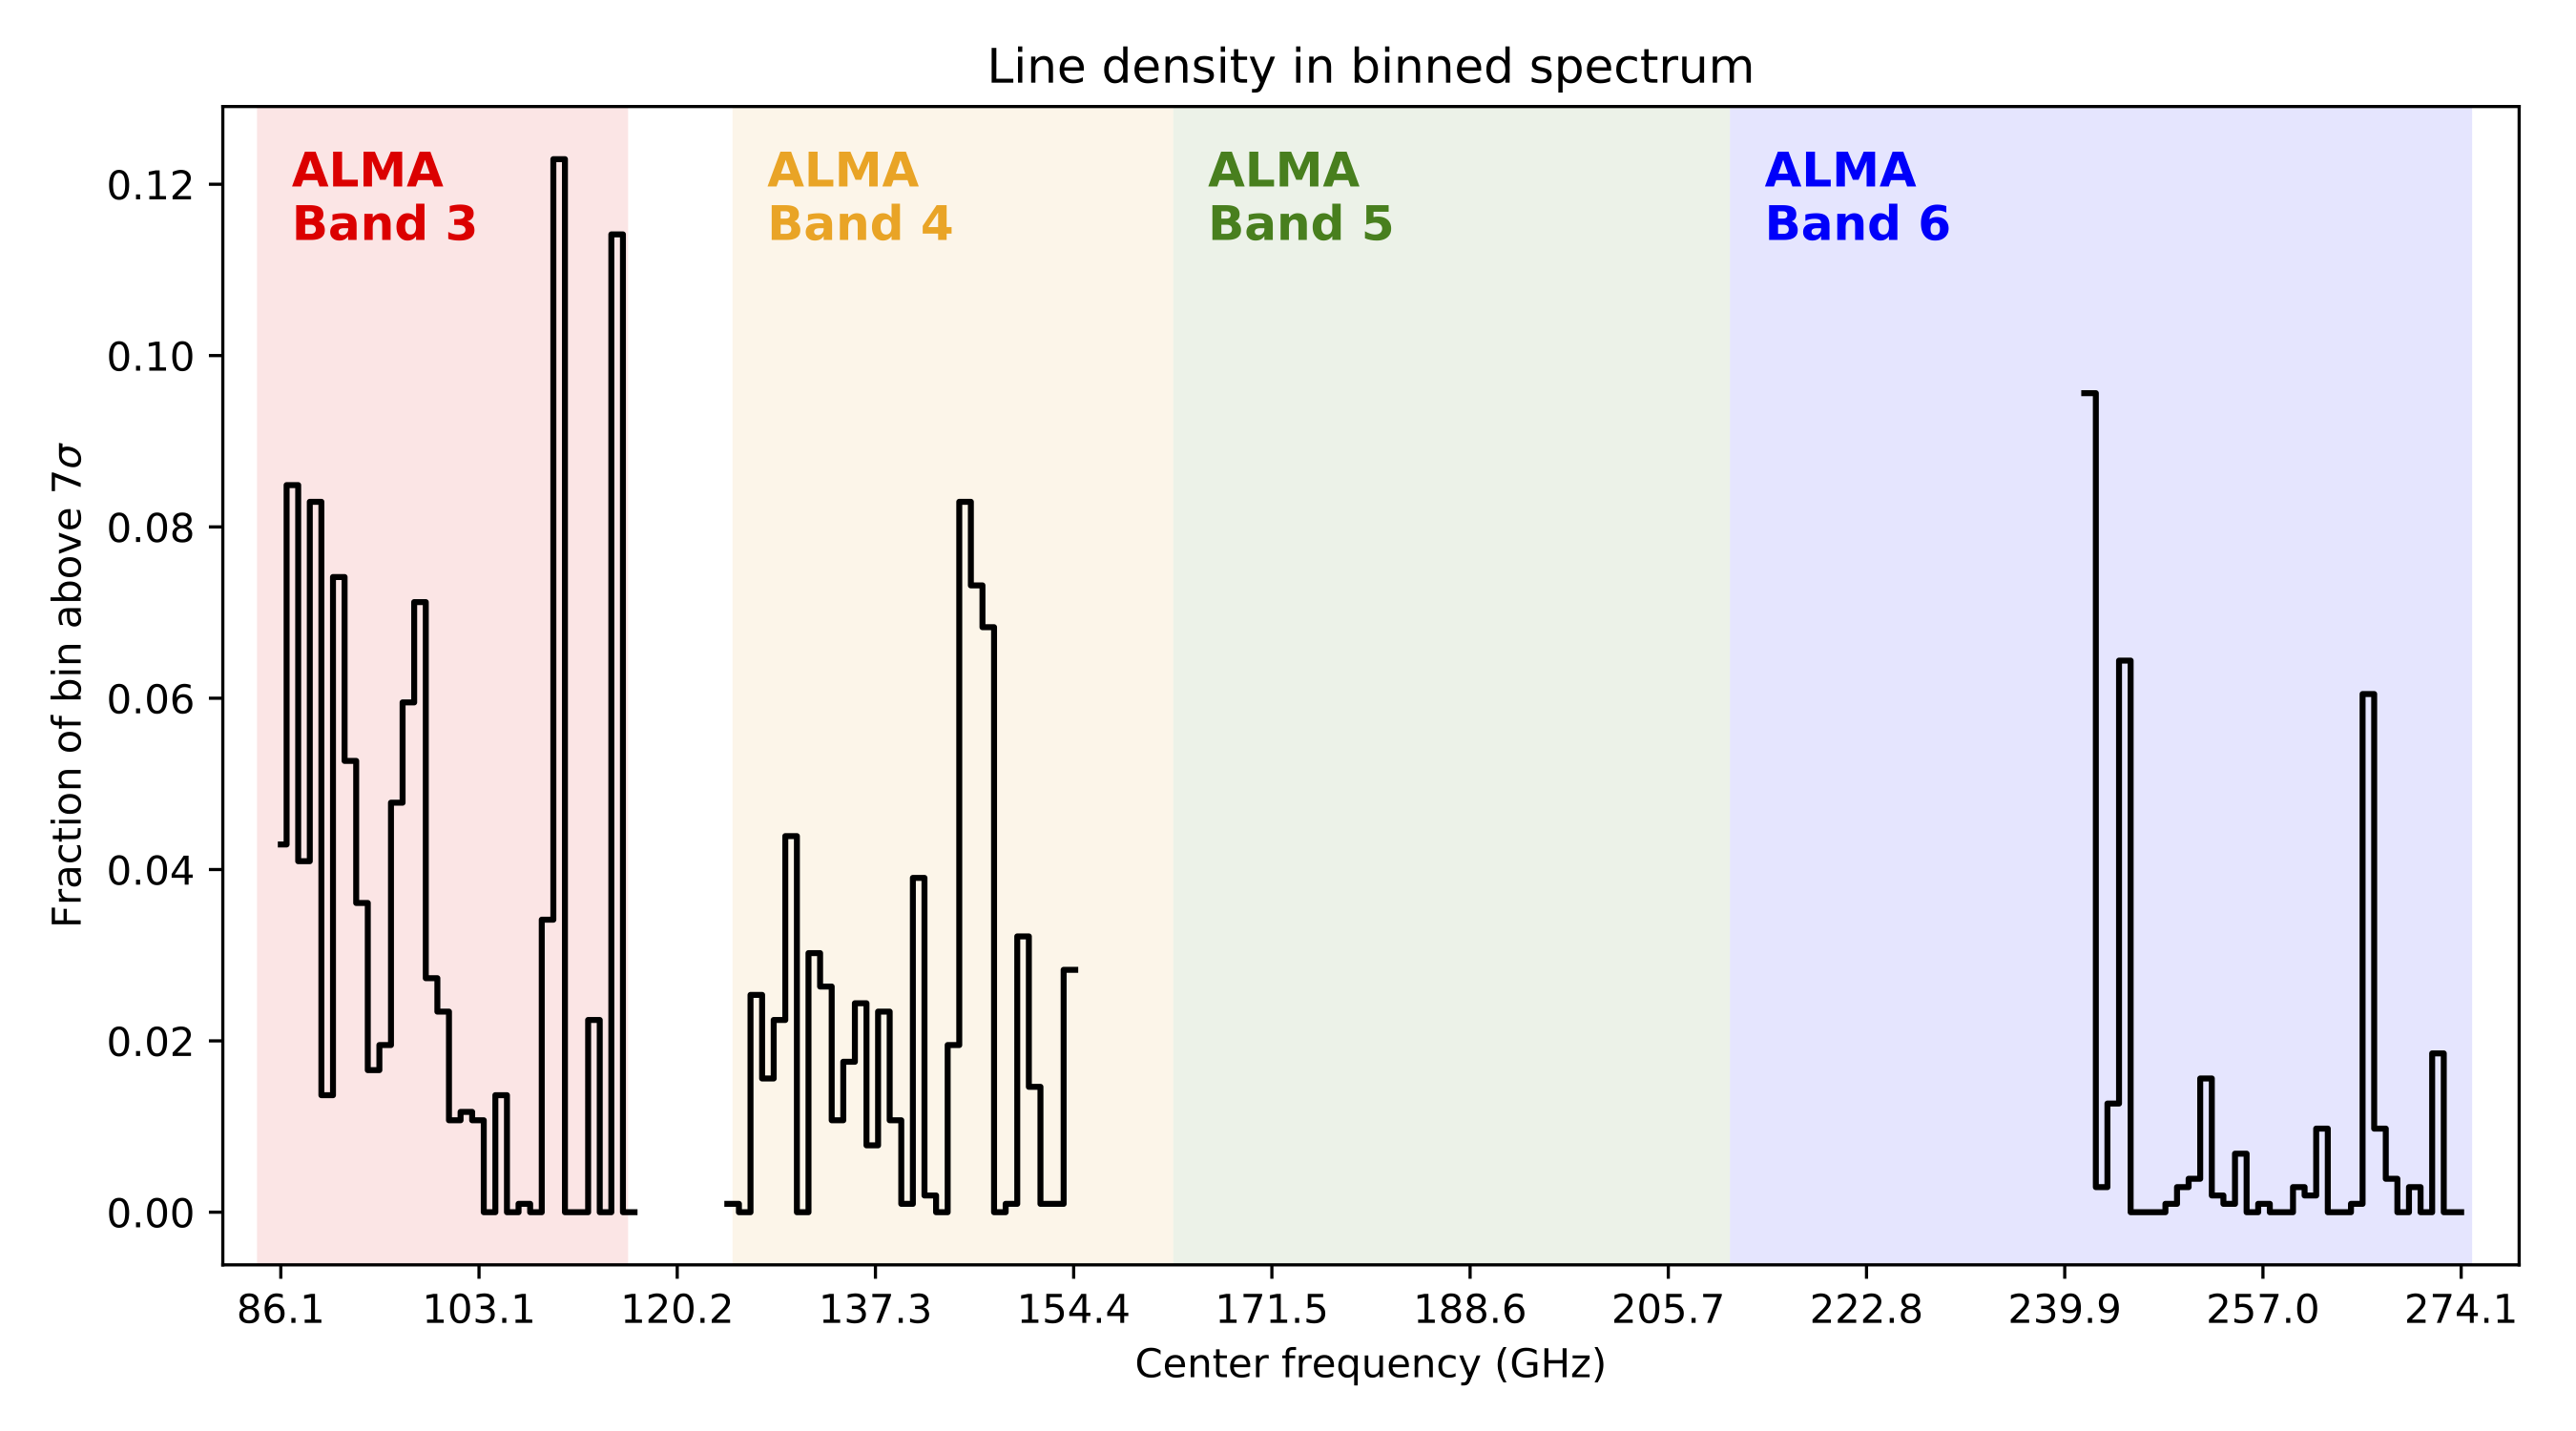
Cores with line forests
TD>50 K
TG ≳100K
TD>50 K
TG ≳100K
Brouillet+, in prep

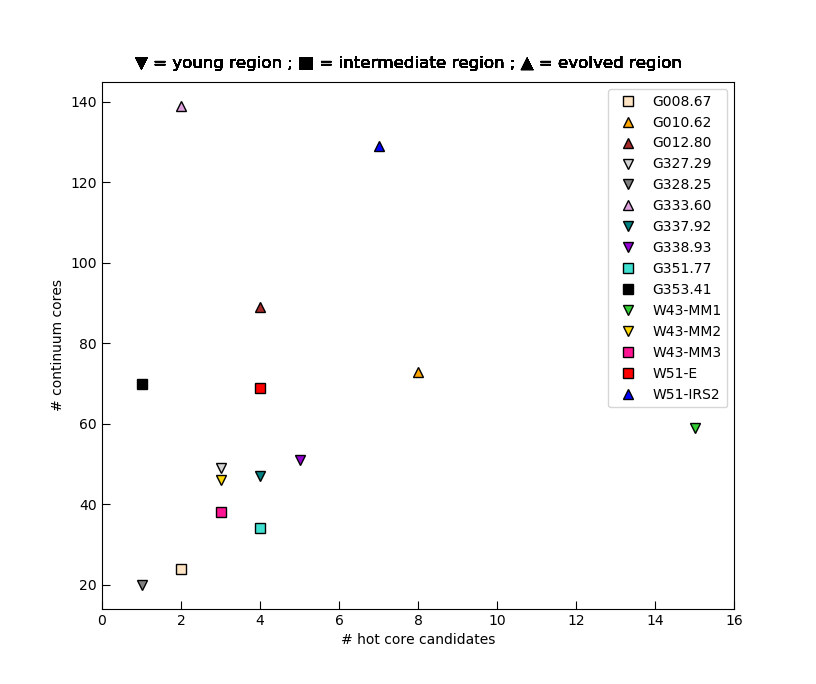
Hot core overview:
A lot is coming
- 11 HCs in W43-MM1 (Brouillet+ in prep)
- ~60-70 HCs in ALMA-IMF sample from CH3OCHO (Bonfand+ in prep; left)
- CH3CN temperature maps (Wyrowski+ in prep)
Hot cores: Also in the Galactic center
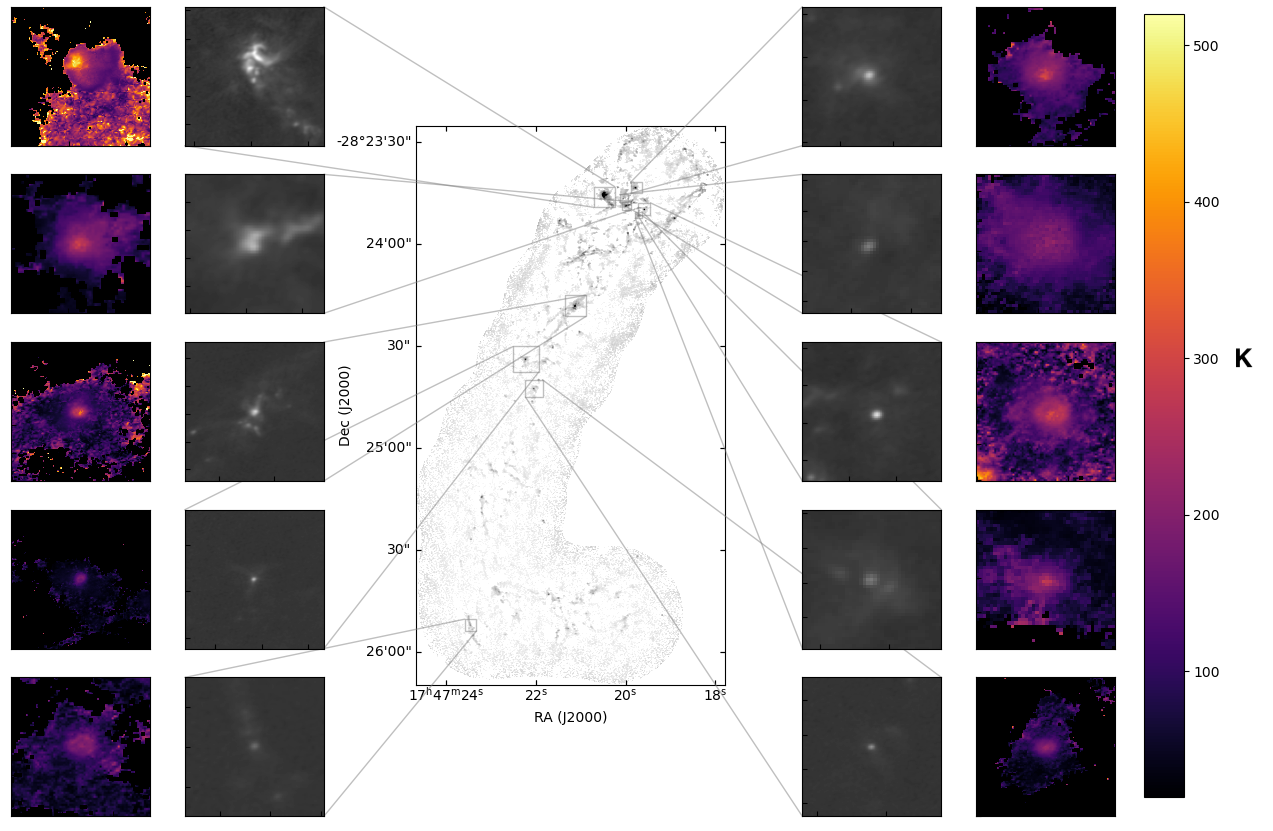
 Desmond Jeff:
Ten hot cores in Sgr B2 DS
TG ~ 200-500 K
M ~ 200 - 2900 M⊙
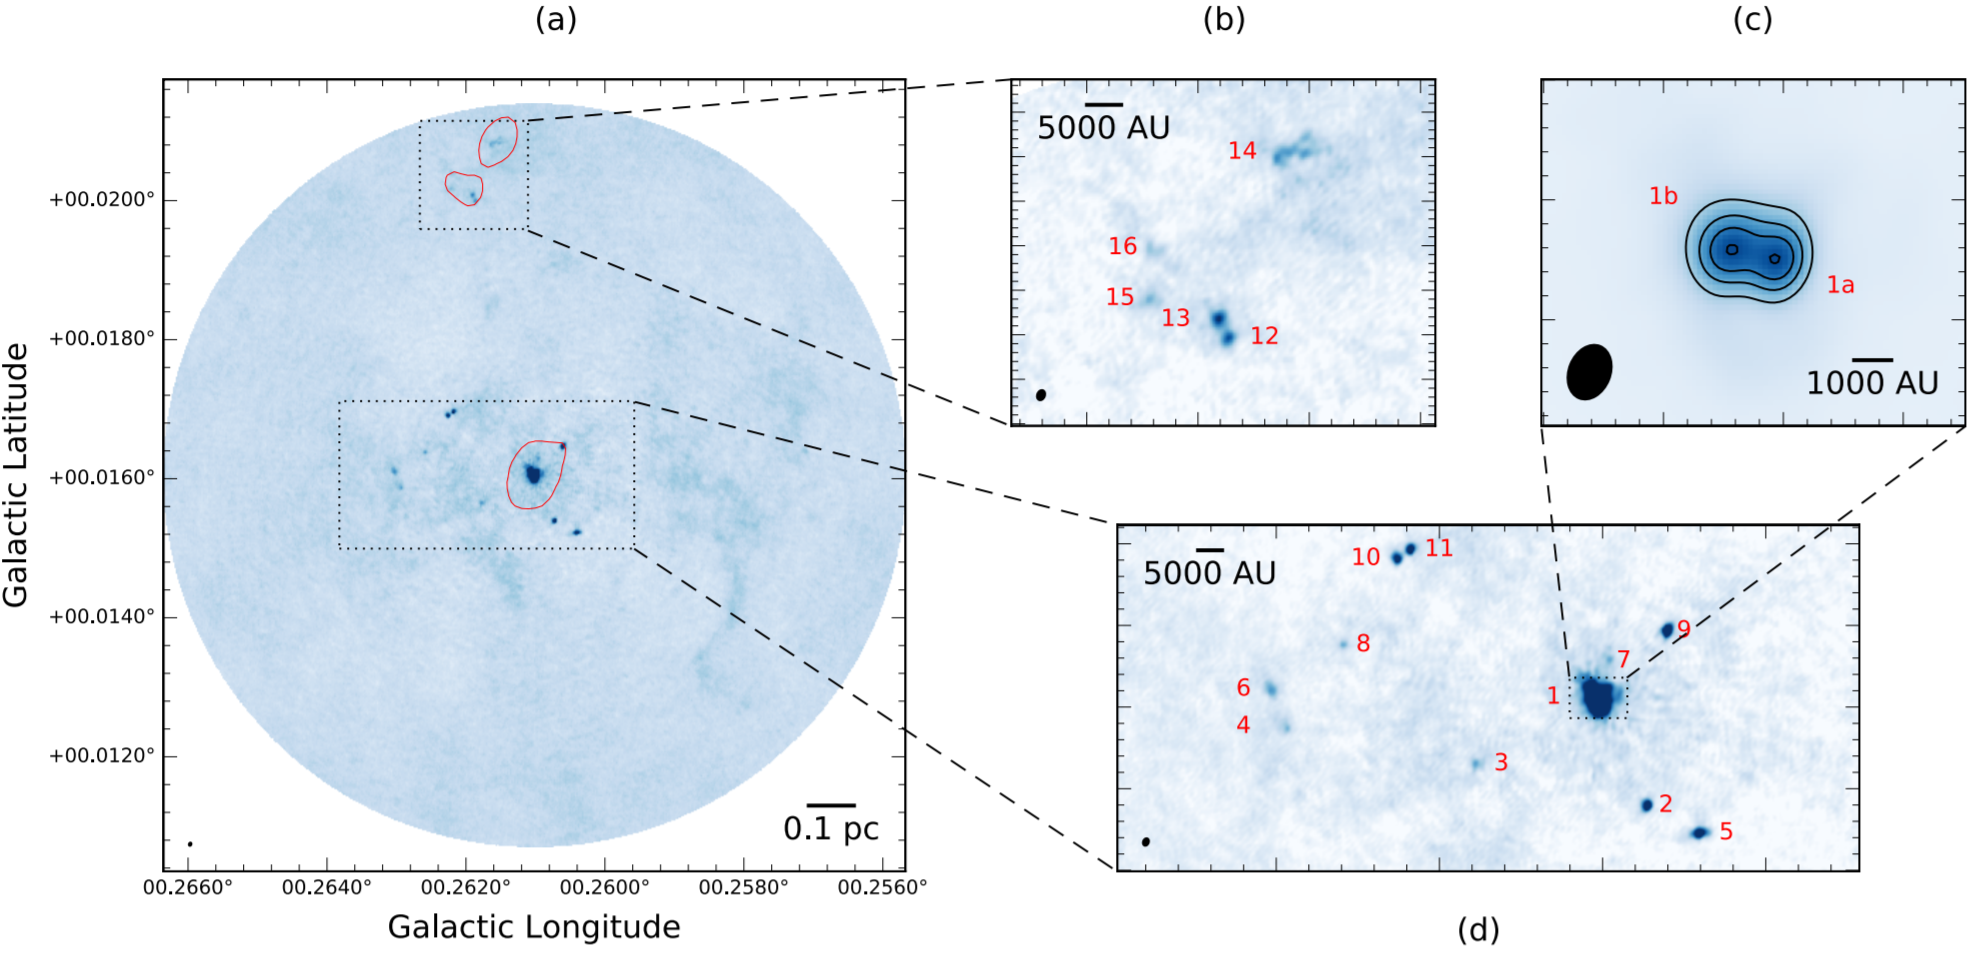
 Alyssa Bulatek: Physical Processes in the CMZ
- CH3CN temperature maps
- Line IDs & abundances
Summary
Most stars form in regions unlike the solar neighborhood
- Greater clustering, higher SF thresholds in denser clouds
- Shallower IMF in richer SF regions
We have, and are building more, tools to measure masses
- ALMA-IMF core catalogs with high-resolution followup & modeling
- Hot cores track the earliest stage of HMSF
- Salt is a new tool to probe disks around high-mass stars
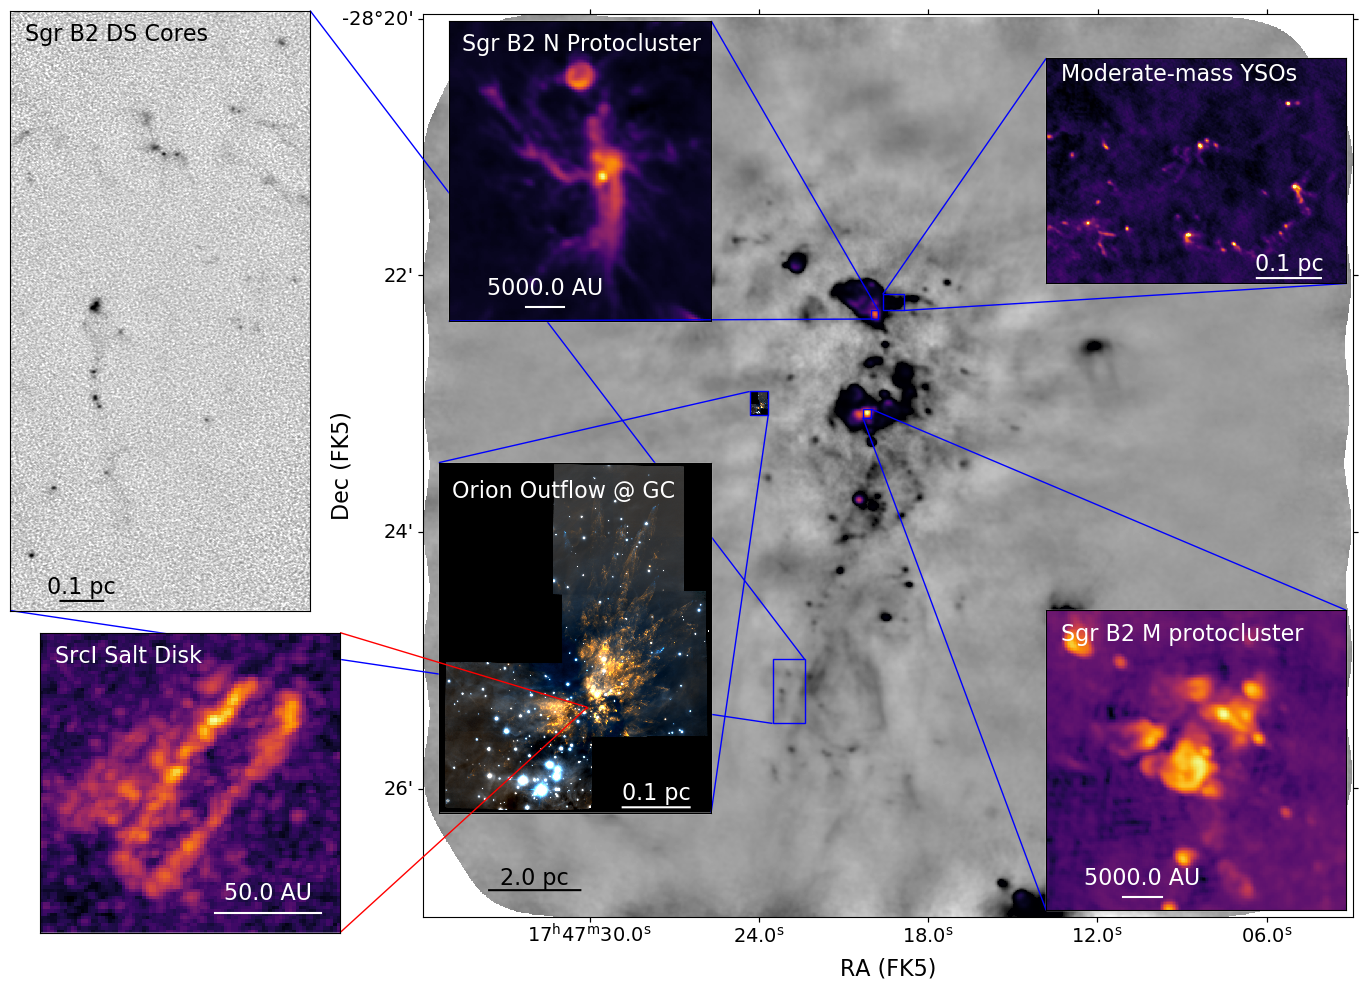
Possible future uses for these lines?
- Metallicity measurement in deeply embedded star-forming environments? (at least of Na, K, Cl)
- Disk kinematics of high-mass stars, which are otherwise unobservable (τ>1 at mm wavelengths)
- Disk kinematic measurements at early stages?
- Probe dust destruction (and/or formation?) in outflows, disks?
- Probe radiation environment around HMYSOs?
Why do we see salt?
- Previously, NaCl & KCl only in AGB* atmospheres,
associated with dust formation - Most likely dust destruction here
Dust destruction happens immediately as the outflow is launched? - What about excitation? We see vibrationally excited lines, which are not seen in AGB*s
We do not have a viable model to explain these temperatures
A strong non-blackbody radiation field from 25-40 µm may explain them.
Forsterite (MgSiO4) has some emission bands in that range. Maybe?
Looking forward:
- PASHION: Paschen Alpha Survey of Hydrogen Ions
- JWST: Deep Paα, Brα, and broadband imaging


PASHION: Paschen Alpha survey of the Galaxy
Team:
- John Bally (CU)
- Elizabeth Lada, Steve Eikenberry (UF)
- Students: Alyssa Bulatek, Michael Fero, Nazar Budaiev
- Lockheed Martin (Alison Nordt, Gopal Vasudevan)
- Tony Hull (UNM)
- York Space Systems
PASHION: H2RG with Lockheed electronics, three narrow-band filters, 2.5" resolution, 25' FOV
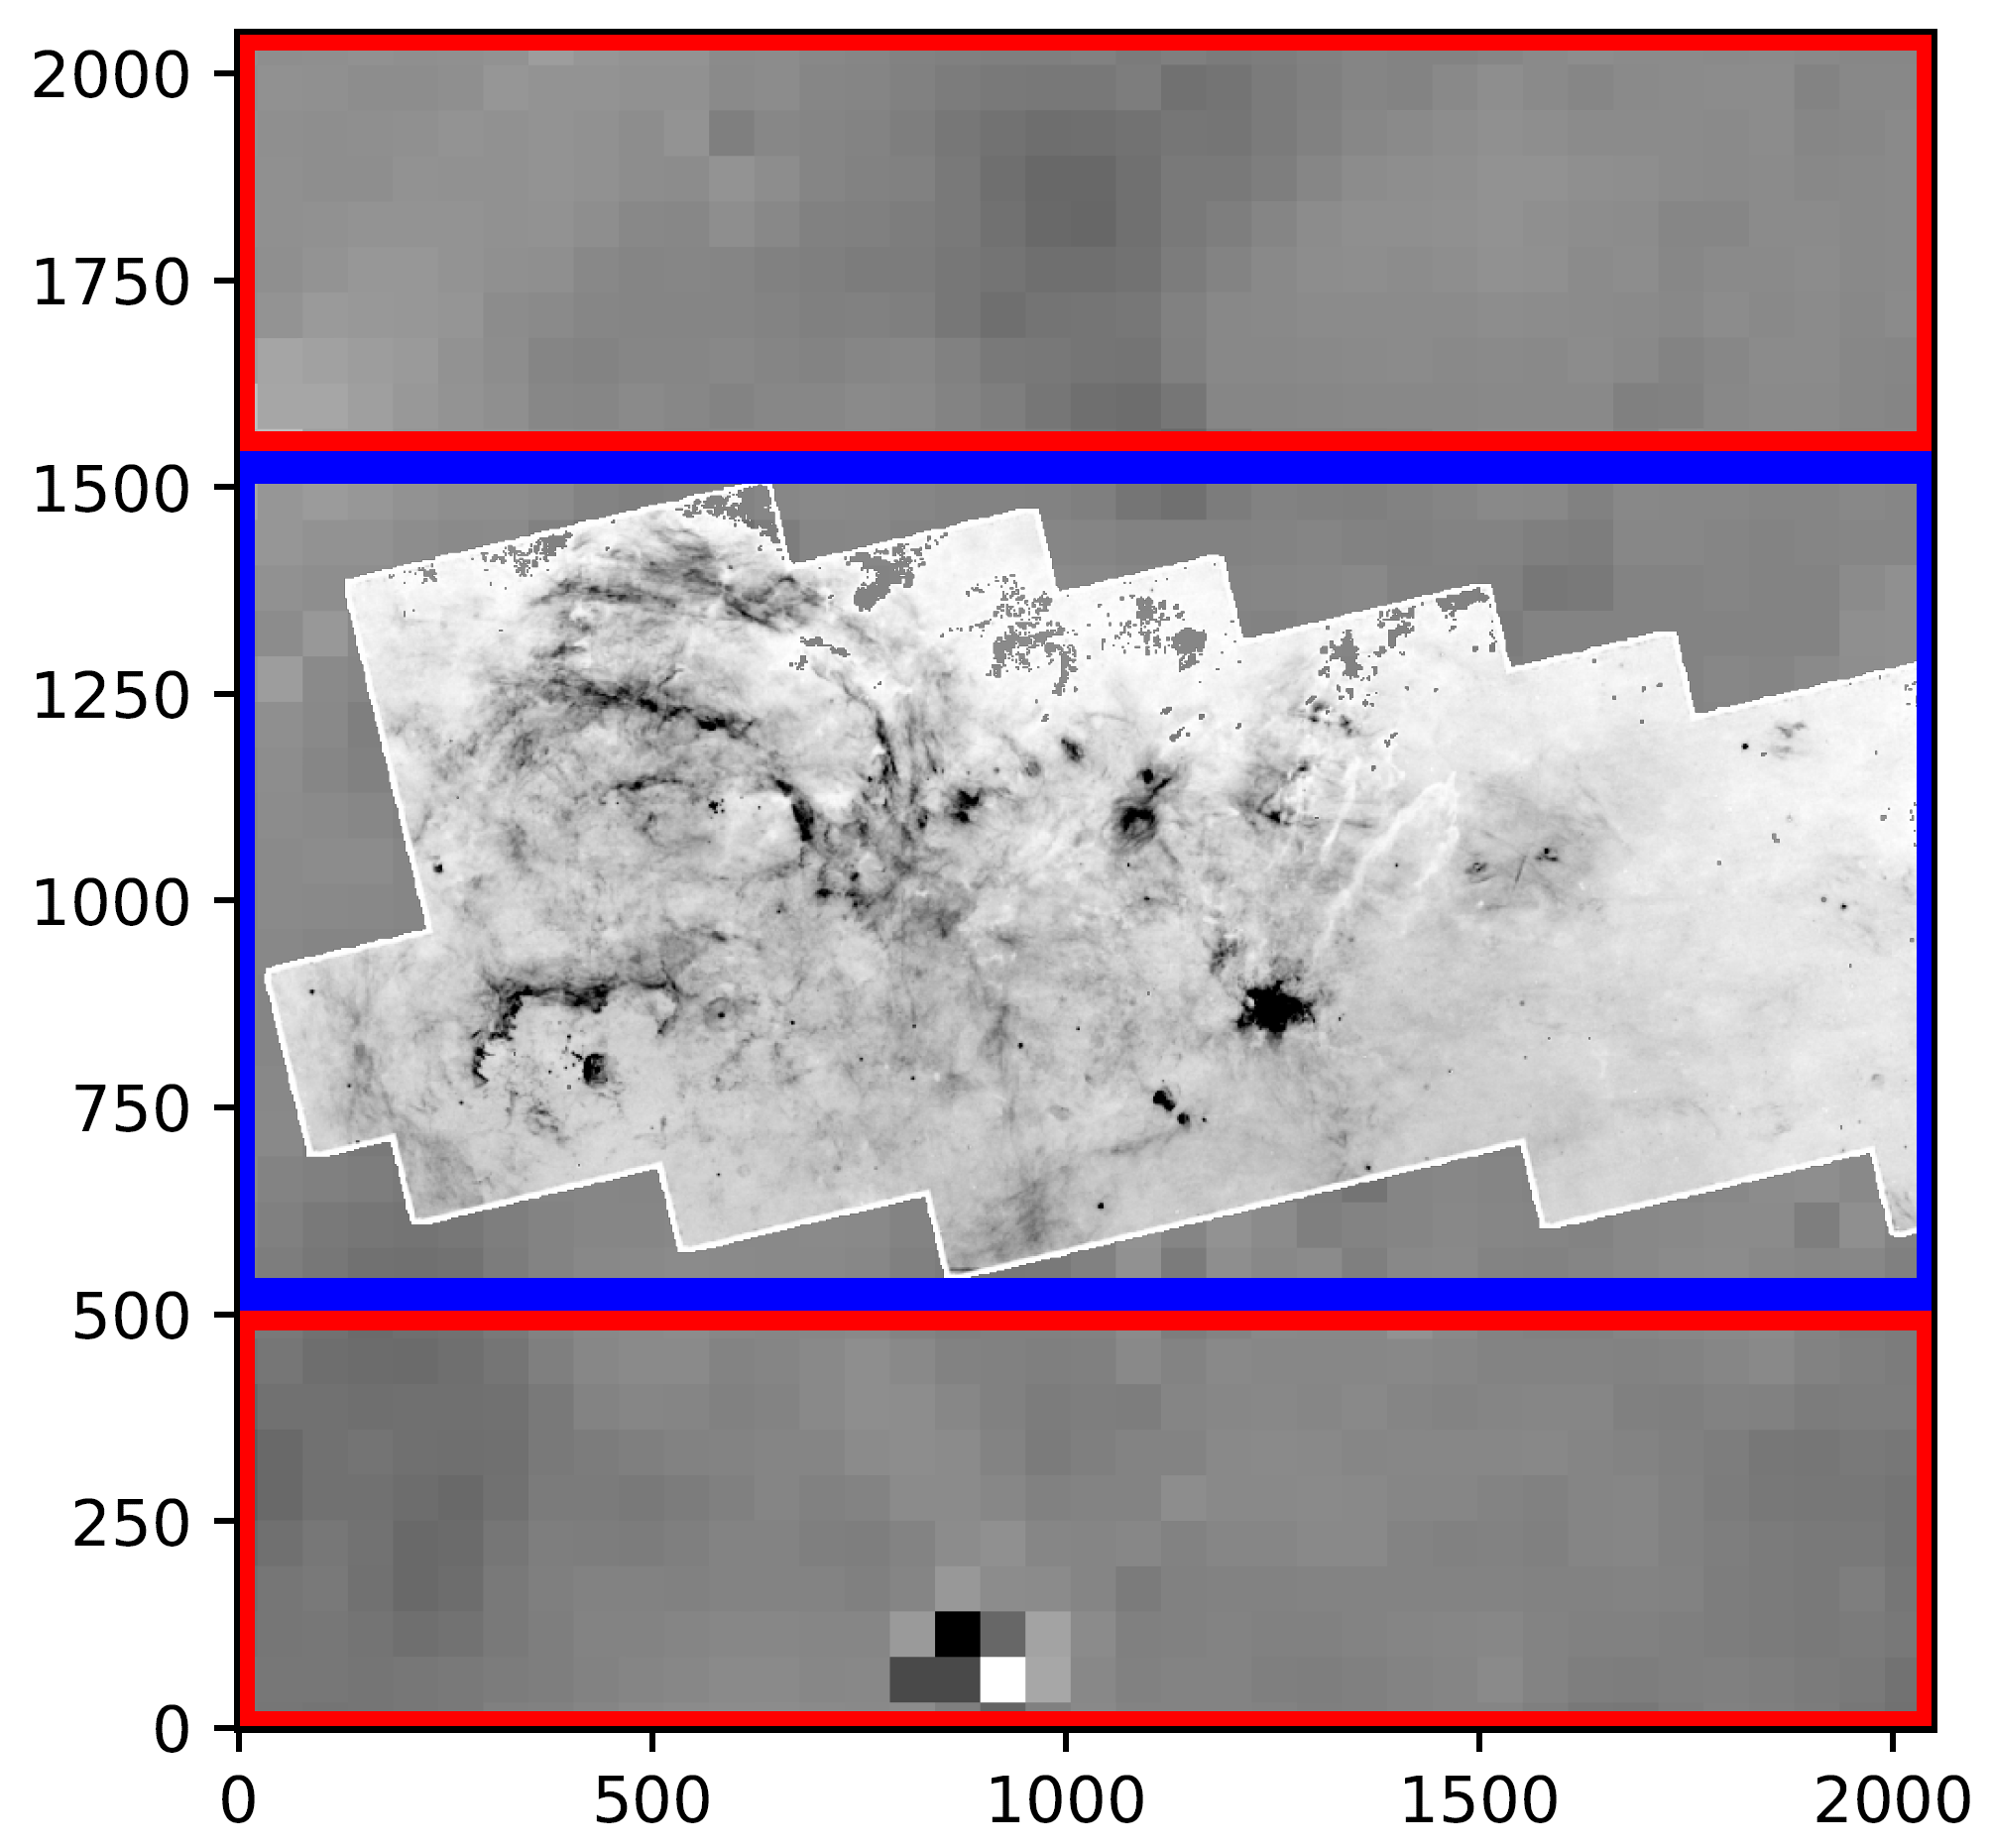
A 24 cm dedicated survey telescope will be the most sensitive Galactic plane survey of ionized gas
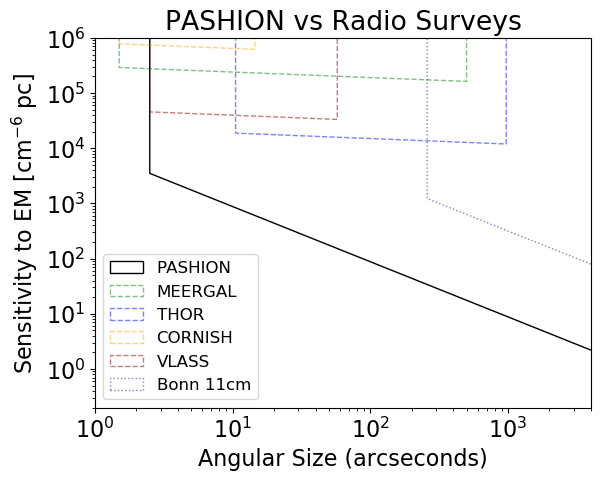
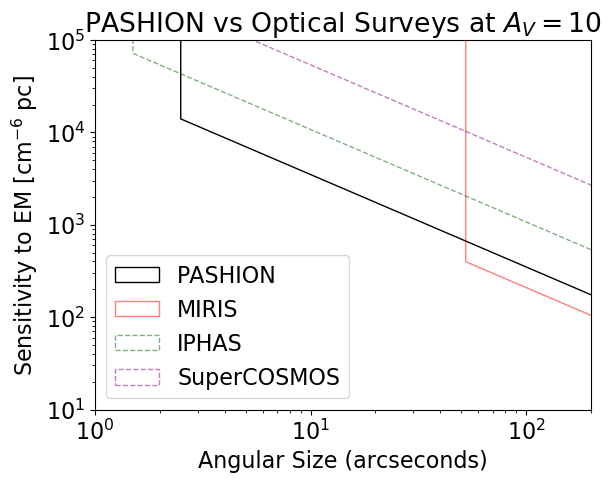
These are fiducial numbers for a 1-year mission performing a 100 square degree blind survey. An extended mission may be possible.
PASHION, and JWST, recombination line science
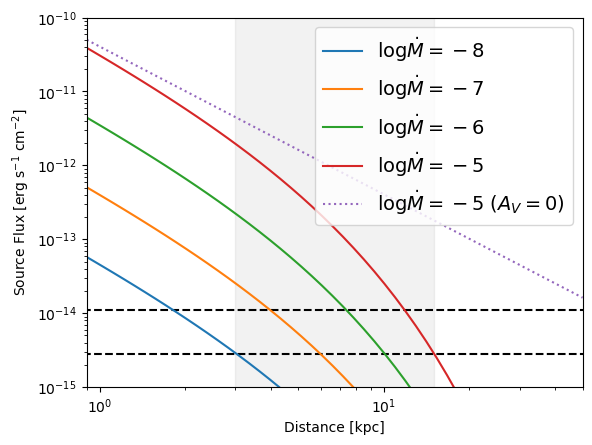
Accretion onto YSOs

HII regions
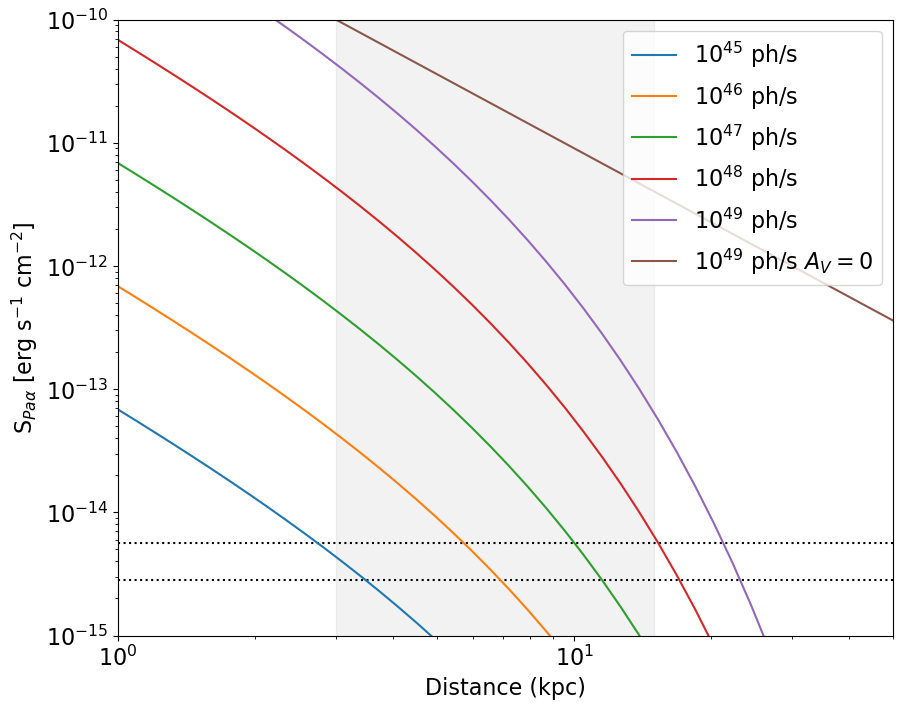

Assuming typical AV~2 per kpc
How is star formation in high-mass clusters different?
- Feedback from one star affects many in clustered regions
- IMF depends on density, feedback, global conditions (e.g., Jones & Bate 2018, Narayanan & Dave 2012)
- Total star formation efficiency is higher.
- Collisions assemble the most massive stars?
(e.g., Fujii+ & PZ 2013, but see Moeckel & Clarke 2011)
Cartoon of high- and low-mass star formation
Main difference: massive stars affect their surroundings
Classic HII region feedback:
O-stars clear out their environment
Accreting massive young stars affect their environment
Accreting massive young stars affect their environment
Accreting massive young stars affect their environment
The characteristic fragmentation scale
The Jeans Mass MJ is the mass where gravity and thermal pressure are balanced.
MJ ∝ T3/2 ρ−1/2
The characteristic fragmentation scale is larger
Jeans Mass
MJ ∝ T3/2 ρ−1/2

Feedback affects dense gas
ALMA + VLA + GBT together give multiple temperature probes on multiple scales.
High-mass protoclusters are filled with gas warmed by feedback.
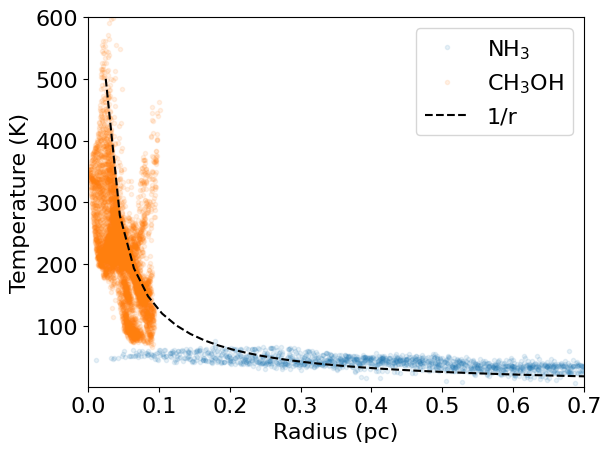
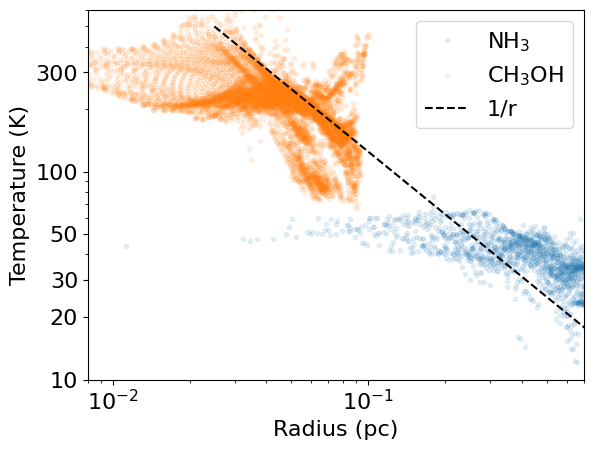
Ginsburg+ 2017, Machado+ in prep

YSO disk counts in W51
The cartoon in the context of HMSF
These high mass cores suppress low-mass star formation (LMSF) in their vicinity.
They reduce or prevent LMSF in the cores of stellar clusters.
More extreme: 'cooperative accretion'
With enough high-mass stars forming concurrently, massive stars may prevent fragmentation entirely.
If they still have enough gravity to bind the gas, the remaining gas is forced onto the most massive gravitational sinks.
If they still have enough gravity to bind the gas, the remaining gas is forced onto the most massive gravitational sinks.

Ammonia Masers
Large scales again:
What governs the star formation rate?
Turbulent ISM models
Turbulent ISM models
Turbulent ISM models

Measuring Line Profiles
SCOUSE uses pyspeckit for manual fits. Gausspy+ is machine-learning trained. We're exploring more automated approaches. ALMA enables protostar counting in
distant, massive clouds
Sgr B2: the most massive & star-forming cloud in the Galaxy
How do we learn about clustering? The IMF?

- Count objects:
- Cores are (sometimes) countable
- Protostars are countable
YSO counts let us investigate thresholds
Local cloud studies support the idea of a gas density threshold for star formation
Thresholds are used in simulations to say
"if gas reaches this density, turn it into stars"
"if gas reaches this density, turn it into stars"
Compare YSO counts in Sgr B2 and the CMC
Is there a threshold?
Is there a threshold?
A threshold separates Sgr B2 from The Brick
Jeff+, in prep

Walker+ 2021
3mm Luminosity Function
What are the sources?
At this sensitivity, all are M>8⊙ YSOs