tl;dr version: IPython notebook here, code available on github
Current state of affairs
Position-velocity diagrams with arbitrary position axes have been a common tool
for studying spectra for a long time, probably because the "native" format of
long-slit spectra on CCDs is effectively a position-velocity diagram.
It's becoming more common now to have data cubes (PPV) than 1D or 2D spectra.
But PV diagrams still have utility. Unfortunately, there aren't very good
tools to produce them.
There are plenty of tools that can slice along any of the native axes of a data
cube. If you take your data cube in RA/Dec space, extracting along lines of
constant RA or Dec is trivial (GAIA can do it natively, but it's easy to
slice a cube in IDL or python).
However, if you wanted to slice along lines of constant GLON or GLAT, you'd
have to reproject the cube to use this approach. There are nice tools that
implement cube rotation: CASA has an imrebin recipe and STARLINK has a
rotation tool (though I can't find it now...).
However, this approach is terribly inefficient if you want slices at multiple
different angles, and it's outright awful if you want to track a filament.
An alternative approach
The alternative is to interpolate between pixels along a specified axis. This
can be done very efficiently in python using scipy's map_coordinates, which
by default does a cubic-spline interpolation at the specified points.
I've started to build a tool to extract position-velocity diagrams on this
basis. It's fully functional, but doesn't do anything interactive just yet.
pvextractor is available on github.
There is a complete example demonstrating its use here.
In short, though, it allows you to describe paths like this:
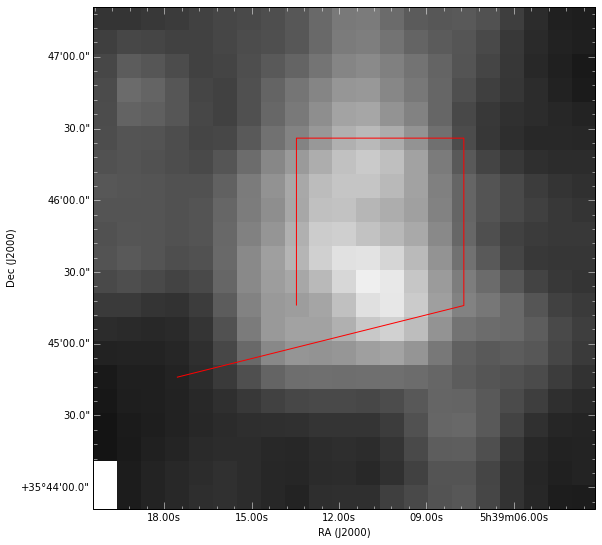
and extract them into position-velocity diagrams like this:
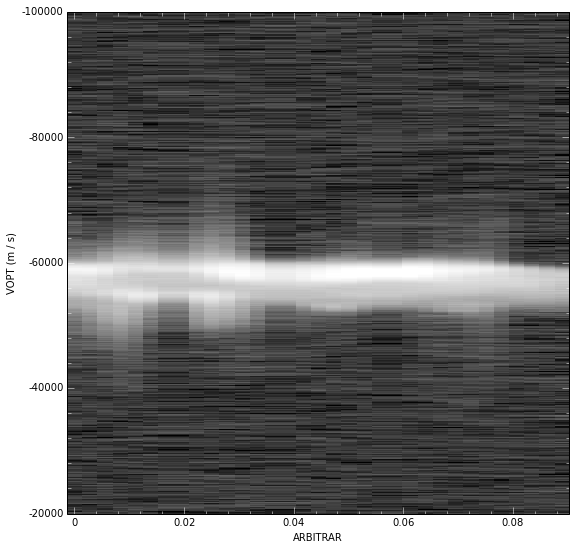
Postscript: Figshare
(note: postscript as in "P.S.", not ".ps")
In order to create the example document (here), I needed a small data cube
that could easily be downloaded. Dataverse hosts the COMPLETE survey, but
they make you jump through a javascript hoop to download their data, which
means that it is not possible to write an easily reproducible script. Too bad,
since I would have used them except for this minor interface issue.
Instead, I've found that figshare has fixed up their interface since I last
used them. It was easy enough that I decided to upload my IRAS 05358+3543
data cubes and had no trouble at all. I also posted an update to the arxiv
page for the article indictating that the data are freely shared. I'll do my
best to share the data for the rest of my papers too, though it will take some
time and I'll hit data limits for W5 pretty quickly.