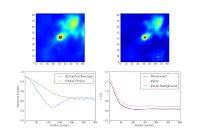
Aperture Photometry on isolated and not-so-isolated sources in the Herschel-based BGPS simulation using the L=111 field for the "noise". Depending on the aperture, our flux recovery can be really really low. The images should give an idea of the S/N. Background subtraction means subtracting the median of the image.... it works frighteningly well in most cases.
Articles by Adam (adam.g.ginsburg@gmail.com)
Pipeline Flowcharts
In the process of hunting down a supposed calibration error, I determined that it was necessary to generate a more intuitive graphical display of the pipeline. Hence, pipeline flowcharts (generated in keynote). The key should be self-explanatory to the degree that any part of these charts is understandable to an outsider. The yellow boxes represent wrapper scripts/functions while the rounded box bubbles show individual functions within these wrappers and their interrelationship.
Minor mystery resolved: Perseus cal curve
When I started working on the Perseus data again, I decided to use the Enoch 2006 calibration curve directly. However, it has a very different form than all other epochs. The reason, as revealed below, is that it was not forced through 0,0. Additionally, all of the BGPS data was observed with mean DC ~ 2-3 V, while the Perseus data was observed with mean DC 4-5 V, so the relevant regime is in a very different location. The reference DC bias was much lower, ~2.15 V vs. 4.6 V in the 2005-2007 BGPS and 2.6 V in the 2009 BGPS.
Minor mystery solved
RELEASE
Finally. http://irsa.ipac.caltech.edu/
Eimers project
Project for Marc Eimers: Determine velocities to molecular clouds by a variety of methods. Start with l=30 1. Find archival data, particularly from the JCMT, for each core. 2. Compare morphologically to 13CO from GRS 3. Find Vizier data
locating beams
White - "Default", OP-calculated beam-locations Red - My code's beam locations Yellow - Boloparams, the fiducial beam locations
Gem OB1 comparisons
I'm running 0,1,2,3,5,7,10,16, and 19 PCA component 51 iteration maps of Gem OB1 with deconvolution. No clue when they'll be done because they're at the end of a long queue. Next (important!) step is to re-run the simulations with linear source sizes but with different numbers of PCA components, different kernel sizes, etc..... there is a LOT of parameter space to cover.
A detailed look at l086
Despite a slew of alignment errors, it appears that the alignment for MOST fields turns out OK using Method 3 of the pixel-shift code; the signal to noise is VERY low in a lot of fields. 070724_o38 does not come up with a good fit, for very good reason - there appears to be no signal at all. 070907_o20 is a problem. The offset was 27 pixels, which is too large, but nonetheless correct. I had to institute the plane fitter at an earlier stage to get it to work. However, the biggest problem: the SCUBA source aligns with 070907_o20 but not the rest of the maps. So I needed to re-fit everything. That was a BIG mistake, we need to check carefully for it in other fields.
Methods Paper: Figures / analysis to produce
The methods paper needs some justification of the number of PCA components used. This will require a map of some field with a range of number of PCA components. Plan: simulate a map of L111 (the most square field) with 0-20 PCA components x 21 iterations and a variety of source sizes and plot the recovered flux vs. number of PCA components. Ideally, do this with both deconvolution and not. Estimated processing time is ~24 hours. Also, a plot of flux vs. iteration number will be useful. Glitch filtering method has been modified: "Glitches are removed by drizzling each bolometer measurement into a given pixel using the mapping M[p], but retaining each pixel as an array of measurements. Then, measurements exceeding $3\times MAD$ (Median Average Deviation) are flagged out in the timestream. In cases where there were too few ($<3$) hits per pixel, the pixel was completely flagged out. This only occurred for pixels at scan edges." Data flagging: Partly covered by deglitching. Many scans were flagged by hand to remove overly noisy scans and those that were observed to confuse the iterative mapper. Hand flagging is more robust than automated and can remove features caused by the filter convolved with the glitch. Creation of astrophysical model: Not entirely sure what this section entails. Should have a subsection on deconvolution though. Jackknifing has not generally been done...