In the process of creating W51 data cubes from the GBT mapping data (project GBT 10B/019), I've had to deal with a lot of bad data.
Some of the bad data comes from misbehaving electronics. All I can say is that they were misbehaving, not how or why - the data from one polarizaiton simply disagrees with the other polarization and feeds spontaneously and for no apparent reason.
I've implemented a waterfall diagnostic plot to help examine the data, it is in my mpl_plot_templates repository: imdiagnostics.py.
A good waterfall looks something like this:
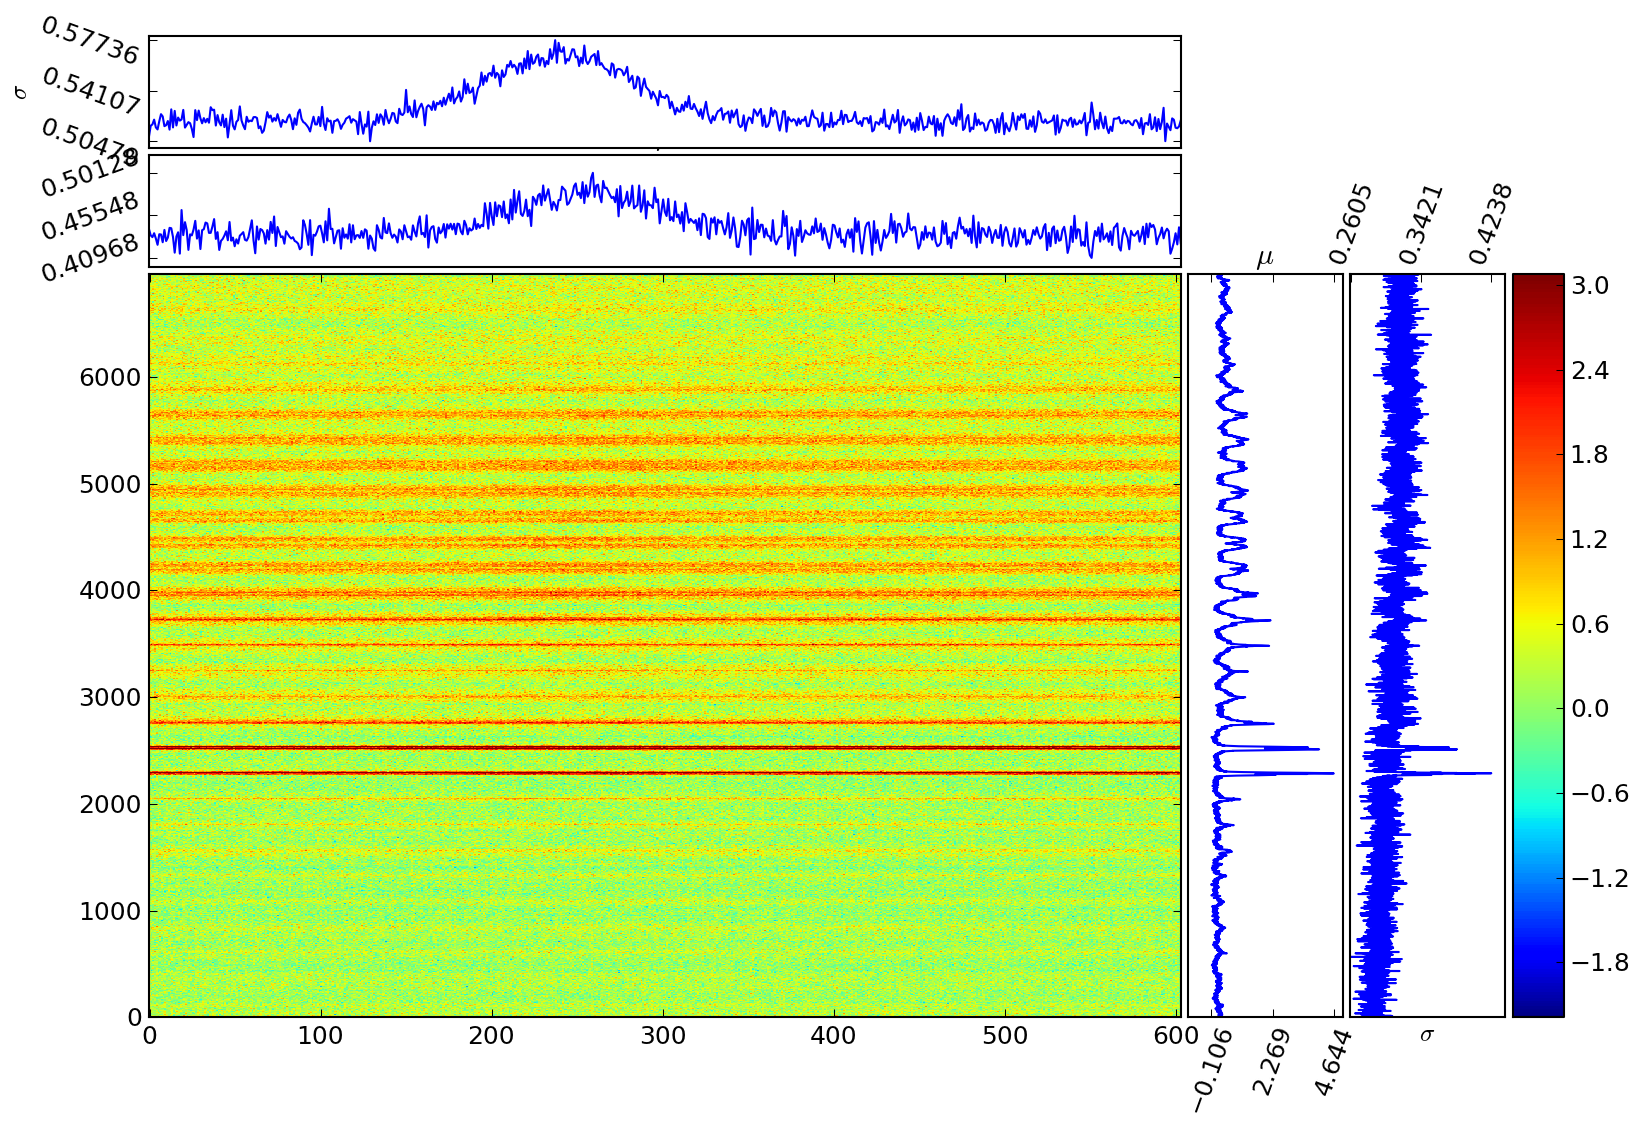
The line plots show the average and standard deviation along each axis; the right side effectively shows timestream continuum data while the top plots show a time-averaged spectrum. This plot is good in that there are clearly signals detected as the scan crosses continuum sources and there is a strong Helium Alpha line detected in the average (though there's no way to read that it's Helium fromt he data as presented). Notably, the noise correlates with the continuum brightness - this is expected; higher TSYS leads to higher noise.
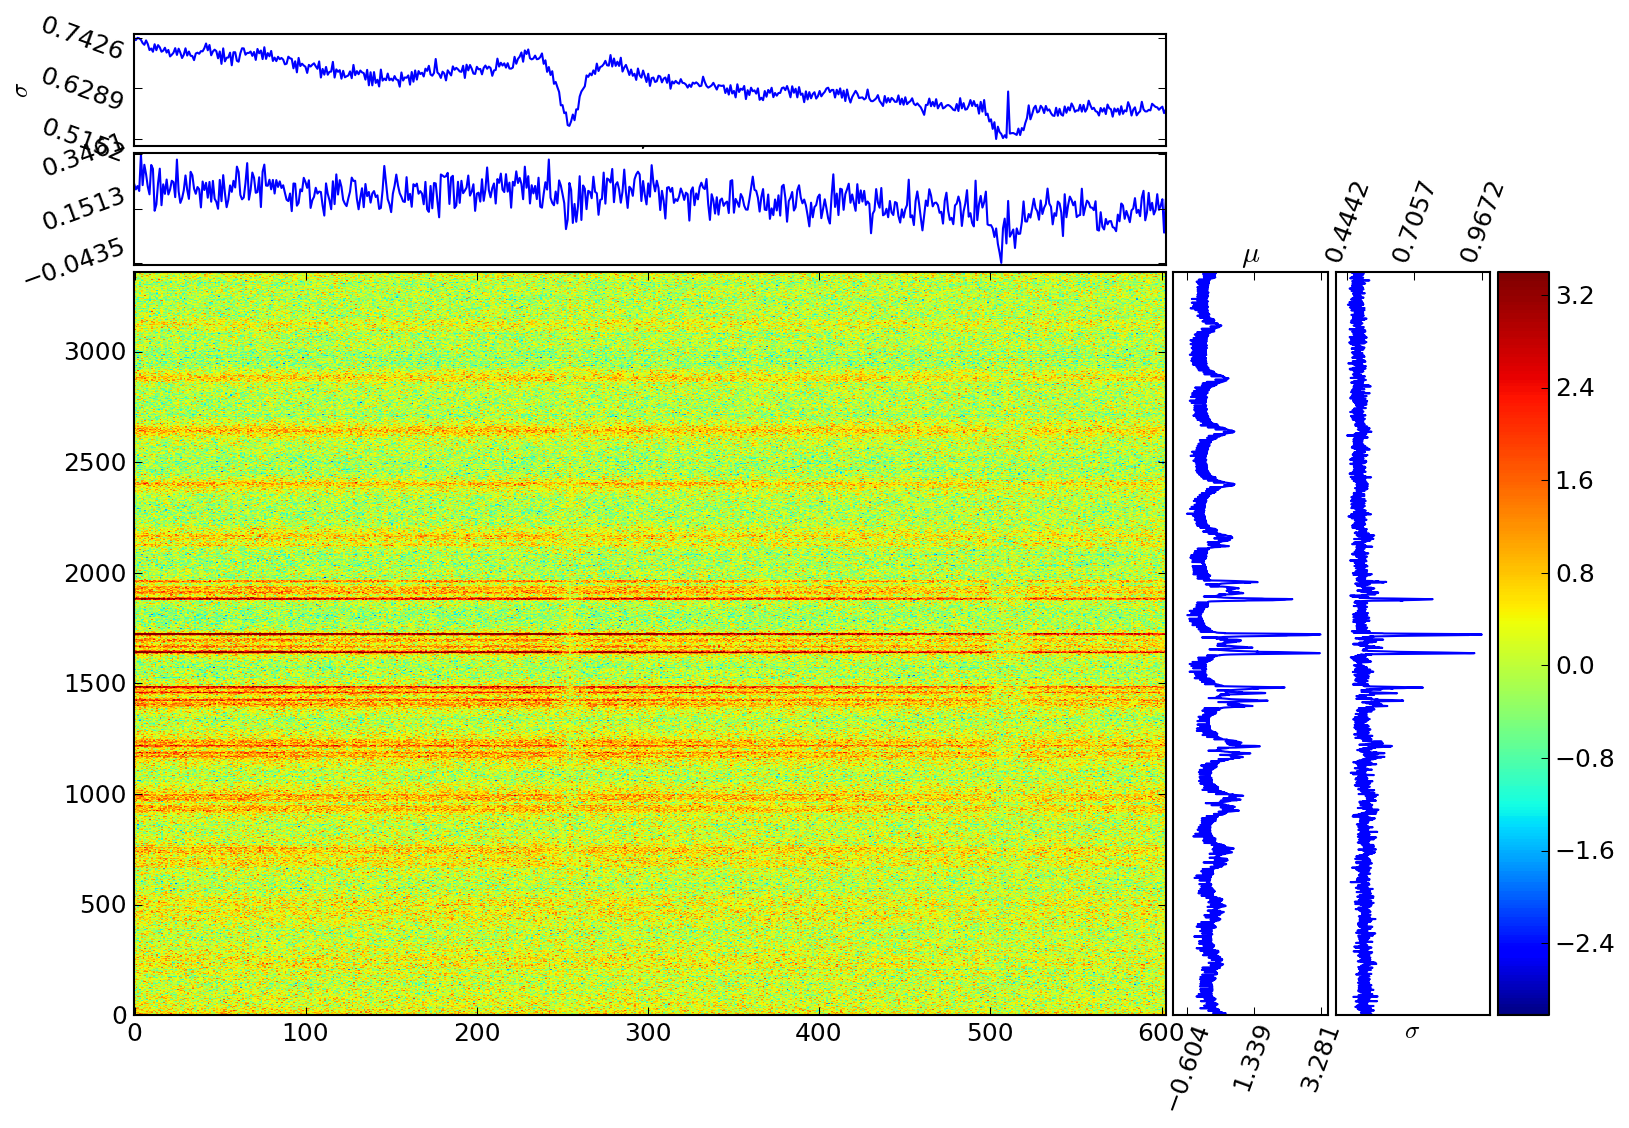
This is an example of a data set with some extremely irritating artifacts. There are apparent absorption lines throughout the spectrum: they are not real. This is a particularly irritating problem because I had resolved it once in the not-too-distant past, but I can't figure out how!! Most likely, I just removed the data from the maps, but that SHOULD be in the code history (git) and is not.