I wanted to see what the approximate depth achieved by (repeated) VLA observations of a few sources was, at least theoretically. This is relatively easy to do:
from astropy import units as u
from astroquery.nrao import Nrao
result = Nrao().query(coordinates=coordinates.SkyCoord.from_name('Sgr B2(M)'),
radius=2*u.arcmin)
import pylab as pl
pl.figure(1)
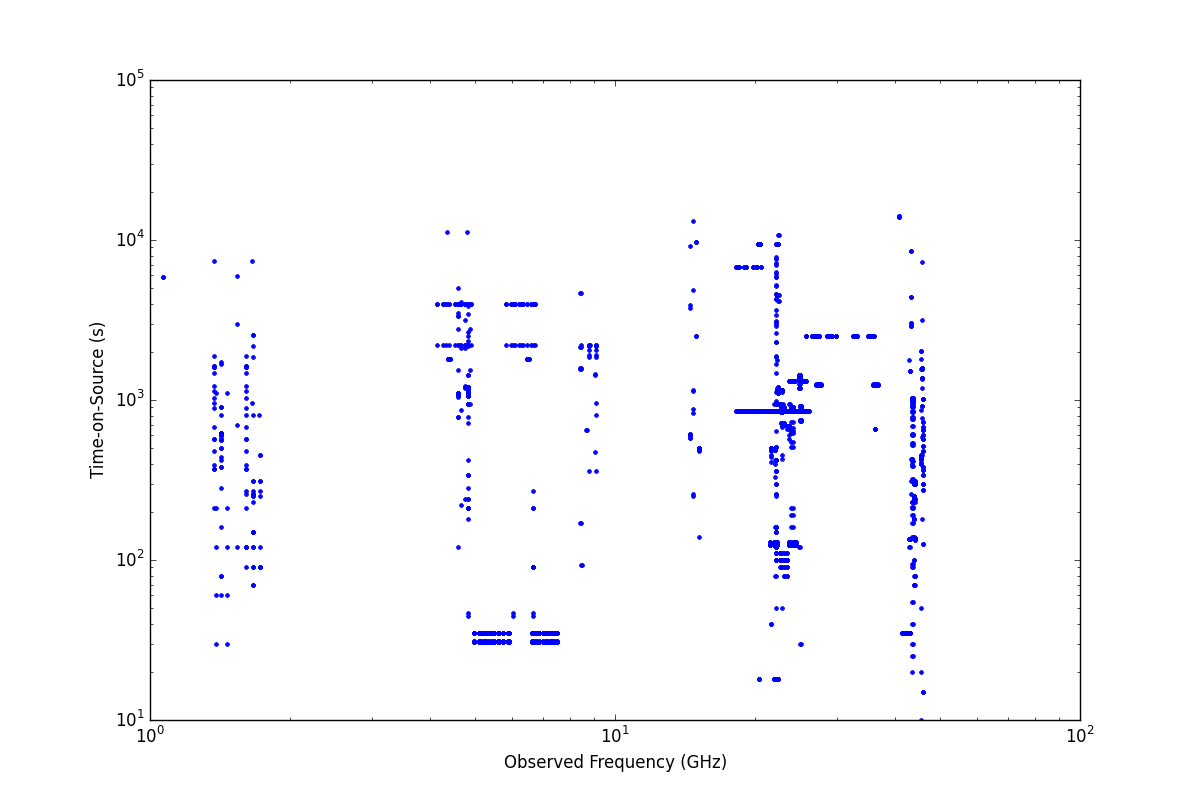
pl.loglog(result['Observing Freq']/1e3, result['TOS'], '.')
pl.xlabel("Observed Frequency (GHz)")
pl.ylabel("Time-on-Source (s)")
pl.figure(2)
pl.loglog(result['Observing Freq']/1e3, result['TOS']*result['Bandwidth'], '.')
pl.xlabel("Observed Frequency (GHz)")
pl.ylabel("Relative depth (Hz s)")