I had a Cycle 3 ALMA program 2015.1.00262.S: Digging for rusty bullets at an explosion site that aimed to detect ferrous oxide, FeO in the shocked outflows of the Orion nebula.
I haven't published anything on this data set because it resulted in a fairly boring non-detection. You can find the source code to retrieve and process the data from here. The nondetection is several orders of magnitude deeper than previous ones, but to demonstrate this definitively, we need to do some more modeling work, which my co-I's and I have decided isn't worth the time, since we're all flooded with very exciting new ALMA data that has interesting detections in it (see salts soon).
In brief, we were looking at a location where we know molecules (H2, molecular hydrogen) and gas-phase iron (Fe II, as seen in in the [Fe II] 1.64 micron lines) are approximately coincident. The most likely (and broadly accepted) explanation is that dust particles are being destroyed (sputtered) in the high-velocity ($>30$ km/s, up to about $100-200$ km/s) shocks produced in an outflow. Since iron in the interstellar medium mostly lives in the cores of dust grains, we thought it might be released in a molecular form detectable by ALMA before being split into an atomic, ionized form.
Despite having a good location and a sensitive observation, we didn't detect any. It might mean that iron is mostly in a different molecular form, or it might mean that when iron gets sputtered out of grains, it never goes into a molecular form at all, instead dissociating straight into atomic form.
There are a few things that, with infinite time, I would do with this data set:
- Come up with a formal upper limit on the FeO abundance.
- Compare the lines we did detect to the outflows and see if we can better constrain their physical conditions
- Catalog the stars and publish the catalog for comparison to other data sets. (actually, this is done: this table contains Gaussian fits to each of the stars in the continuum image (source).)
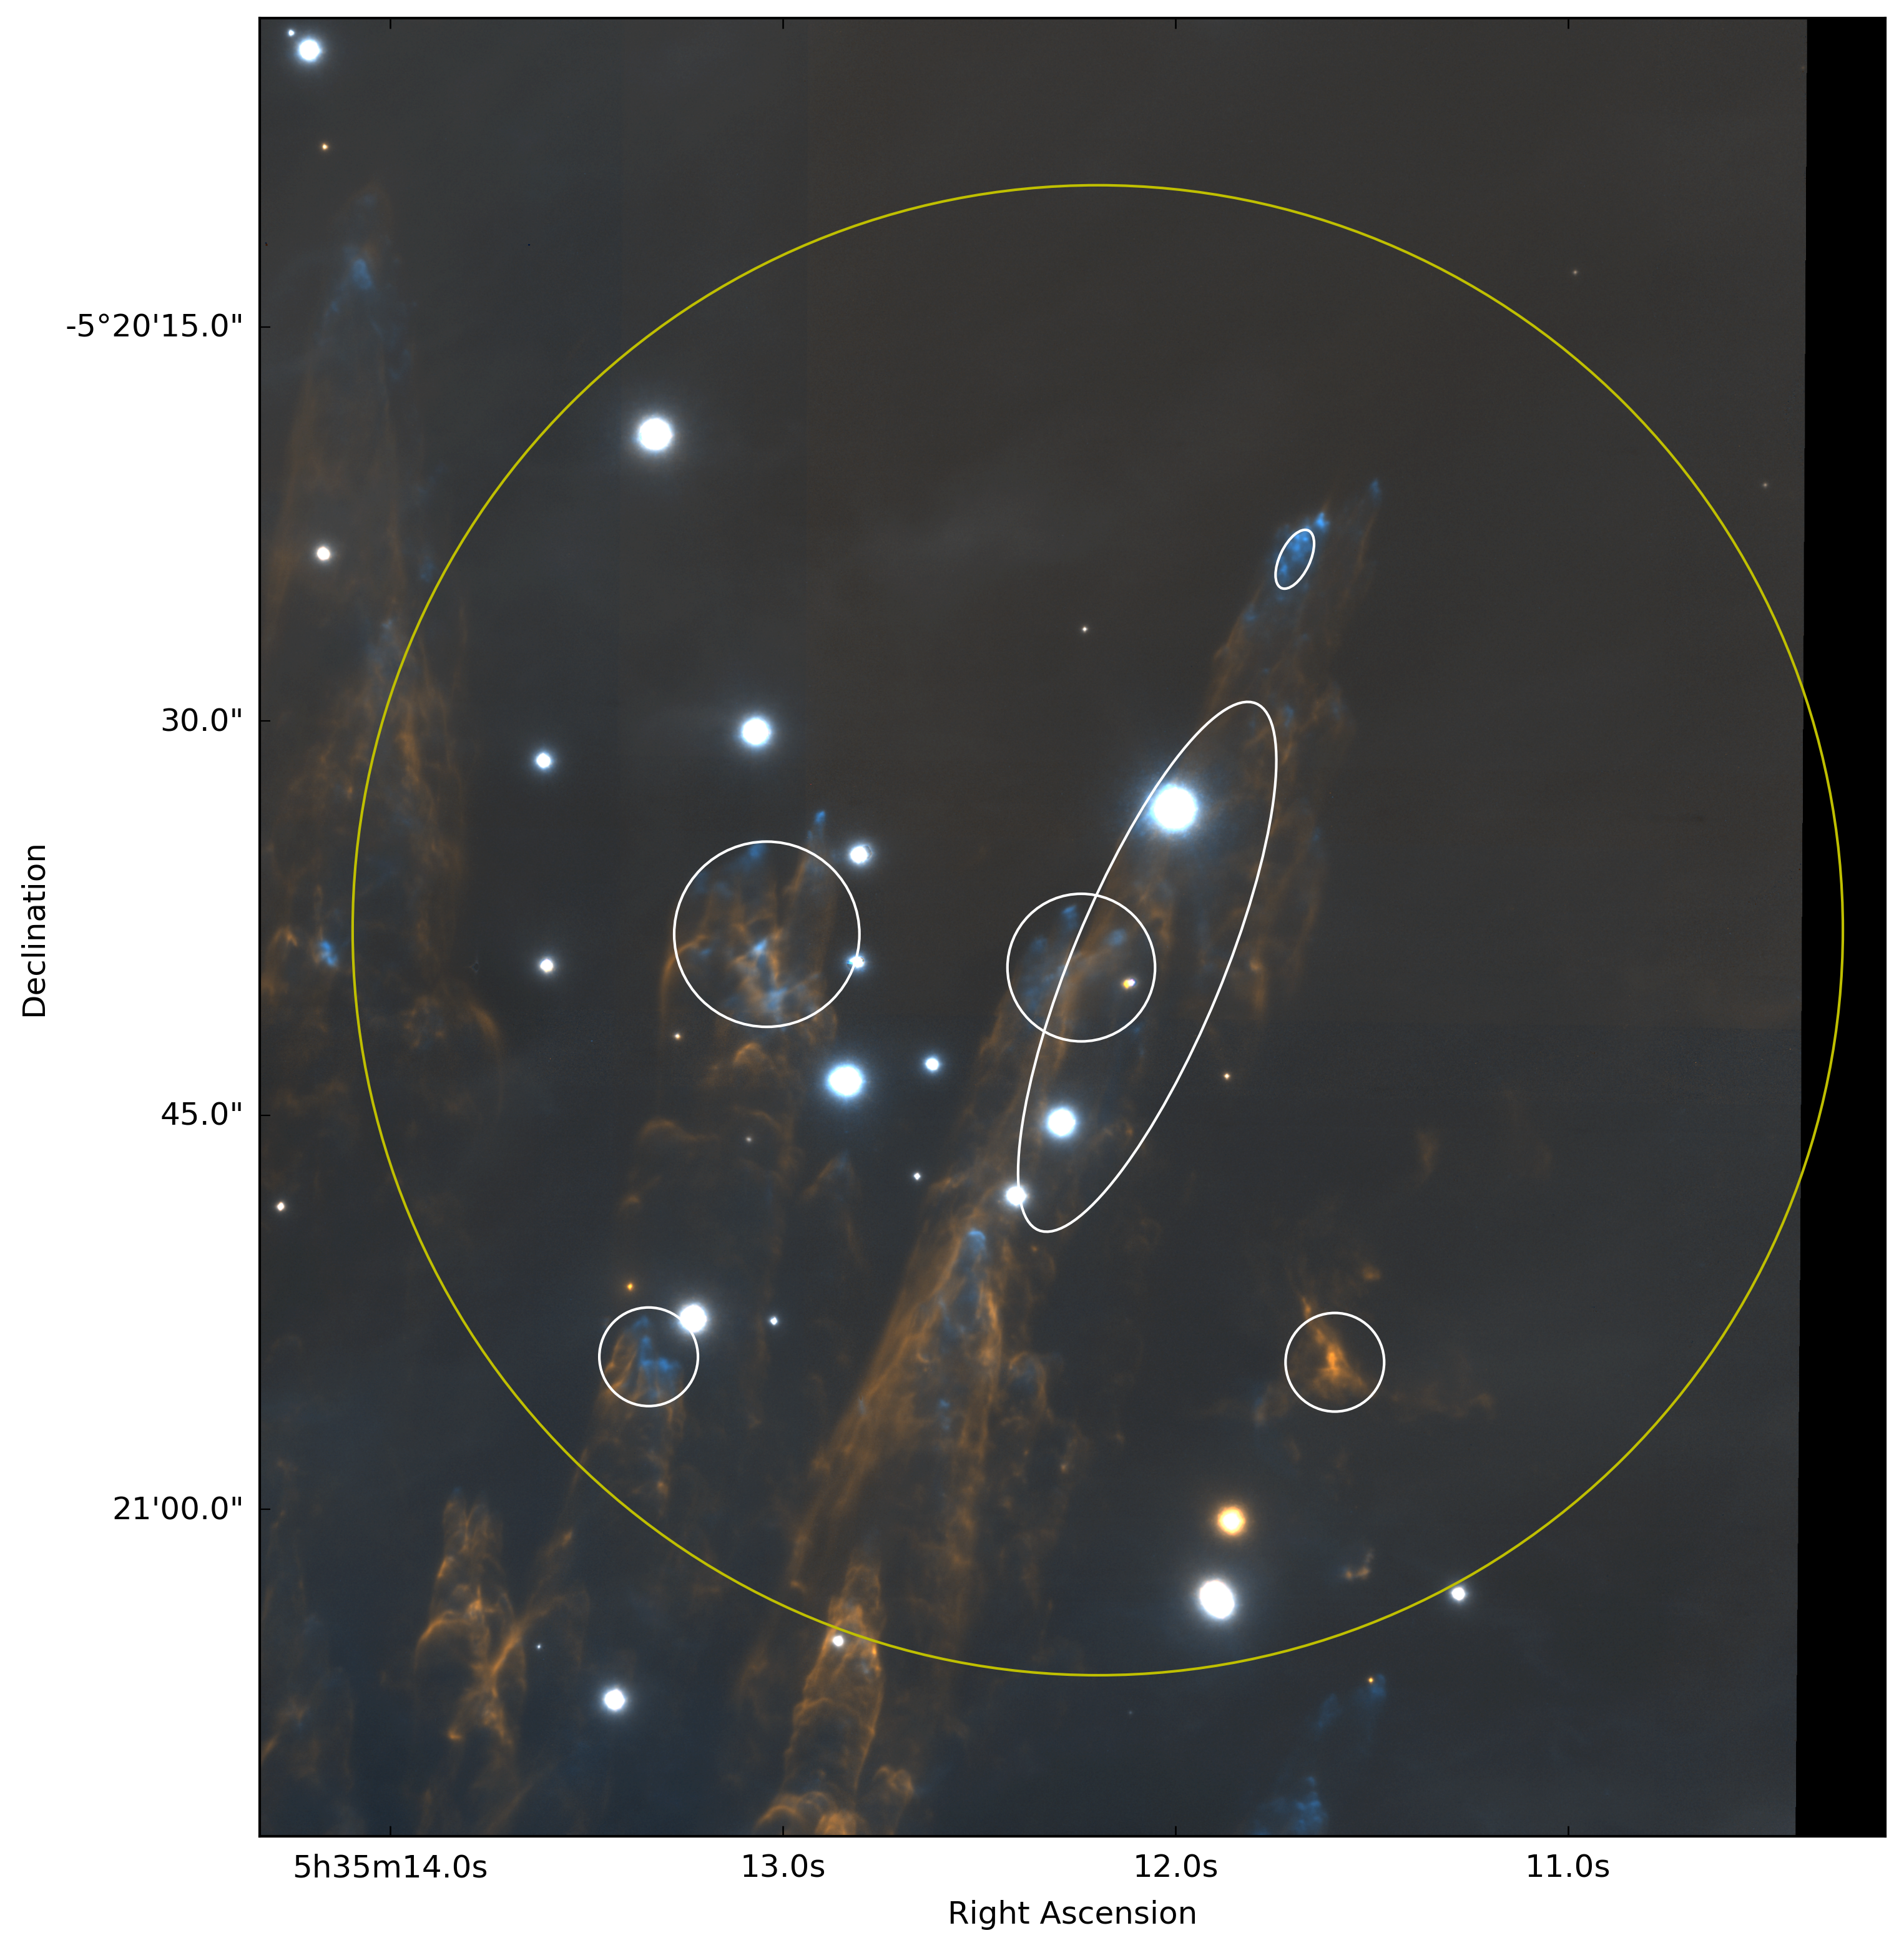
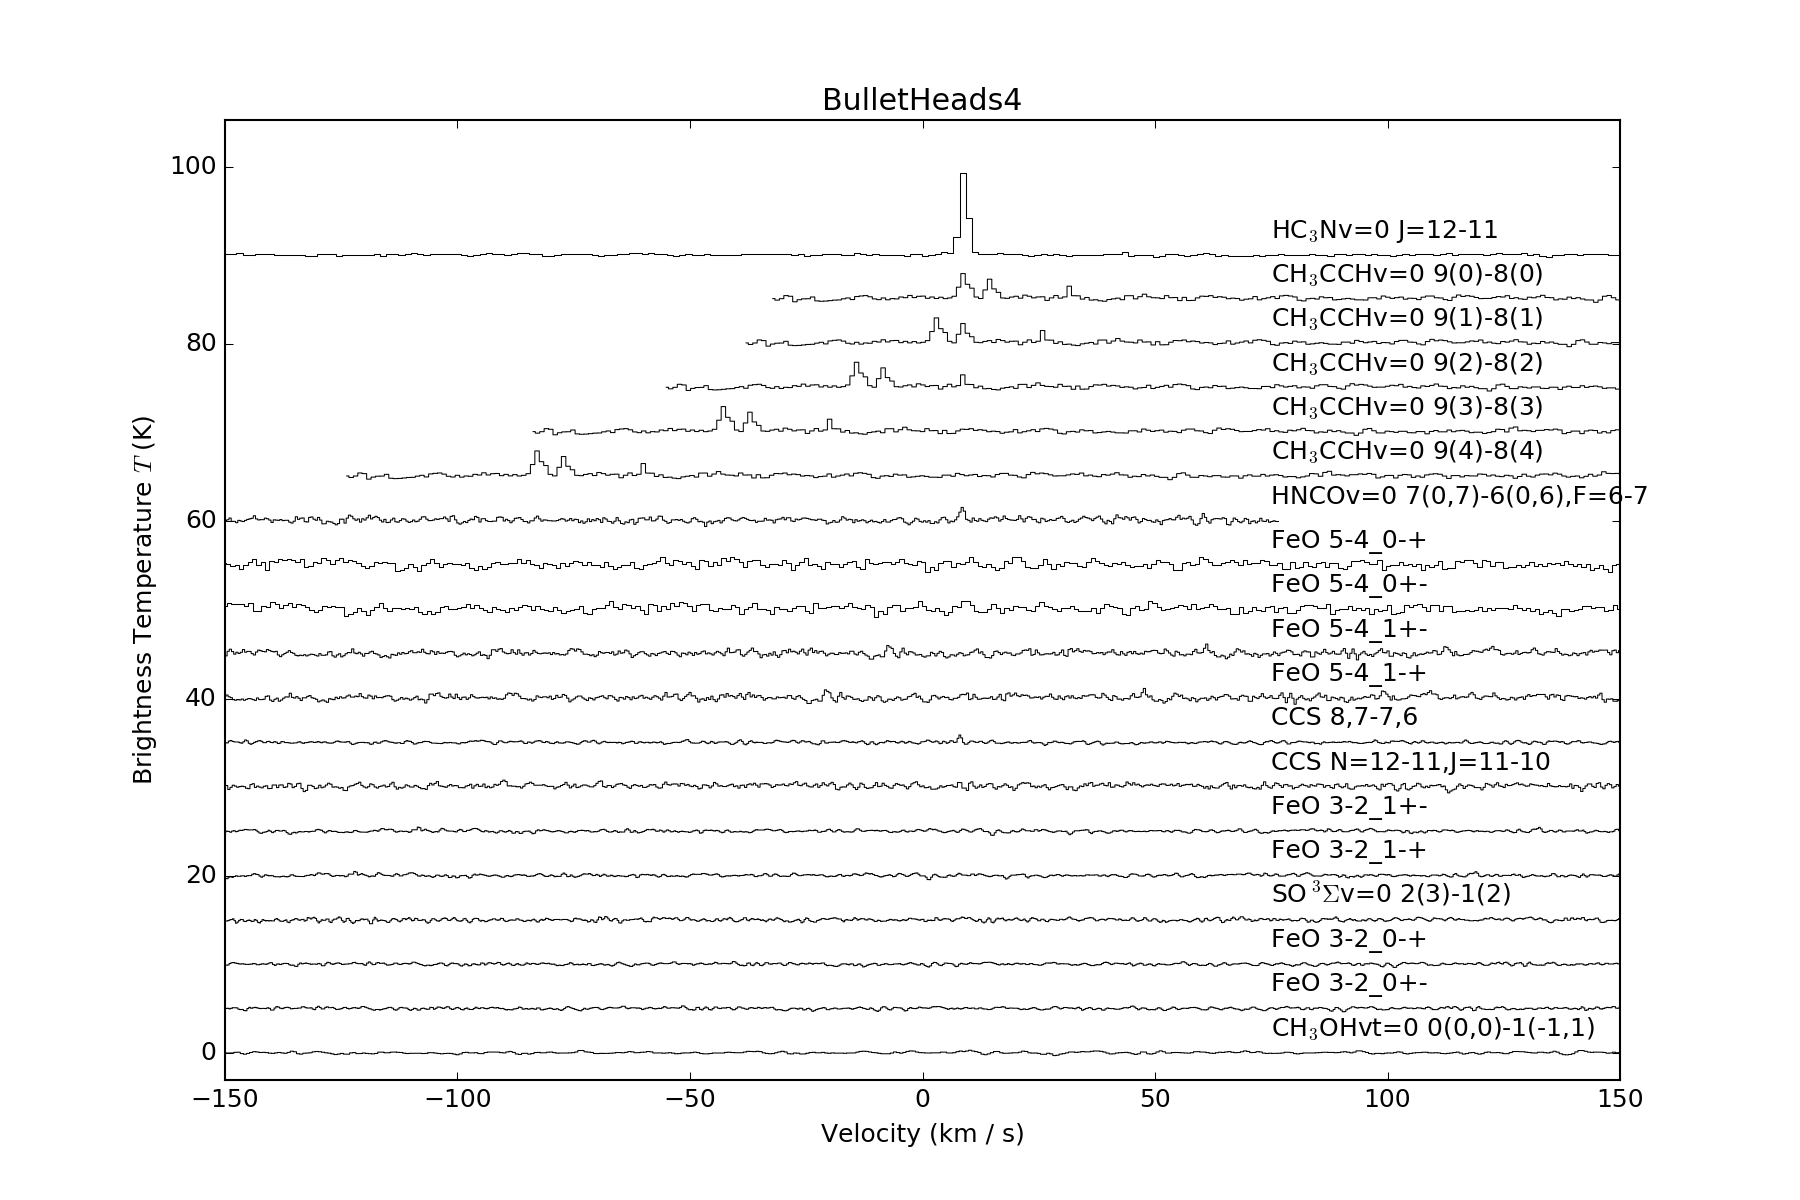
These figure show the apertures we used to extract spectra and search for the lines, then the spectra of different species for one of the apertures. The background image is the H2 (orange) + FeII (cyan) + K-band (mostly white) I made for my 2015 paper with John Bally.