The downsampling failure I noted previously appears to be illusory. It may be that the offset noted only holds for single-frame images, in which there may be many blank pixels. It is possible - though not certain - that the ds1 images were significantly higher than ds5 because more noise-only pixels were included with higher outliers; i.e., ds1 high-outlier noise was being compared to ds5 noise that was lower amplitude.
What led to these conclusions? First, I was getting inconsistent results looking at Uranus in particular - ds5 appeared to have higher fluxes than ds1. This was inconsistent with earlier results on OMC1. Partly, this is because I switched from my hacked-together plots to the much more refined compare_images script, which demonstrated the effect of changing the cutoff of the comparison.
Also, I added in a Pearson Correlation Coefficient computation. Given a single data set with the only difference being downsampling, the data should be perfectly correlated even if there is a flux offset (correlation should be 1, but the best fit slope should not be). It was an indication of a problem when I started seeing correlation coefficients <0.90 for data that had already been sigma-cut; that means that noise was being included in the correlation computations.
Therefore, the approach needed is to cut out the high pixels that are on map edges. This I accomplished by adding an 'aperture' capability to the compare_images code (for Uranus) and cropping using montage and a wcs-based box for Orion.
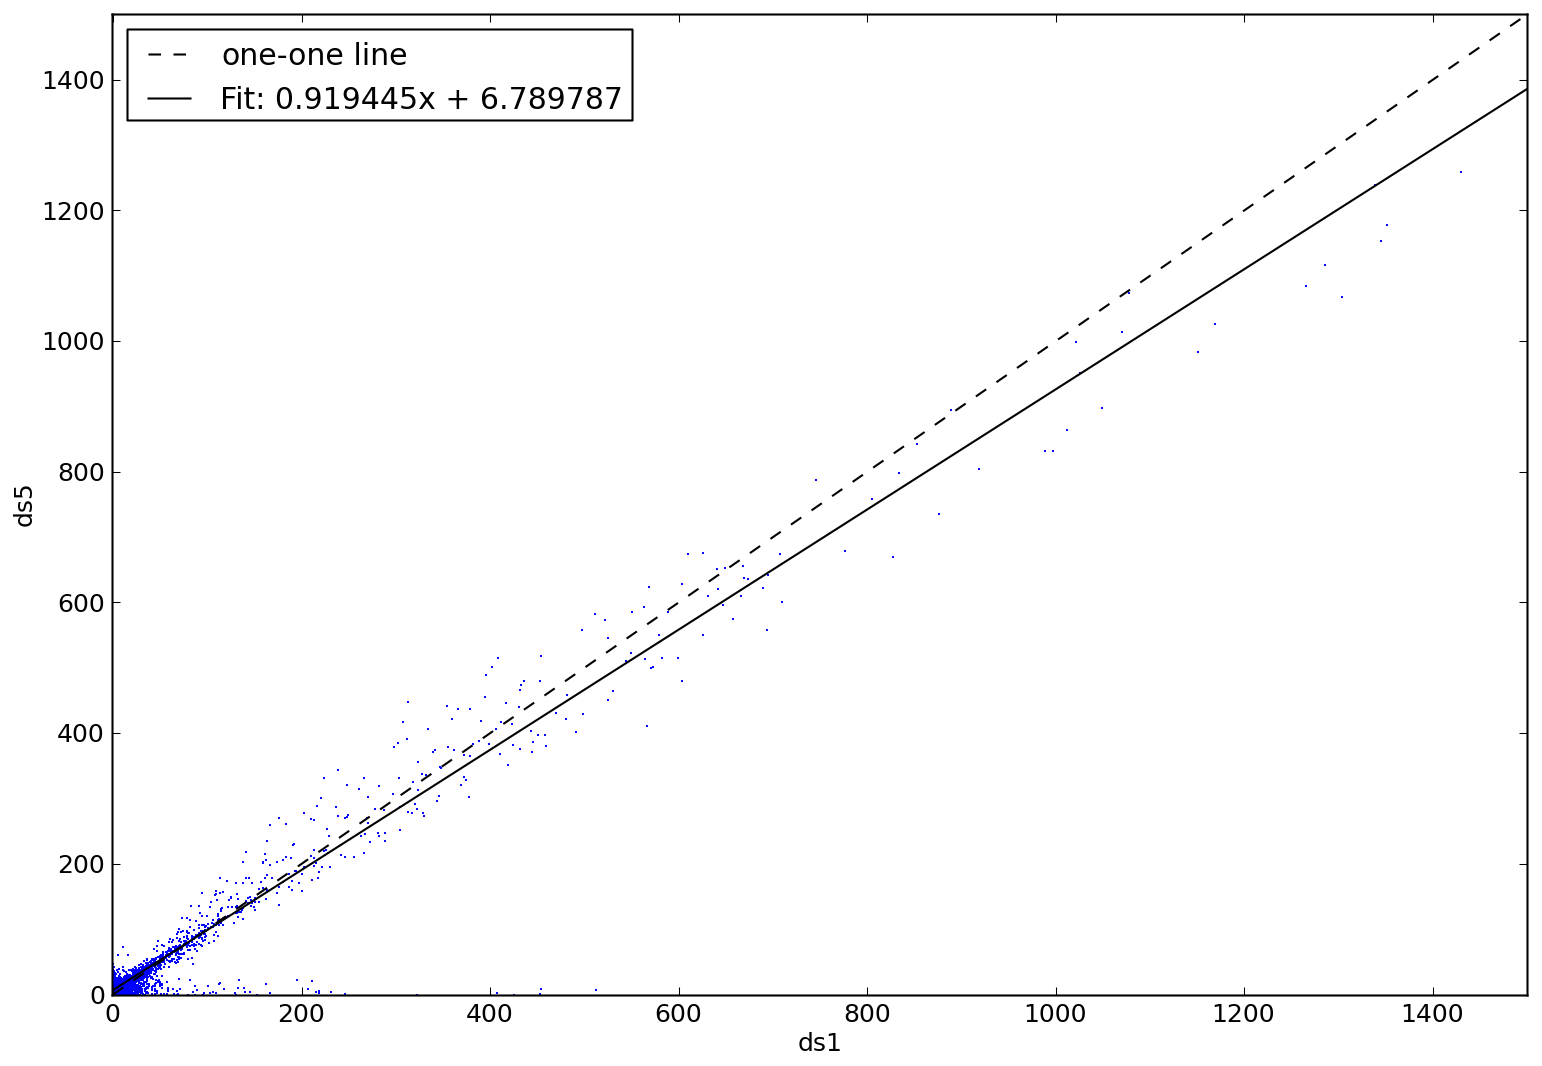
The results... are ambiguous. Wow. In some sub-fields - within the same co-added map - the agreement is near-perfect.

In others, ds1 is clearly > ds5.

What's going on? ds1 does look uniformly more smooth. Note that the disagreement is nearly scale-free:
OK, so given the conclusion in Orion that ds1>=ds5, what's the deal with Uranus?

The first two comparisons are for 1x1° observations; in both cases ds1 < ds5, but by 6% and 24% respectively! The image of Uranus looks much better (because of lack of parallel lines) in the second, more extreme case. In both cases, the ds5 excess is nearly scale-free (not shown).


The 3x1s are also highly discrepant. #12 shows nearly perfect agreement, albeit with high dispersion (low correlation) because of pixel-to-pixel variations around the peak. #13 is the only observation with a huge DS1 excess. It also demonstrates very poor correlation. It looks like the telescope got bumped for the ds5 data (which is not actually possible; recall they're the same data set). What happened here? Maybe a glitch that went unflagged (mad_flagger is off by default for individual scans)?


In observations 4 and 5, we're looking at a 40-50% excess in ds5! What the heck? There really is no clear explanation for this.


But... what? Magically, they come into perfect agreement when the scan axis nearly lines up with the coordinate axis! Or, is this just an effect of the worse weather on night 2?

Next thing to try: masked source map comparison. Unfortunately, masking royally screwed up the long scans - probably because the initial polysub didn't work. And masking in the individual point source maps did nothing... so that pretty much rules out atmospheric oversubtraction, doesn't it? What else could be causing this offset? 0pca looks the same as 13pca, give or take, so it's not the atmospheric subtraction. Could the downsampling result in an offset in the bolo-scaling? Where else in the process could things go wrong? Tomorrow, need to investigate .sav files with pyflagger...