Delining refers to the process of removing electronic noise that is aliased to particular frequencies by the discrete sampling of the data. Typical electronic noise is at 60 Hz with some width. It gets aliased to these frequencies: linefreqs = [10.05+findgen(10)*1.2,10.05-((findgen(7)+1))*1.2] The 10.05 Hz and 20.10 Hz are the worst in most cases, and they are wider. For the above lines, we "remove" a bandwidth of 0.09 Hz by averaging over the neighboring 0.5 Hz on either side. For the wider lines, we remove 0.5 Hz by averaging over the neighboring 1.5 Hz on either side. There are a few new things about the delining process that did not exist in James' old version:
- The wide-band lines are removed
- A check is performed before removing the lines - they are only removed if the line region mean is 2-sigma above the average region (as computed via median and mad)
- The replaced noise is computed via median/mad, and the new noise level is set 5x lower than in the neighboring region
Now, some examples:


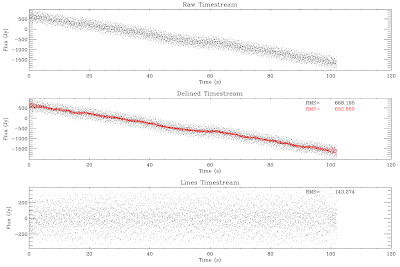
The timestream (left) and PSD (right) of a "pretty good" bolometer. There is a lot of noise in lines, but note that the peak power is 2-3 orders of magnitude below the PSD peak. In this case the "Power" is in Jy. There is little astrophysical information below ~14" (9 Hz), and there should be none below 7.2" (17 Hz), but there is plausibly information at these scales. It therefore makes sense to save as much information as possible. As can be seen in the delined PSD, the peaks drop by a substantial fraction, but not all the way - that's because these lines are wider than typically observed. Unfortunately, I don't have any really good ideas about how to fix this issue - I think fitting gaussians to each line, while attractive, is going to be prohibitively expensive in both programmer and processor time. However... it would be a very interesting project to undertake. In the timestream, it can be seen that the RMS drops substantially when the lines are filtered out (note that the timestream is strongly dominated by large-scale structure, so 'substantial' is really based on the RMS of the lines removed).


The next two plots look identical to the previous ones. In principle, they include the wide-band delining. However, in this case, the satellite lines to either side of the 10 Hz line are too strong and prevent identification of the 10 Hz line. This is unfortunate, again, but no obvious solution presents itself.


Now we come to a truly problematic bolometer. The lines completely dominate the power spectrum. Narrow line removal fails.


Wide line removal does a much, much better job, dropping the RMS by an order of magnitude.... but the bolometer probably still needs to be removed, since the astrophysical signal is 2-3 orders of magnitude below that.


The 2010 data had much worse line noise and had to be delined. JS accomplished this by throwing out all data above a certain frequency, but I prefer the delining approach. It is clearly effective, but again leaves much to be desired. Should the flagged bandwidth be increased? What about the extra lines around 18 Hz?

Again, the wide line flagging fails because of the satellite lines.